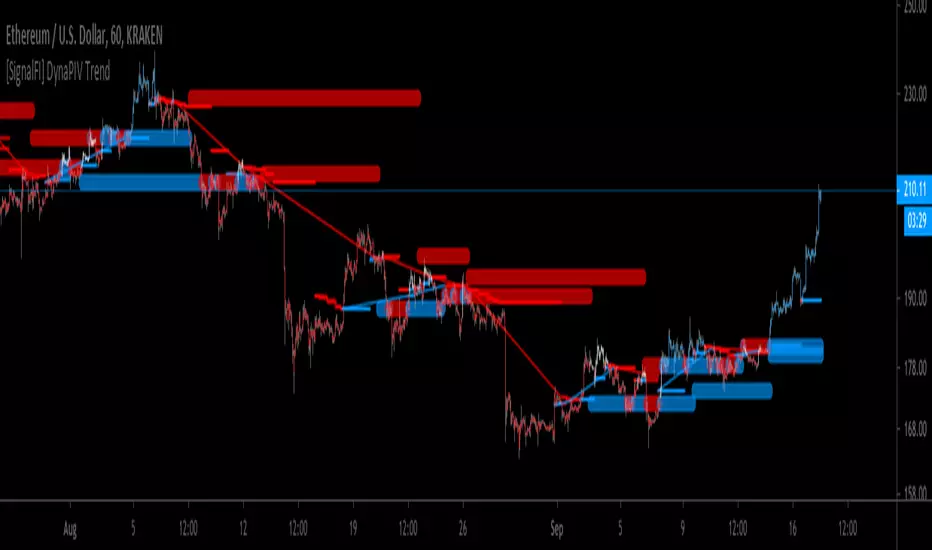
[SignalFI] DynaPIV TrendWelcome!
We're pleased to introduce DynaPIV Trend! This single script provides a array of valuable trend information that can help in short term scalping strategies, and helping define trend strength across support and resistance points.
The heart of DynaPIV is an dynamic, volatility adjusted moving average based on fibonacci ratios. The script creates a visual representation of trend based on the pivots created with this dynamic moving average as has both short and long term support and resistance lines delineated by color and thickness.
In general, the script will color bars according to the trend. By default, our safe mode is enabled which will filter out potential false breakouts, as well identify channeling zones (where bars are white). Disabling Safe Mode will provide more opportunities for scalping, however increases the risk of trend invalidation. By nature the trader is meant to follow the comprehensive visual presented by DynaPIV Trend, inclusive of horizontal and diagonal painted support and resistance lines.
NOTE: The script is useful for timeframes 5M to 2HR. However the recommended is 30M - 1HR. Using the script on higher timeframes will invalidate the dynamic nature of the DynaPIV Trend volatility calculation and thus render the trend invalid.
SignalFI was created to help traders and investors to effectively analyze the market based on the Golden Mean Ratio (Fibonacci numbers), plan a trade and ultimately execute it. To help inform and educate market decisions we developed a set of Trading Indicators which are available on TradingView.
SignalFI indicators are just that, indicators. Our indicators are generally configured to use completely historical data (negating repaint), and we advise all alerts created with SignalFI indicators to be fired upon "close" of the current candle. Our indicators can provide valuable context and visualization support when performing market analysis and executing buy and sell decisions. However. we are not financial experts, and all information presented on this site or our other media outlets are for educational purposes only.
For subscription information, visit www.signalfi.net and follow us on twitter: @signalfi_
Mata Wang Kripto
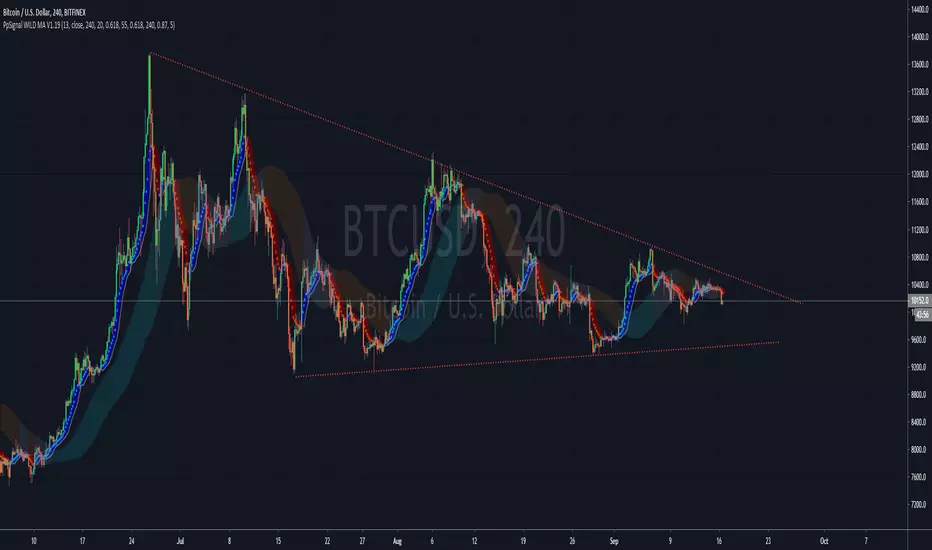
PpSignal WILD MA V1.19Wilder's Moving Average. Also called Wilder's Smoothed Moving Average, this indicator is similar to the Exponential Moving Average. Compared to other moving averages, Wilders MA responds more slowly to price changes, where an n-period Wilder MA gives similar values to a 2n- period EMA.
We added a standard deviation average.
buy when wilder is in blue color and standard average in aqua color.
Se ll when all is red
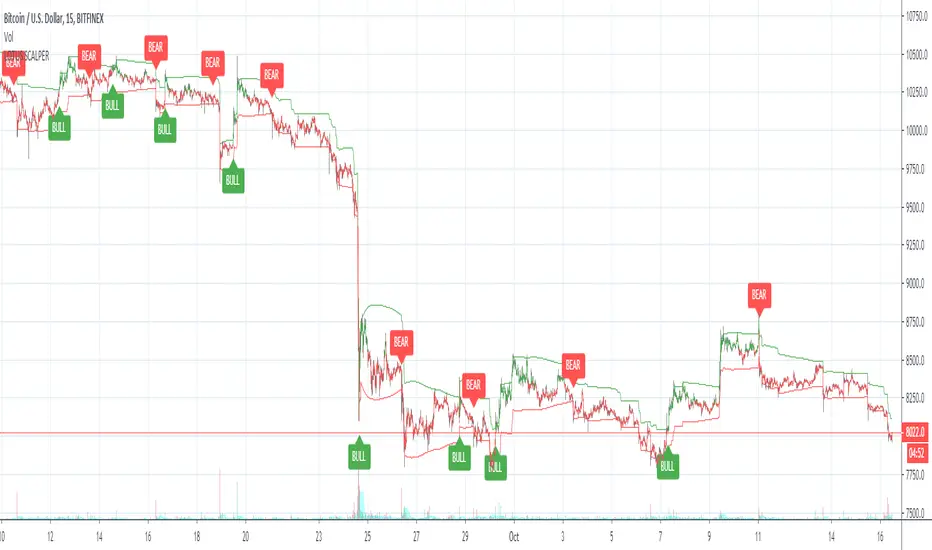
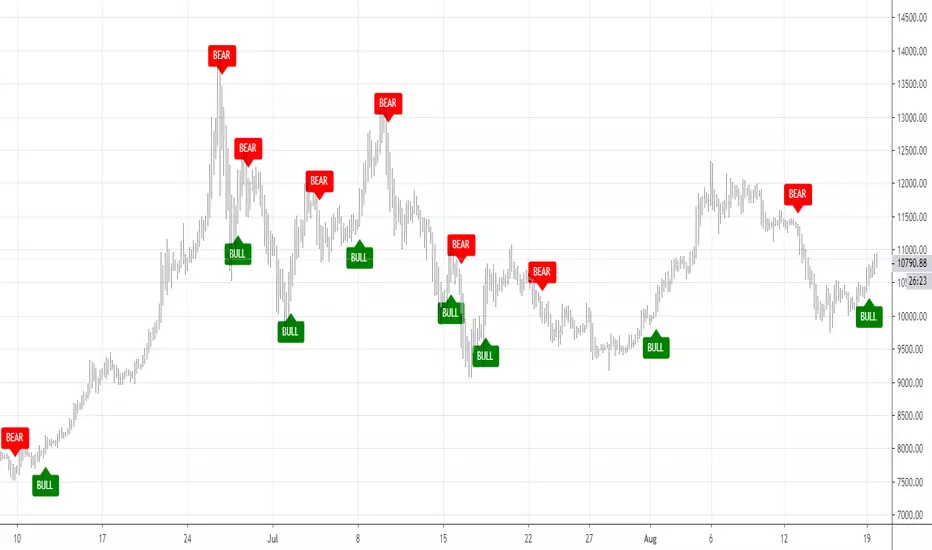
Lotus scalperWelcome to the Lotus scalper. This indicator is designed for scalping the 15m and 30m timeframes.
BULL = Buy
BEAR = Sell
Enjoy and let me know if you have questions!
You can also set alerts with this indicator!
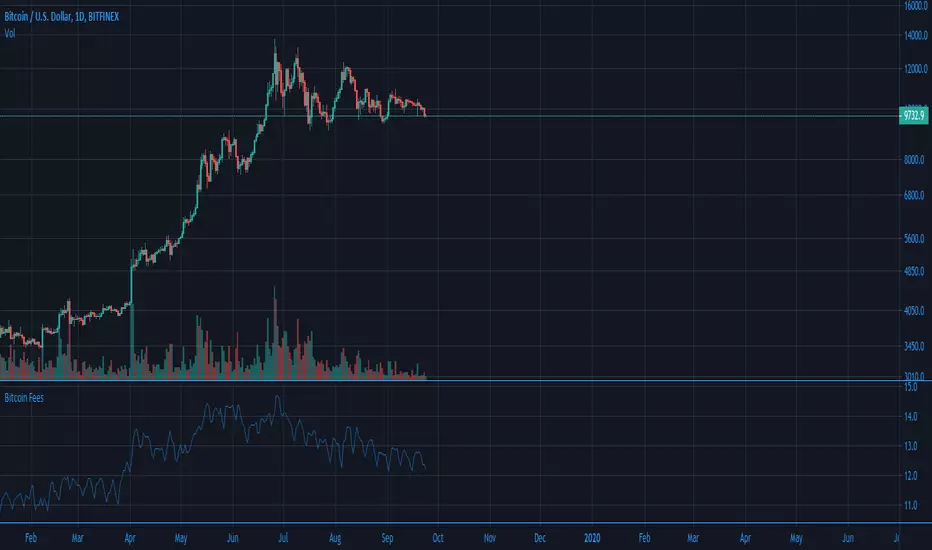
Crypto Break-even FeeWhen I started trading cryptocurrency, I lost money because I didn't take the fees enough into account. Therefore I created my own indicator to quicqly see the break-even selling price of the selling price if I want a predifined profit level.
2 lines are added to the graph. These lines move together with the current price.
- One line indicating the break-even selling price (depending on your maker/taker strategy). For beginners I suggest taking the taker strategy (mostly 0.25%)
- Another line indicating the selling price in order to make a predifined profit %
There are 2 parameters you can set:
- Desired profit (%)
- Maker/Taker Fee (%)
Always happy with a little appreciation ;-) Bitcoin wallet: 18522cAc7YDwwXTvtckXKb1kP33upVDRFR

Lancelot ATR Volume MeterThis is an experiment I did a while back ago.
I often think On Balance Volume is a great indicator as trend direction and volume cannot lie.
However, I bumped into a few problems.
It is slow, doesn't show volatility and often time it is prone to chop.
That's why I added ATR to the equation.
Original OBV calculation
src > 0? : +volume : src < 0? -volume
Modified OBV with ATR
src > 0 ? +volume * (volume / atr) : src < 0? -volume * (volume / atr)
I have used 2 ema for this modified OBV.
ema 3
ema 18
By adding ATR to the equation we can smooth out many erratic price movement. (Stop hunting)
Also, when price move slowly but steady, often prepping for a big move, this indicator will move faster.
In short, this indicator prevents you from being stop hunted and also provide great entry for a trending market.
Works well on BTCUSD XBTUSD, as well as other major liquid Pair.
Feel free to follow me on Twitter @Lancelot_Auger for more free Alpha.
Please acknowledge my effort by like and follow.
And lastly,
Save Hong Kong, the revolution of our times.

Ori Bitcoin Transaction FeesThis indicator shows natural logarithm of Bitcoin fees with Ori Trend. There is also a toggle for line view.
Lancelot Band - ATR Reversal+Trending IndicatorThis is an indicator I created recently, with the mind of spotting where price might reverse and where the price is trending. You can see this as the primary indicator for your system, however, it is recommended you use this in conjunction with other confirmation indicators.
This script focus solely on ATR or Average True Range.
This indicator is the combination of the baseline from the Ichimoku cloud and the concept of the Keltner channel.
Baseline period = 14
ATR period = 14
ATR Mult = 1.5
For reversal
Long when price crossover Lower band & Stop loss at xLower band
Sell when price crossunder Upper band & Stop loss at xUpper band
For Trend Following
Long when price crossover xUpper band and Stop loss at Upper band
Short when price crossunder xLower band and Stop loss at Upper band
Again, you will need other indicators to help you to succeed in this system. This indicator will not generate the best exit for your position but will generate a good entry signal when you use it with both volume indicator and exit indicator.
Works well on BTCUSD XBTUSD, as well as other major liquid Pair.
Feel free to follow me on Twitter @Lancelot_Auger for more free Alpha.
Please acknowledge my effort by like and follow.
And lastly,
Save Hong Kong, the revolution of our times.

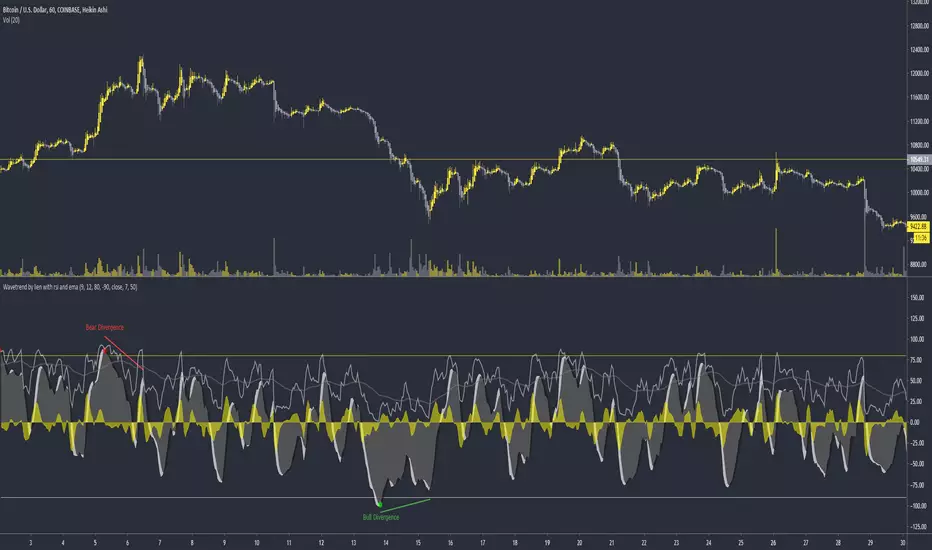
Liens wavetrend with rsi and emaWavetrend with rsi and ema. I would use the rsi and ema on high timeframes like the 4 hour to exit trades when it crosses.
Rsi and ema crosses can also be used to enter without divergence.
Test it out, try it on different TF. Enjoy :-)
Alert-QuarryLake Indicator Map - ATR Trend Following Strategy A lot of times I don't like my chart crowding with indicators, thus the reason for creating this script for my strategy QuarryLake.
This script also comes with alert.
Below is the explanation for QuarryLake
I have also updated the script in version 4.
This strategy consists of 3 indicators that I found works quite well together.
Keltner Channel, Waddah Attah Explosion, and Volatility Stop.
You can find WAE here
KC Period = 200
KCATR = 5
Vstop Period = 3
Vstop Mult = 1.5
Long when close > KC, close > Vstop, WAE trendUp
Short when close < KC, close < Vstop, WAE trendDown
Works well on BTCUSD XBTUSD, as well as other major liquid Pair.
Feel free to follow me on Twitter @Lancelot_Auger for more free Alpha.
Please acknowledge my effort by like and follow.
And lastly,
Save Hong Kong, the revolution of our times.

Trend Confirmation Indicator - Triple OBVDear all, you might wonder is there a confirmation indicator that has a high hit rate, is dependable, and could rely on the information it gives you when making a decision?
Here I present an indicator I developed specifically for cryptocurrency, in the minds of eliminating fakeouts and traps.
Trend is always invalid then there is a lack of volume, so by tracking the momentum of price direction & volume, we can have a ballpark about where the market is moving to.
On balance volume
obvshort = ema3
obvmedium = ema9
obvlong = ema26
This is a lagging indicator, which means it's not good at predicting reversal.
This is also the reason why
long signal = obvshort > obvmedium and obvshort > obvlong
shortsignal = obvshort < obvmedium and obvshort < obvlong
both without obvmedium >< obvlong
This indicator will not lie to you.
At last
Save Hong Kong, the revolution of our time.

CloudRest ATR based cloudThis is an indicator I have been working on for the past 2 years, developed specifically for cryptocurrency.
It is primarily a trend following indicator with great success and it performs the best in 4hrs to the weekly chart.
There are two components of this indicator.
The baseline from Ichimoku cloud and volatility stop .
baseline period = 26
volatility stop = 1.5ATR, 3
You can view this as the main component of a trend following system but you will need other confirmation indicators to confirm your entry.
Feel free to modify the script for your own system.
Feel free to follow me on twitter @Lancelot_Auger
I will be posting more content in the future, stay tuned.
And lastly,
Free hong kong, the revolution of our time!

Cyatophilum Shooting Stars 1m [ALERTSETUP]A Scalping Script Setup for the 1m Timeframe, using the cheesy candle pattern "Shooting Stars" plus some Trend Detection, Stop Loss and Take Profit integrated system, allowing these nice backtest results.
Currently in continuous development / real time testing on BitMEX data.

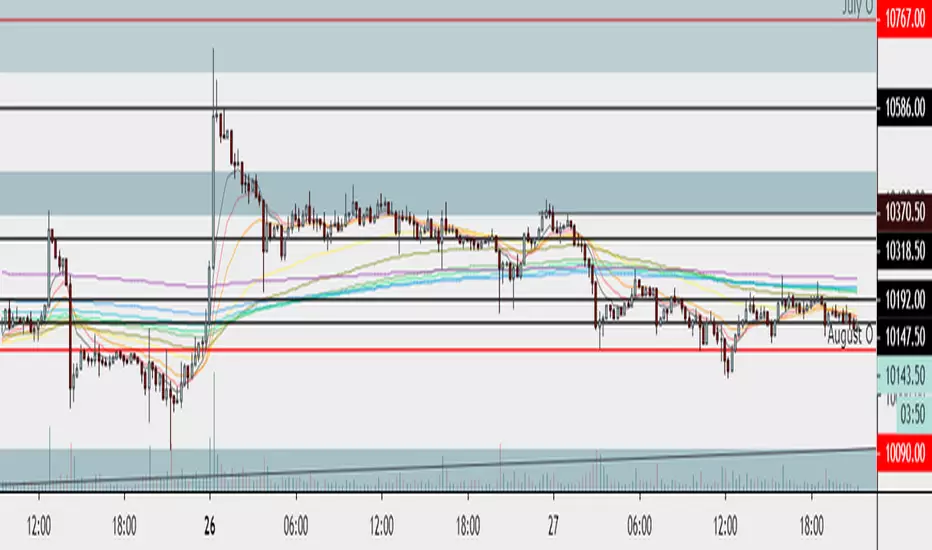
BullShrimp's 10EMAsA simple bundle of EMAs with some odd numbers that I found good confluence on 15min, 1h, 4h, 12h, 1d, 1w on BTC and on ALTS.
Works good for dynamic S/R on LTF and high probability target on MTF and HTF.
Try it out during your scans.
Lemme know what you think.
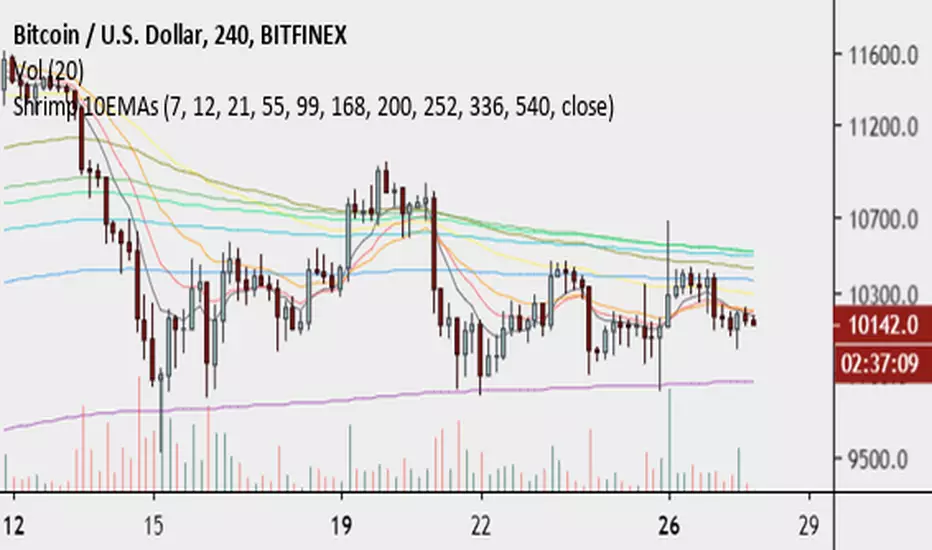
Shrimp 10EMAsA simple bundle of EMAs with some odd numbers that I found good confluence on 15min, 1h, 4h, 12h, 1d, 1w on BTC and on ALTS.
Works good for dynamic S/R on LTF and high probability target on MTF and HTF.
Try it out during your scans.
Lemme know what you think.


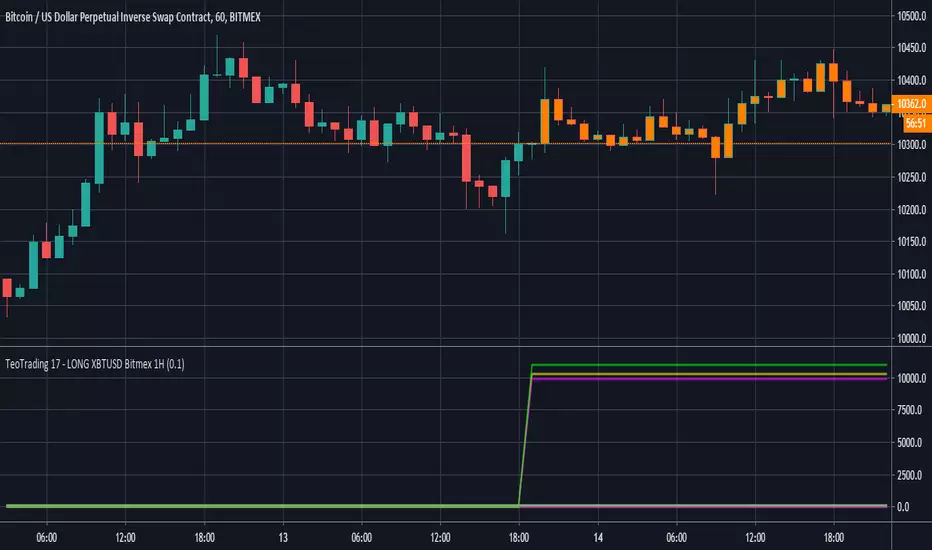
TeoTrading 17 - LONG XBTUSD Bitmex 1HLong Strategy for XBTUSD - Bitmex with real time statistics.
For use in 1 Hour Scale.
Various Volume RSI (USDT PRO)RSI that displays USDT (Tether) of various cryptocurrency exchanges together.
色々な暗号通貨取引所のUSDT(Tether)をまとめて表示するRSIです。
CRYPTOCAP:USDT
CRYPTOCAP:USDT.D
BINANCE
BITFINEX
POLONIEX
KRAKEN
BITTREX
HITBTC
HUOBI
詳細などはこちらにて
note.mu

Dark Cloud Cover Pattern Trading Setupthis study is another script based on the candlestick pattern . there are a few filters implemented to be applied to the output result to clear out noises. it sounds like finding real Dark Cloud Cover instances are too rare (interesting though!).
Dark Cloud Cover
it is a bearish reversal candlestick pattern where a down candle (typically bearish) opens above the close of the prior up candle (typically bullish) and then closes below the midpoint of the up candle. The five criteria for the Dark Cloud Cover pattern are:
An existing bullish uptrend.
An up (bullish) candle within that uptrend.
A gap up on the following day.
The gap up turns into a down (bearish) candle.
The bearish candle closes below the midpoint of the previous bullish candle.
all these criteria are implemented in code to produce a more accurate result.
please provide me with your valuable comments,
thanks for your attention,

Piercing Line Pattern Trading Setupthis study is the first one of a series of scripts based on the candlesticks pattern which will be published over time. There are several such scripts out there that can be found on TradingView but they seem to be inaccurate with a lot of noises and messy hard to understand code. In this script, I've tried to have a clean and easy to get
of the pattern itself and the method for detecting it with enough parameters to filter out the noises.
Piercing Pattern
A piercing pattern is a technical trading signal that is formed by a closing down day with a good-sized trading range, followed by a trading gap lower the following day with a bullish candlestick that covers at least half of the upward length of the previous day's bearish candlestick body, finishing with a close higher for the day. A piercing pattern often signals the end of a small to moderate downward trend. A piercing pattern can serve as a potential indicator for a bullish reversal. This pattern is formed by two consecutive candlestick marks. The first candlestick is bearish signifying a down day and the second is bullish signifying an up day. When a trader is watching for a bullish reversal any red candlestick followed by a green candlestick could be an alert. There are a few things that set a piercing pattern apart from a general red candlestick green candlestick pattern. In a piercing pattern, a green candlestick follows a red one with a significant gap in the red candlestick close and green candlestick open. On the second-day green candlestick, the candlestick’s body must also lengthen to cover at least half of the previous day’s red candlestick . Generally, the gap down and substantial increase to the closing price are good signs for a reversal. In a piercing pattern, the second-day green candlestick will close at or above the midpoint of the previous day’s red candlestick.
please provide me with your valuable comments,
thanks for your attention,

ExpressHow to use this indicator: This is an all-around indicator that is capable of being used on any chart. From 5m time frames up to 1 Day time frames.
There are BULL/BEAR signals which represent BUY/SELLS. You can set alerts with this indicator as well.
No back tester is currently provided with the Express.
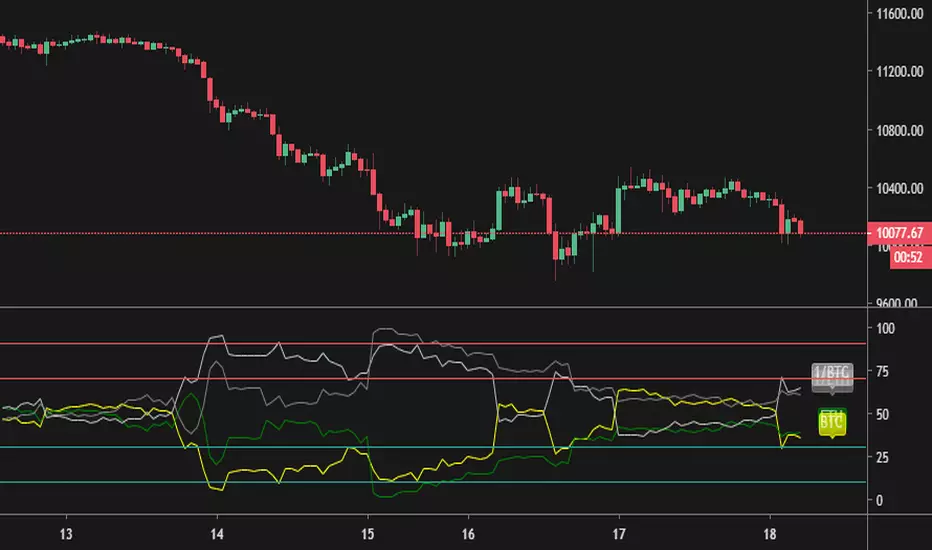
Various Volume RSI (BTC vs ETH) [mushoku]RSI to show btc and eth fight(BINANCE)
Binance(バイナンス) のBTCとETHを同時に表示する RSI です。
無料で使用できます。
こちらでも簡単ですが紹介しています。
note.mu
Classic MaverickWelcome to the Classic Maverick.
How to use: Apply to any chart, on any time frame. You will see BULL and BEAR signals on the chart. A BULL signal represents an entry/buy in, and a BEAR represents an exit/ sell.
You can use the Maverick to scalp on low time frames such as the 5m, 15m, 30m etc. Or use the Maverick on higher time frames such as the 1hr, 2hr, 4hr.
You can use regular candles but Heikin Ashi are recommended for better accuracy.
Settings alerts: You can easily set buy/sell alerts by selecting Maverick in the set alerts tab and selecting BULL for buy alerts and BEAR for sell alerts.
