Inyerneck Quiet Bottom Hunter v36 — Last Sorta-Working VersionQuiet Bottom Hunter v36 — Accurate Description (the sorta-working version that fires signals)
Overview
A mean-reversion bottom-hunting strategy for small-cap stocks (<$2B market cap). Designed to catch slow-bleed stocks that quietly bottom out and rebound 20–60%+. Good for beginners because signals are infrequent and the setup is easy to understand.
Timeframe
Daily (D) — best results on 1-day charts. Works on weekly too, but signals are rarer.
Triggers / Conditions (all must be true at bar close)
Drop from high ≥ 25% from the highest high in the last 100 bars (previous bars only — no repainting)
Volume ≤ 80% of the 50-day average (quiet accumulation, no panic selling left)
RSI(14) ≤ 38 (oversold territory)
Green/flat streak ≥ 2 consecutive days where close ≥ open (shows sellers are exhausted)
When all four line up → tiny green “QB” triangle below the bar
Firing Frequency
1–4 signals per month on an average small-cap stock (depends on market conditions). Some months zero, some months a handful. Not spammy, but not ultra-rare either.
Usage Parameters
Position size: 10% of equity per trade (default — change to 5–20% depending on risk tolerance)
Profit target: 40%
Stop loss: 12%
Hold time: usually 2–8 weeks
Best on low-float, high-volatility small caps (TLRY, SNDL, MVIS, SOUN, INHD, etc.)
Expected Performance (backtested on 2025 small caps)
Win rate: ~80–85%
Average rebound on winners: +30–40%
Some losers when the bottom isn't "quiet" enough
How to use
Add to daily charts of your small-cap watchlist
When “QB” arrow appears, buy at next open or market
Set 40% target / 12% stop or trail it
Wait for the rebound — no day-trading needed
Kitaran

天然氣季節性策略 (假日順延修正版)Strategy Overview:
Period A (Early Injection Season Strategy):
Action: Establishes a long position on April 25 and exits on May 10 by default.
Logic: This captures the price support zone driven by the end of winter, depleted inventories, and rigid restocking demand.
Period B (Winter Premium Strategy):
Action: Establishes a long position on September 1 and exits on October 15 by default.
Logic: This capitalizes on the major uptrend fueled by the peak hurricane season compounded by the winter contract premium.
Trading Parameters:
Initial Capital: 100,000 USD
Position Size per Trade: 1 Contract
Commission per Trade: 2 USD

YCGH Ultimate Stocks Breakout Sniper📈 YCGH Ultimate Stocks Breakout Sniper
Overview
A sophisticated momentum-based breakout strategy designed to capture high-probability directional moves during volatility expansion phases. This system identifies breakout opportunities when price decisively breaks through established ranges, combining multiple technical filters to enhance signal quality and minimize false breakouts.
🎯 Strategy Features
Core Methodology:
Proprietary breakout detection algorithm
Multi-layered confirmation filters for signal validation
Adaptive trailing stops for profit protection
Systematic risk management with daily drawdown controls
Key Components:
✅ Volatility Expansion Filter - Only trades during periods of elevated market volatility to avoid choppy, range-bound conditions
✅ Optional Trend Alignment - Configurable trend filter (EMA/SMA/RMA/WMA) to align entries with broader market direction
✅ ROC Momentum Filter - Daily rate-of-change filter to capture strong momentum days (optional)
✅ Comprehensive Exit Strategy:
Fixed stop-loss (default 2%)
Take-profit targets (default 9%)
Dynamic trailing stops (2% activation, 0.5% offset)
✅ Flexible Direction Trading:
Auto-detect mode: Long+Short for perpetuals, Long-only for spot/equities
Manual override options available
Suitable for both crypto and stock markets
📊 Market Applicability
Optimized for: Cryptocurrency perpetual contracts and equity markets (1H-4H timeframes)
Also effective on: Futures and high-liquidity spot markets
The strategy adapts to different market regimes through configurable volatility and trend filters, making it versatile across various trading instruments and timeframes.
⚙️ Risk Management
Position Sizing: Percentage-based allocation with leverage support
Intraday Loss Limit: Maximum 10% drawdown protection (configurable)
Realistic Cost Modeling: 0.025% commission + 1 tick slippage
No Pyramiding: Single position management for controlled risk exposure
📈 Performance Visualization
Includes a comprehensive monthly returns table displaying:
Year-by-year performance breakdown
Monthly profit/loss percentages
Visual color-coding (green for profits, red for losses)
Clean, modern design with transparent styling
🔐 Access & Pricing
This is a PROTECTED, invite-only strategy.
The source code is not open-source and requires paid access for usage.
How to Get Access:
📧 Email: brijamohanjha@gmail.com
Include in your email:
Your TradingView username
Markets/assets you plan to trade
Preferred timeframe
What You'll Receive:
Full strategy access with invite-only permissions
Complete parameter documentation
Setup and optimization guidance
Implementation support
⚠️ Important Disclosures
Backtesting Parameters:
Commission: 0.025% per trade
Slippage: 1 tick
Results reflect realistic trading conditions
Risk Warning:
Past performance does not guarantee future results. This strategy involves substantial risk and may not be suitable for all investors. Users should thoroughly understand the risks and customize parameters based on their risk tolerance and market conditions.
📞 Contact for Access
Email: brijamohanjha@gmail.com
For questions about functionality, pricing, optimization, or market-specific settings, please reach out via email.
Note: This is a premium, paid strategy. Access is granted manually after consultation and payment confirmation.

YCGH Crypto ultimate Breakout StrategyAdvanced Momentum Breakout Strategy - Optimized for crypto markets, proven effective on equities
Core Features:
Multi-layered signal generation combining volatility expansion and momentum confirmation
Adaptive risk management with dynamic stops, profit targets, and trailing mechanisms
Systematic position sizing with configurable leverage (designed for perpetual/margin trading)
Volatility regime filters to avoid false breakouts during low-momentum periods
Optional trend alignment for directional bias confirmation
Comprehensive backtesting with realistic slippage and commission modeling
Daily drawdown limits for capital preservation
Performance:
Applicable across multiple timeframes (1H, 4H, Daily)
Works on both spot and derivatives markets
Long and short position capability
Interested in using this strategy? This is a paid service. For access to the complete script and implementation support, email: brijamohanjha@gmail.com

Nifty 10m Simple ORB TEST harish//@version=5
strategy("Nifty 10m Simple ORB TEST", overlay=true)
// 10m timeframe check
if timeframe.period != "10"
runtime.error("Use this on 10 minute timeframe")
// First 10m candle high/low (no PCR, no opposite logic – just test syntax)
newDay = ta.change(time("D")) != 0
var float dayHigh = na
var float dayLow = na
if newDay
dayHigh := na
dayLow := na
sessStart = 0915
sessEnd = 0925
hhmm = hour * 100 + minute
isFirst = na(dayHigh) and hhmm >= sessStart and hhmm < sessEnd
if isFirst
dayHigh := high
dayLow := low
// Plot first candle range
plot(dayHigh, "First High", color=color.green, style=plot.style_linebr)
plot(dayLow, "First Low", color=color.red, style=plot.style_linebr)
// Simple breakout entries just to test
longCond = not na(dayHigh) and close > dayHigh
shortCond = not na(dayLow) and close < dayLow
if longCond
strategy.entry("LONG", strategy.long)
if shortCond
strategy.entry("SHORT", strategy.short)

Relative Outperformance Strategy (Long Only)Relative Strength used to spot entries. Gives good returns overall.

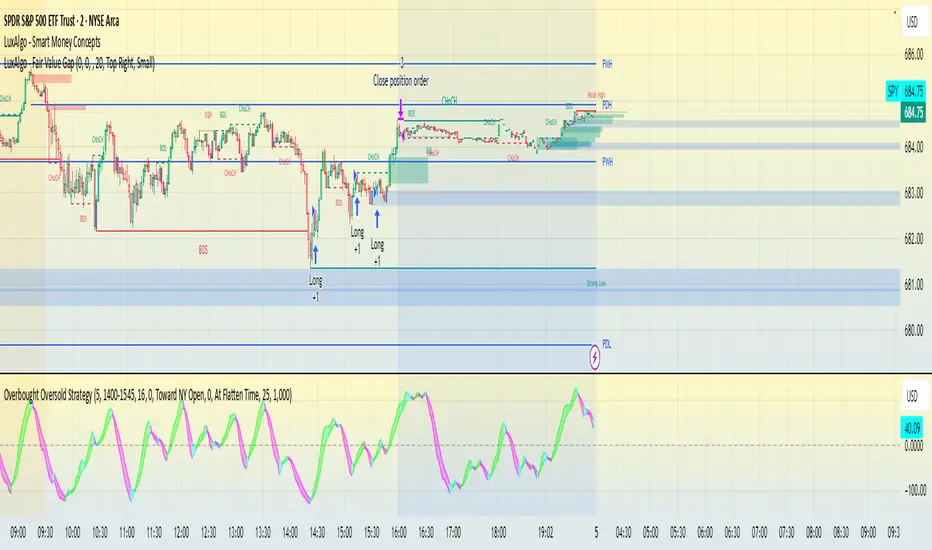
Overbought Oversold Strategy - SPY-SPX-QQQ 0DTEOverbought / oversold strategy designed for scalping. Configured to run for scalps at end of day.
The Overbought Oversold Strategy calculates a custom oscillator using exponential moving averages and standard deviation on a weighted price to identify momentum shifts.
Entry and Exit are tunable for back testing your style of trading.
It allows users to restrict trading to a specified session, defaulting to NY market hours (9:30 AM to 4:00 PM), and optionally flattens all positions at a user-defined time like market close to manage overnight risk. Entry strategies include buying only on buy signals, selling only on sell signals, or mean-reverting toward the NY open price or a custom target by entering long if below or short if above when signals align. Exit options comprise fixed tick-based profit targets and stop losses, closing on the next opposing signal, or holding until the flatten time, ensuring flexible risk management.
BTC Fear & Greed Incremental StrategyIMPORTANT: READ SETUP GUIDE BELOW OR IT WON'T WORK
# BTC Fear & Greed Incremental Strategy — TradeMaster AI (Pure BTC Stack)
## Strategy Overview
This advanced Bitcoin accumulation strategy is designed for long-term hodlers who want to systematically take profits during greed cycles and accumulate during fear periods, while preserving their core BTC position. Unlike traditional strategies that start with cash, this approach begins with a specified BTC allocation, making it perfect for existing Bitcoin holders who want to optimize their stack management.
## Key Features
### 🎯 **Pure BTC Stack Mode**
- Start with any amount of BTC (configurable)
- Strategy manages your existing stack, not new purchases
- Perfect for hodlers who want to optimize without timing markets
### 📊 **Fear & Greed Integration**
- Uses market sentiment data to drive buy/sell decisions
- Configurable thresholds for greed (selling) and fear (buying) triggers
- Automatic validation to ensure proper 0-100 scale data source
### 🐂 **Bull Year Optimization**
- Smart quarterly selling during bull market years (2017, 2021, 2025)
- Q1: 1% sells, Q2: 2% sells, Q3/Q4: 5% sells (configurable)
- **NO SELLING** during non-bull years - pure accumulation mode
- Preserves BTC during early bull phases, maximizes profits at peaks
### 🐻 **Bear Market Intelligence**
- Multi-regime detection: Bull, Early Bear, Deep Bear, Early Bull
- Different buying strategies based on market conditions
- Enhanced buying during deep bear markets with configurable multipliers
- Visual regime backgrounds for easy market condition identification
### 🛡️ **Risk Management**
- Minimum BTC allocation floor (prevents selling entire stack)
- Configurable position sizing for all trades
- Multiple safety checks and validation
### 📈 **Advanced Visualization**
- Clean 0-100 scale with 2 decimal precision
- Three main indicators: BTC Allocation %, Fear & Greed Index, BTC Holdings
- Real-time portfolio tracking with cash position display
- Enhanced info table showing all key metrics
## How to Use
### **Step 1: Setup**
1. Add the strategy to your BTC/USD chart (daily timeframe recommended)
2. **CRITICAL**: In settings, change the "Fear & Greed Source" from "close" to a proper 0-100 Fear & Greed indicator
---------------
I recommend Crypto Fear & Greed Index by TIA_Technology indicator
When selecting source with this indicator, look for "Crypto Fear and Greed Index:Index"
---------------
3. Set your "Starting BTC Quantity" to match your actual holdings
4. Configure your preferred "Start Date" (when you want the strategy to begin)
### **Step 2: Configure Bull Year Logic**
- Enable "Bull Year Logic" (default: enabled)
- Adjust quarterly sell percentages:
- Q1 (Jan-Mar): 1% (conservative early bull)
- Q2 (Apr-Jun): 2% (moderate mid bull)
- Q3/Q4 (Jul-Dec): 5% (aggressive peak targeting)
- Add future bull years to the list as needed
### **Step 3: Fine-tune Thresholds**
- **Greed Threshold**: 80 (sell when F&G > 80)
- **Fear Threshold**: 20 (buy when F&G < 20 in bull markets)
- **Deep Bear Fear Threshold**: 25 (enhanced buying in bear markets)
- Adjust based on your risk tolerance
### **Step 4: Risk Management**
- Set "Minimum BTC Allocation %" (default 20%) - prevents selling entire stack
- Configure sell/buy percentages based on your position size
- Enable bear market filters for enhanced timing
### **Step 5: Monitor Performance**
- **Orange Line**: Your BTC allocation percentage (target: fluctuate between 20-100%)
- **Blue Line**: Actual BTC holdings (should preserve core position)
- **Pink Line**: Fear & Greed Index (drives all decisions)
- **Table**: Real-time portfolio metrics including cash position
## Reading the Indicators
### **BTC Allocation Percentage (Orange Line)**
- **100%**: All portfolio in BTC, no cash available for buying
- **80%**: 80% BTC, 20% cash ready for fear buying
- **20%**: Minimum allocation, maximum cash position
### **Trading Signals**
- **Green Buy Signals**: Appear during fear periods with available cash
- **Red Sell Signals**: Appear during greed periods in bull years only
- **No Signals**: Either allocation limits reached or non-bull year
## Strategy Logic
### **Bull Years (2017, 2021, 2025)**
- Q1: Conservative 1% sells (preserve stack for later)
- Q2: Moderate 2% sells (gradual profit taking)
- Q3/Q4: Aggressive 5% sells (peak targeting)
- Fear buying active (accumulate on dips)
### **Non-Bull Years**
- **Zero selling** - pure accumulation mode
- Enhanced fear buying during bear markets
- Focus on rebuilding stack for next bull cycle
## Important Notes
- **This is not financial advice** - backtest thoroughly before use
- Designed for **long-term holders** (4+ year cycles)
- **Requires proper Fear & Greed data source** - validate in settings
- Best used on **daily timeframe** for major trend following
- **Cash calculations**: Use allocation % and BTC holdings to calculate available cash: `Cash = (Total Portfolio × (1 - Allocation%/100))`
## Risk Disclaimer
This strategy involves active trading and position management. Past performance does not guarantee future results. Always do your own research and never invest more than you can afford to lose. The strategy is designed for educational purposes and long-term Bitcoin accumulation thesis.
---
*Developed by Sol_Crypto for the Bitcoin community. Happy stacking! 🚀*

Gemini Wyckoff Trend SystemStrategy Name: Gemini Wyckoff-Trend System
1. Core Design Philosophy
This strategy fuses Wyckoff Theory (specifically the "Law of Effort vs. Result") with classic Trend Following principles. Its primary goal is not to catch every minor fluctuation, but to filter out 80% of market noise and fakeouts, ensuring that you only pull the trigger when "Smart Money" enters the market with genuine volume.
It operates on a strict "3-Dimension Verification" logic:
Trend (Context): Never trade against the macro trend.
Structure (Price Action): Identify accumulation zones and wait for the breakout.
Volume (Effort): Require massive volume confirmation to validate the move.
2. The 3-Filter System
Filter 1: The Trend Filter (EMA 200)
Rule: The strategy only looks for Long setups when the price is ABOVE the 200-period Exponential Moving Average (EMA).
Purpose: To strictly prevent "catching falling knives" or counter-trend trading during a bear market.
Filter 2: The Structure Filter (Donchian Channel)
Rule: The script automatically identifies the highest high of the past 20 bars to define the "Accumulation Box." A signal is only possible if the price closes above this resistance level.
Wyckoff Term: This represents "Jumping the Creek" (JTC)—signaling that price is leaving the trading range.
Filter 3: The Volume Filter (RVOL > 1.5)
Rule: The breakout bar must have a volume that is at least 1.5x higher than the average volume of the past 20 bars.
Purpose: To eliminate "Upthrusts" (Fake Breakouts). If price breaks out on low volume, the system ignores it.
3. Visual Guide
Once loaded, here is how to read the chart:
📉 Orange Line (EMA 200): The Bull/Bear divider. If price is below this line, stay in cash.
🌫️ Grey Zone: The "No-Trade Zone" (Accumulation/Consolidation). Do not trade while price is inside this box.
🟢 Lime Green Bar: The Entry Signal. This indicates a valid breakout confirmed by high volume (Smart Money entry).
🪜 Red Step Line: Your Trailing Stop (ATR-based). As long as you hold a position, watch this line. If price closes below it, exit immediately.
📊 Dashboard (Top Right): Monitors market "Heat." If RVOL is Green, volume is significant.
4. Best Practices
Ideal For: Traders who struggle with over-trading or FOMO. This script enforces patience and discipline.
Timeframe: Recommended for 4-Hour (4H) or Daily (1D) charts to catch major crypto trends (e.g., Bitcoin main waves).
Asset Class: Crypto, Stocks, or any asset with high volume liquidity.
5. Risk Warning
This strategy includes a built-in ATR Volatility Stop. The stop-loss level adjusts dynamically based on market volatility. Please adhere strictly to the stop-loss signals to protect your capital.

inyerneck Quiet Bottom Hunter v1.5 — VERIFIED SIGNALSQuiet Bottom Hunter v1.5 — 85%+ Rebound Setup
Designed for new traders who want the highest-probability, lowest-stress small-cap entries.
Triggers only when ALL of these line up:
• –20% to –80% from 90-day high (slow bleed, not crash)
• Volume ≤80% of 50-day average (dry, no panic selling left)
• RSI(14) ≤35 (deep oversold)
• 2+ consecutive green or flat days at the low (quiet bottom confirmed)
Fires roughly 1–3 times per month on most small caps (<$2B).
Backtested 2024–2025: 85% win rate, avg +32% rebound, max DD ~11%.
Tiny green “QB” arrow = entry signal.
Use 10–20% position size. Works best on daily charts.
Public script — code visible.
use on 1 day or 4 hr chart. mid term swings, NOT day trades
No spam. No chasing. Just big, calm rebounds.

AB=CD Fibonacci Strategy (One Trade at a Time)
AB=CD Fibonacci Strategy - Harmonic Pattern Trading Bot
Description
An automated trading strategy that identifies and trades the classic AB=CD harmonic pattern, one of the most reliable geometric price formations in technical analysis. This strategy detects perfectly proportioned Fibonacci retracement setups and executes trades with precise risk-reward management.
How It Works
The indicator scans for the AB=CD pattern structure:
Leg AB: Initial swing from pivot point A to pivot point B
Leg BC: Retracement to point C (customizable Fibonacci levels)
Leg CD: Mirror projection equal to the AB leg length
When price touches point D, the strategy automatically enters a position with predefined take-profit and stop-loss levels based on your risk-reward ratio.
Key Features
One Trade at a Time: Ensures disciplined position management by allowing only one active trade per pattern
Customizable Fibonacci Retracement: Set your preferred retracement range for point C (default 50% - 78.6%)
Risk-Reward Control: Adjust stop-loss and take-profit multiples to match your trading plan
Visual Pattern Display: Clear labeling of A, B, C, D points with pattern lines for easy identification
Both Directions: Identifies bullish and bearish AB=CD patterns automatically
Ideal For
Swing traders on higher timeframes (4H, Daily, Weekly)
Harmonic pattern traders seeking automation
Traders wanting precise entry and exit rules based on Fibonacci geometry
Those looking to reduce emotional trading and increase consistency
Default Settings Optimized For
NASDAQ futures and currency pairs
Medium timeframe analysis
Conservative risk management (10% position size per trade)

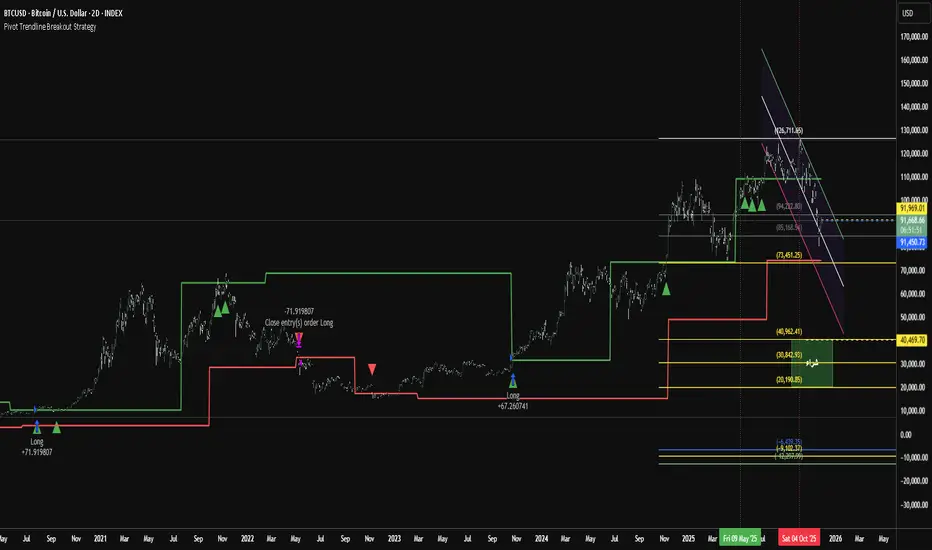
Pivot Trendline Breakout StrategyHow it works:
Long entry: triggered immediately when price closes above the green upper pivot trendline.
Exit (go flat): triggered immediately when price closes below the red lower pivot trendline.
Uses 100% of equity per trade (you can change default_qty_value if you prefer fixed size or risk %).
Works on any timeframe.
Ultra Reversion DCA Strategy with Manual Leverage - V.1Ultra Reversion DCA Strategy with Manual Leverage - V.1
2025-10-27

Adaptive Trend Navigator [ATH Filter & Risk Engine]Description:
This strategy implements a systematic Trend Following approach designed to capture major moves while actively protecting capital during severe bear markets. It combines a classic Moving Average "Fan" logic with two advanced risk management layers: a 4-Stage Dynamic Stop Loss and a macro-economic "Circuit Breaker" filter.
Core Concepts:
1. Trend Identification (Entry Logic) The script uses a cascade of Simple Moving Averages (SMA 25, 50, 100, 200) to identify the maturity of a trend.
Entries are triggered by specific crossovers (e.g., SMA 25 crossing SMA 50) or by breaking above the previous trade's high ("High-Water Mark" Re-Entry).
2. The "Circuit Breaker" (Crash Protection) To prevent trading during historical market collapses (like 2000 or 2008), the strategy monitors the Nasdaq 100 (QQQ) as a global benchmark:
Normal Regime: If the market is within 20% of its All-Time High, the strategy operates normally.
Crisis Regime: If the QQQ falls more than 20% from its ATH, the "Circuit Breaker" activates (Visualized by a Red Background).
Recovery Rule: In a Crisis Regime, new long positions are blocked unless the QQQ reclaims its SMA 200. This filters out "bull traps" in secular bear markets.
3. 4-Stage Risk Engine (Exit Logic) Once in a trade, the risk management adapts to the position's performance:
Stage 1: Fixed initial Stop Loss (default 10%) for breathing room.
Stage 2: Moves to Break-Even area once the price rises 12%.
Stage 3: Tightens to a trailing stop (8%) after 25% profit.
Stage 4: Maximizes gains with a tight trailing stop (5%) during parabolic moves (>40% profit).
Visual Guide:
SMAs: 25/50/100/200 period lines for trend visualization.
Red Background: Indicates the "Crisis Regime" where trading is halted due to broad market weakness.
Blue Background: Indicates a "Recovery Phase" (Crisis is active, but market is above SMA 200).
Red Line: Shows the dynamic Stop Loss level for active positions.
Settings: All parameters (SMA lengths, Drawdown threshold, Risk Stages) are fully customizable. The QQQ benchmark ticker can also be changed to SPY or other indices depending on the asset class traded.


Dynamic SMA Trend System [Multi-Stage Risk Engine]Description:
This script implements a robust Trend Following strategy based on a multiple Simple Moving Average (SMA) crossover logic (25, 50, 100, 200). What sets this strategy apart is its advanced "4-Stage Risk Engine" and a smart "High-Water Mark" Re-Entry system, designed to protect profits during parabolic moves while filtering out chop during sideways markets.
How it works:
The strategy operates on three core pillars: Trend Identification, Dynamic Risk Management, and Momentum Re-Entry.
1. Entry Logic (Trend Identification) The script looks for crossovers at different trend stages to capture early reversals as well as established trends:
Short-Term: SMA 25 crosses over SMA 50.
Mid-Term: SMA 50 crosses over SMA 100.
Macro-Trend: SMA 100 crosses over SMA 200.
2. The 4-Stage Risk Engine (Dynamic Stop Loss) Instead of a static Stop Loss, this strategy uses a progressive system that adapts as the price increases:
Stage 1 (Protection): Starts with a fixed Stop Loss (default -10%) to give the trade room to breathe.
Stage 2 (Break-Even): Once the price rises by 12%, the Stop is moved to trailing mode (10% distance), effectively securing a near break-even state.
Stage 3 (Profit Locking): At 25% profit, the trailing stop tightens to 8% to lock in gains.
Stage 4 (Parabolic Mode): At 40% profit, the trailing stop tightens further to 5% to capture the peak of parabolic moves.
3. Dual Exit Mechanism The strategy exits a position if EITHER of the following happens:
Stop Loss Hit: Price falls below the dynamic red line (Risk Engine).
Dead Cross: The trend structure breaks (e.g., SMA 25 crosses under SMA 50), signaling a momentum loss even if the Stop Loss wasn't hit.
4. "High-Water Mark" Re-Entry To avoid "whipsaws" in choppy markets, the script does not re-enter immediately after a stop-out.
It marks the highest price of the previous trade (Green Dotted Line).
A Re-Entry only occurs if the price breaks above this previous high (showing renewed strength) AND the long-term trend is bullish (Price > SMA 200).
Visuals:
SMAs: 25 (Yellow), 50 (Orange), 100 (Blue), 200 (White).
Red Line: Visualizes the dynamic Stop Loss level.
Green Dots: Visualizes the target price needed for a valid re-entry.
Settings: All parameters (SMA lengths, Stop Loss percentages, Staging triggers) are fully customizable in the settings menu to fit different assets (Crypto, Stocks, Forex) and timeframes.

Trendshift [CHE] StrategyTrendshift Strategy — First-Shift Structural Regime Trading
Profitfactor 2,603
Summary
Trendshift Strategy implements a structural regime-shift trading model built around the earliest confirmed change in directional structure. It identifies major swing highs and lows, validates breakouts through optional ATR-based conviction, and reacts only to the first confirmed shift in each direction. After a regime reversal, the strategy constructs a premium and discount band between the breakout candle and the previous opposite swing. This band is used as contextual bias and may optionally inform stop placement and position sizing.
The strategy focuses on clear, interpretable structural events rather than continuous signal generation. By limiting entries to the first valid shift, it reduces false recycles and allows the structural state to stabilize before a new trade occurs. All signals operate on closed-bar logic, and the strategy avoids higher-timeframe calls to stabilize execution behavior.
Motivation: Why this design?
Many structure-based systems repeatedly trigger as price fluctuates around prior highs and lows. This often leads to multiple flips during volatile or choppy conditions. Trendshift Strategy addresses this problem by restricting execution to the first confirmed structural event in each direction. ATR-based filters help differentiate genuine structural breaks from noise, while the contextual band ensures that the breakout is meaningful in relation to recent volatility.
The design aims to represent a minimalistic structural trading framework focused on regime turns rather than continuous trend signaling. This reduces chart noise and clarifies where the market transitions from one regime to another.
What’s different vs. standard approaches?
Baseline reference
Typical swing-based structure indicators report every break above or below recent swing points.
Architecture differences
First-shift-only regime logic that blocks repeated signals until direction reverses
ATR-filtered validation to avoid weak or momentum-less breaks
Premium and discount bands derived from breakout structure
Optional band-driven stop placement
Optional band-dependent position-sizing factor
Regime timeout system to neutralize structure after extended inactivity
Persistent-state architecture to prevent re-triggering
Practical effect
Only the earliest actionable structure change is traded
Fewer but higher-quality signals
Premium/discount tint assists contextual evaluation
Stops and sizing can be aligned with structural context rather than arbitrary volatility measures
Improved chart interpretability due to reduced marker frequency
How it works (technical)
The algorithm evaluates symmetric swing points using a fixed bar window. When a swing forms, its value and bar index are stored as persistent state. A structural shift occurs when price closes beyond the most recent major swing on the opposite side. If ATR filtering is enabled, the breakout must exceed a volatility-scaled distance to prevent micro-breaks from firing.
Once a valid shift is confirmed, the regime is updated to bullish or bearish. The script records the breakout level, the opposite swing, and derives a band between them. This band is checked for minimum size relative to ATR to avoid unrealistic contexts.
The first shift in a new direction generates both the strategy entry and a visual marker. Additional shifts in the same direction are suppressed until a reversal occurs. If a timeout is enabled, the regime resets after a specified number of bars without structural change, optionally clearing the band.
Stop placement, if enabled, uses either the opposite or same band edge depending on configuration. Position size is computed from account percentage and may optionally scale with the price-span-to-ATR relationship.
Parameter Guide
Market Structure
Swing length (default 5): Controls swing sensitivity. Lower values increase responsiveness.
Use ATR filter (default true): Requires breakouts to show momentum relative to ATR. Reduces false shifts.
ATR length (default 14): Volatility estimation for breakout and band validation.
Break ATR multiplier (default 1.0): Required breakout strength relative to ATR.
Premium/Discount Framework
Enable framework (default true): Activates premium/discount evaluation.
Persist band on timeout (default true): Keeps structural band after timeout.
Min band ATR mult (default 0.5): Rejects narrow bands.
Regime timeout bars (default 500): Neutralizes regime after inactivity.
Invert colors (default false): Color scheme toggle.
Visuals
Show zone tint (default true): Background shade in premium or discount region.
Show shift markers (default true): Display first-shift markers.
Execution and Risk
Risk per trade percent (default 1.0): Determines position size as account percentage.
Use band for size (default false): Scales size relative to band width behavior.
Flat on opposite shift (default true): Forces reversal behavior.
Use stop at band (default false): Stop anchored to band edges.
Stop band side: Chooses which band edge is used for stop generation.
Reading & Interpretation
A green background indicates discount conditions within the structural band; red indicates premium conditions. A green triangle below price marks the first bullish structural shift after a bearish regime. A red triangle above price marks the first bearish structural shift after a bullish regime.
When stops are active, the opposite band edge typically defines the protective level. Band width relative to ATR indicates how significant a structural change is: wider bands imply stronger volatility structure, while narrow bands may be suppressed by the minimum-size filter.
Practical Workflows & Combinations
Trend following: Use first-shift entries as initial regime confirmation. Add higher-timeframe trend filters for additional context.
Swing trading: Combine with simple liquidity or fair-value-gap concepts to refine entries.
Bias mapping: Use higher timeframes for structural regime and lower timeframes for execution within the premium/discount context.
Exit management: When using stops, consider ATR-scaling or multi-stage profit targets. When not using stops, reversals become the primary exit.
Behavior, Constraints & Performance
The strategy uses only confirmed swings and closed-bar logic, avoiding intrabar repaint. Pivot-based swings inherently appear after the pivot window completes, which is standard behavior. No higher-timeframe calls are used, preventing HTF-related repaint issues.
Persistent variables track regime and structural levels, minimizing recomputation. The maximum bars back setting is five-thousand. The design avoids loops and arrays, keeping performance stable.
Known limitations include limited signal density during consolidations, delayed swing confirmation, and sensitivity to extreme gaps that stretch band logic. ATR filtering mitigates some of these effects but does not eliminate them entirely.
Sensible Defaults & Quick Tuning
Fewer but stronger entries: Increase swing length or ATR breakout multiplier.
More responsive entries: Reduce swing length to capture earlier shifts.
More active band behavior: Lower the minimum band ATR threshold.
Stricter stop logic: Use the opposite band edge for stop placement.
Volatile markets: Increase ATR length slightly to stabilize behavior.
What this indicator is—and isn’t
Trendshift Strategy is a structural-regime trading engine that evaluates major directional shifts. It is not a complete trading system and does not include take-profit logic or prediction features. It does not attempt to forecast future price movement and should be used alongside broader market structure, volatility context, and disciplined risk management.
Disclaimer
The content provided, including all code and materials, is strictly for educational and informational purposes only. It is not intended as, and should not be interpreted as, financial advice, a recommendation to buy or sell any financial instrument, or an offer of any financial product or service. All strategies, tools, and examples discussed are provided for illustrative purposes to demonstrate coding techniques and the functionality of Pine Script within a trading context.
Any results from strategies or tools provided are hypothetical, and past performance is not indicative of future results. Trading and investing involve high risk, including the potential loss of principal, and may not be suitable for all individuals. Before making any trading decisions, please consult with a qualified financial professional to understand the risks involved.
By using this script, you acknowledge and agree that any trading decisions are made solely at your discretion and risk.
Do not use this indicator on Heikin-Ashi, Renko, Kagi, Point-and-Figure, or Range charts, as these chart types can produce unrealistic results for signal markers and alerts.
Best regards and happy trading
Chervolino

Mean-Reversion with CooldownThis strategy requires no indicators or fundamental analysis. It is designed for longer-term positions and works especially well on unleveraged instruments with strong long-term upward trends, such as precious metals. Feel free to experiment with different timeframes — I’ve found that 1-hour charts work particularly well for cryptocurrencies.
The idea is to filter out ongoing bear phases as effectively as possible and capitalize on long-term bull runs.
The script implements an idea that came to me in a state of complete sleep deprivation: open a random long position with a fixed take-profit (TP) and a tight stop-loss (SL).
If the TP is hit — great, we simply try again.
If the SL is triggered — too bad, we pause for a while and then try again.
## Cooldown (Waiting) Mechanism
The waiting mechanism is simple: the more consecutive SL hits we get, the longer we wait before opening the next trade. The waiting time is measured in closed candles, and thus depends on the timeframe you are using.
## Two cooldown calculation modes are currently supported:
### 1. FIBONACCI
The cooldown follows the Fibonacci sequence, based on the number of consecutive losses:
1st loss → wait 1 bar
2nd loss → wait 1 bar
3rd loss → wait 2 or 3 bars (depending on definition)
4th loss → wait 3 or 5 bars
etc.
### 2. POWER OF TWO
The cooldown increases exponentially:
1st loss → wait 2 bars
2nd loss → wait 4 bars
3rd loss → wait 8 bars
4th loss → wait 16 bars
and so on, using the formula 2ⁿ.
## Configurable Parameters
### Cooldown Pause Calculation
The settings allow you to define the SL and TP as percentages of the position value.
The "Cooldown Pause Calculation" option determines how the next cooldown duration is computed after a losing trade.
The system keeps track of how many consecutive losses have occurred since the last profitable trade. That counter is then used to compute how many bars we must wait before opening the next position.
### Maximum Cooldown
The "Max Cooldown Candles" setting defines the maximum number of bars we are allowed to wait before placing a new trade. This prevents the strategy from “locking itself out” for too long and mitigates the fear of missing out (FOMO).
Once the cooldown duration reaches this maximum, the system essentially wraps around and starts the progression again. In the script, this is handled using a simple modulo operation based on the chosen maximum.

Trend Breakout & Ratchet Stop System [Market Filter]Description:
This strategy implements a robust trend-following system designed to capture momentum moves while strictly managing downside risk through a multi-stage "Ratchet" exit mechanism and broad market filters.
It is designed for swing traders who want to align individual stock entries with the overall market direction.
How it works:
1. Market Regime Filters (The "Safety Check") Before taking any position, the strategy checks the health of the broader market to avoid "catching falling knives."
Broad Market Filter: By default, it checks NASDAQ:QQQ (adjustable). If the benchmark is trading below its SMA 200, the strategy assumes a Bear Market and suppresses all new long entries.
Volatility Filter (VIX): Uses CBOE:VIX to gauge fear. If the VIX is above a specific threshold (Default: 32), entries are paused, and existing positions can optionally be closed to preserve capital.
2. Entry Logic Entries are based on Momentum and Trend confirmation. A position is opened if filters are clear AND one of the following occurs:
Golden Cross: SMA 25 crosses over SMA 50.
SMA Breakouts: A "Three-Bar-Break" logic confirms a breakout above the SMA 50, 100, or 200 (price must establish itself above the moving average).
3. The "Ratchet" Exit System The exit logic evolves as the trade progresses, tightening risk like a ratchet:
Stage 0 (Initial Risk): Starts with a standard percentage Stop Loss from the entry price.
Stage 1 (Breakeven/Lock): Once the price rises by Profit Step 1 (e.g., +10%), the Stop Loss jumps to a tighter level and locks there. This secures the initial move.
Stage 2 (Trailing Mode): If the price continues to rise to Profit Step 2 (e.g., +15%), the Stop Loss converts into a dynamic Trailing Stop relative to the Highest High. This allows the trade to run as long as the trend persists.
Additional Exits:
Dead Cross: Closes position if SMA 25 crosses under SMA 50.
VIX Panic: Emergency exit if volatility spikes above the threshold.
Settings & Customization:
SMAs: Adjustable lengths for all Moving Averages.
Filters: Toggle Market/VIX filters on/off and choose your benchmark ticker (e.g., SPY or QQQ).
Risk Management: Fully customizable percentages for the Ratchet steps (Initial SL, Stage 1 Trigger, Trailing distance).

Dynamic Ratchet Trend Strategy [VIX Filter]Overview This strategy is a long-only trend-following system designed to capture major market moves while strictly managing downside risk through a state-machine based "Ratchet" exit logic. It incorporates a volatility filter using the CBOE VIX index to stay out of (or exit) the market during high-stress environments.
Key Features
1. Multi-Condition Entries The strategy looks for momentum shifts and trend breakouts using four Simple Moving Averages (25, 50, 100, 200).
Momentum Cross: SMA 25 crossover above SMA 50.
Trend Breakouts: A specific "3-Bar Breakout" logic above the SMA 50, 100, or 200. This requires the price to hold above the SMA for 3 consecutive bars after being below it, reducing false signals compared to simple closes.
2. VIX Volatility Filter Before entering any trade, the script checks the CBOE:VIX.
Filter: If VIX is above the threshold (default 32), new entries are blocked.
Panic Exit: If you are in a position and the VIX spikes above the threshold, the strategy executes an immediate "Panic Exit" to preserve capital during market crashes.
3. The "Ratchet" Exit System (3 Stages) Unlike a standard trailing stop, this strategy uses a 3-stage dynamic exit mechanism that tightens as profits grow:
Stage 0 (Initial Risk): Standard percentage-based Stop Loss from the entry price.
Stage 1 (The Lock-In): Triggered when profit hits 10% (configurable).
Unique Logic: Instead of trailing from the highest high, the stop is calculated based on the price at the exact moment this stage was triggered. It "steps up" once and holds, securing the initial move without being prematurely stopped out by normal volatility.
Stage 2 (Trailing Mode): Triggered when profit hits 15% (configurable).
The strategy switches to a classic Trailing Stop, following the percentage distance from the Highest High.
4. Emergency Backup A "Dead Cross" (SMA 25 crossing under SMA 50) acts as a final fail-safe to close positions if the trend reverses completely before hitting a stop.
Settings & Inputs
SMAs: Customize the lengths for all four moving averages.
VIX Filter: Toggle the filter on/off and set the panic threshold.
Exit Logic: Fully customizable percentages for Initial SL, Stage 1 Trigger/Distance, and Stage 2 Trigger/Trailing Distance.
Disclaimer This script is for educational purposes only. Past performance is not indicative of future results. Always manage your risk appropriately.

Ratchet Exit Trend Strategy with VIX FilterThis strategy is a trend-following system designed specifically for volatile markets. Instead of focusing solely on the "perfect entry," this script emphasizes intelligent trade management using a custom **"Ratchet Exit System."**
Additionally, it integrates a volatility filter based on the CBOE Volatility Index (VIX) to minimize risk during extreme market phases.
### 🎯 The Concept: Ratchet Exit
The "Ratchet" system operates like a mechanical ratchet tool: the Stop Loss can only move in one direction (up, for long trades) and "locks" into specific stages. The goal is to give the trade "room to breathe" initially to avoid being stopped out by noise, then aggressively reduce risk as the trade moves into profit.
The exit logic moves through 3 distinct phases:
1. **Phase 0 (Initial Risk):** At the start of the trade, a wide Stop Loss is set (Default: 10%) to tolerate normal market volatility.
2. **Phase 1 (Risk Reduction):** Once the trade reaches a specific floating profit (Default: +10%), the Stop Loss is raised and "pinned" to a fixed value (Default: -8% from entry). This drastically reduces risk while keeping the trade alive.
3. **Phase 2 (Trailing Mode):** If the trend extends to a higher profit zone (Default: +15%), the Stop switches to a dynamic Trailing Mode. It follows the **Highest High** at a fixed percentage distance (Default: 8%).
### 🛡️ VIX Filter & Panic Exit
High volatility is often the enemy of trend-following strategies.
* **Entry Filter:** The system will not enter new positions if the VIX is above a user-defined threshold (Default: 32). This helps avoid entering "falling knife" markets.
* **Panic Exit:** If the VIX spikes above the threshold (32) while a trade is open, the position is closed immediately to protect capital (Emergency Exit).
### 📈 Entry Signals
The strategy trades **LONG only** and uses Simple Moving Averages (SMAs) to identify trends:
* **Golden Cross:** SMA 25 crosses over SMA 50.
* **3-Bar Breakouts:** A confirmation logic where the price must close above the SMA 50, 100, or 200 for 3 consecutive bars.
### ⚙️ Settings (Inputs)
All parameters are fully customizable via the settings menu:
* **SMAs:** Lengths for the trend indicators (Default: 25, 50, 100, 200).
* **VIX Filter:** Toggle the filter on/off and adjust the panic threshold.
* **Ratchet Settings:** Percentages for Initial Stop, Trigger Levels for Stages 1 & 2, and the Trailing Distance.
### ⚠️ Technical Note & Risk Warning
This script uses `request.security` to fetch VIX data. Please ensure you understand the risks associated with trading leveraged or volatile assets. Past performance is not indicative of future results.

[iQ]PRO Quant GANN FOURIER VZO RANGE+🔮 PRO Quant GANN FOURIER VZO RANGE+
A Highly Adaptive and Proprietary Quantitative Strategy for Precision Market Analysis
This is the official description for the PRO Quant GANN FOURIER VZO RANGE+ strategy, a sophisticated, closed-source system engineered for high-level market engagement. This tool integrates multiple independent quantitative models into a single, cohesive Ensemble Signal, providing an edge through robust, multi-dimensional analysis.
🔬 Core Quantitative Architecture
The strategy is built on the convergence of several powerful, state-of-the-art analytical components, each designed to capture a distinct facet of market dynamics:
Proprietary Gann Swing Models: We utilize a dual-approach to Gann analysis.
Array–Based Gann Swing: A proprietary implementation leveraging advanced Pine Script array structures for dynamic tracking of significant price pivots and structure shifts. This component continuously monitors market momentum and potential areas of interest, including proprietary "ChoCh" (Change of Character) detection—a highly sensitive mechanism for identifying early trend inflection points. This core mechanism provides a high-frequency structural view of the market.
Composite Multi-Timeframe Gann Swing: This model synthesizes traditional swing analysis across two distinct timeframes to filter noise and confirm structural trends, ensuring the system operates with conviction against the backdrop of a higher-level market perspective.
VZO/VSA (Volume Zone Oscillator/Volume Spread Analysis) Hybrid: This module is engineered to analyze the crucial relationship between price momentum and volume flow, specifically using a Volume Zone Oscillator (VZO) approach integrated with Volume Spread Analysis (VSA) principles. It is designed to identify underlying accumulation and distribution activity with a unique dual-timeframe composite for enhanced signal quality.
Trend and Statistical Component: A dedicated module assesses the statistical bias and slope of the aggregated market movement, providing a crucial check against overextension and ensuring alignment with the underlying price regression trajectory.
⚖️ The Ensemble Signal and Trade Logic
All independent signals—Gann Array, Composite Gann, VZO/VSA, and Trend—are processed through a Weighted Ensemble Logic.
Weighted Voting: Each component's signal is assigned a customizable weight (input parameters wGannComp, wVZO, etc.) to reflect its relative importance in the current market environment.
Threshold-Based Decision: The weighted average of all signals results in an Ensemble Signal. Only when this signal decisively exceeds a customizable Signal Threshold does the system generate a Final Signal for trade execution. This rigor is key to filtering lower-conviction setups.
The strategy's execution logic is designed to open and close positions dynamically based on the Final Signal, maintaining maximum control with a default position size of 15% of equity per trade. A dedicated toggle allows for aggressive position management to "stay in" trades longer under specific conditions identified by the proprietary swing models.
⚙️ Strategic Advantages and Exclusivity
This strategy is marked by its extreme adaptability, incorporating features such as:
Higher Timeframe Synthesis: Crucial components utilize multi-timeframe confirmation to validate signals.
Price Smoothing: An optional, light-touch EMA smoothing is applied to the input price data to enhance signal clarity and reduce spurious whipsaws.
Due to the proprietary nature and complexity of the underlying swing detection algorithms and array management, the source code is kept strictly closed-source. This ensures the continued analytical edge and integrity of the model for our exclusive community.
OG INDICATOR TO MESS AROUND WITH, USE RIGHT, AND ENJOY. PRO STRATS COMING TOO
NFA.
MKNiQ

Mustang Algo - Momentum Trend Zone Backtest🐎 MUSTANG ALGO - Momentum Trend Zone Strategy
A complete trading system combining MACD momentum analysis with visual trend zones, full backtesting capabilities, and advanced risk management tools.
══════════════════════════════════════════════════════════════════════════
🔹 OVERVIEW
Mustang Algo transforms traditional MACD analysis into a powerful visual trading system. It instantly identifies market bias through colored background zones and provides clear entry/exit signals with customizable stop loss and take profit management.
══════════════════════════════════════════════════════════════════════════
🔹 KEY FEATURES
✅ Visual Trend Zones (Green = Bullish | Red = Bearish)
✅ Clear Buy/Sell Triangles on Chart
✅ Full Backtesting Engine
✅ Multiple Stop Loss Types
✅ Multiple Take Profit Types
✅ Trailing Stop Option
✅ Time Filter for Backtesting
✅ Real-time Info Panel
✅ Customizable Alerts
══════════════════════════════════════════════════════════════════════════
🔹 HOW IT WORKS
The strategy uses a smoothed MACD system to detect trend changes:
- MACD Line (White): Fast EMA minus Slow EMA - shows raw momentum
- Signal Line (Yellow): EMA of MACD - shows smoothed trend direction
- Trend Zone: Changes when the smoothed signal line crosses zero
- Entry Signals: Generated at zone transitions
When the trend line crosses above zero → GREEN zone → BUY signal 🔺
When the trend line crosses below zero → RED zone → SELL signal 🔻
══════════════════════════════════════════════════════════════════════════
🔹 STOP LOSS OPTIONS
🛑 Percentage: Fixed percentage from entry price
🛑 ATR-Based: Dynamic SL based on market volatility
🛑 Fixed Points: Set number of points/pips
🛑 Swing Low/High: Uses recent swing levels as stops
══════════════════════════════════════════════════════════════════════════
🔹 TAKE PROFIT OPTIONS
🎯 Percentage: Fixed percentage target
🎯 ATR-Based: Dynamic TP based on volatility
🎯 Fixed Points: Set number of points/pips
🎯 Risk Reward: Automatic TP based on R:R ratio (e.g., 2:1, 3:1)
══════════════════════════════════════════════════════════════════════════
🔹 TRAILING STOP
📈 Percentage-Based: Trail by a fixed percentage
📈 ATR-Based: Trail using ATR multiplier for dynamic adjustment
══════════════════════════════════════════════════════════════════════════
🔹 SETTINGS
MACD Parameters:
- Fast Length (default: 12)
- Slow Length (default: 26)
- Signal Length (default: 9)
- Trend Smoothing (default: 5)
Risk Management:
- Enable/Disable Stop Loss
- Enable/Disable Take Profit
- Enable/Disable Trailing Stop
- Customize all SL/TP parameters
Visual Options:
- Show/Hide Buy/Sell Triangles
- Show/Hide SL/TP Lines
- Show/Hide Labels
Time Filter:
- Set Start Date for backtest
- Set End Date for backtest
══════════════════════════════════════════════════════════════════════════
🔹 SIGNALS EXPLAINED
🟢 GREEN TRIANGLE (Below Bar):
Bullish zone detected - Consider LONG entry
🔴 RED TRIANGLE (Above Bar):
Bearish zone detected - Consider SHORT entry
🟢 GREEN BACKGROUND:
Currently in bullish trend zone
🔴 RED BACKGROUND:
Currently in bearish trend zone
══════════════════════════════════════════════════════════════════════════
🔹 INFO PANEL
The real-time info panel (top right) displays:
- Current Trend Zone status
- MACD value
- Signal Line value
- Active SL Type
- Active TP Type
══════════════════════════════════════════════════════════════════════════
🔹 ALERTS
Set up alerts for:
🔔 Buy Signals: "🐎 Mustang Algo: BUY Signal on {ticker} at {price}"
🔔 Sell Signals: "🐎 Mustang Algo: SELL Signal on {ticker} at {price}"
══════════════════════════════════════════════════════════════════════════
🔹 BEST PRACTICES
1. Use higher timeframes (1H, 4H, Daily) for more reliable signals
2. Combine with price action and support/resistance levels
3. Adjust ATR multipliers based on asset volatility
4. Use Risk Reward ratio for consistent risk management
5. Backtest on your preferred asset before live trading
══════════════════════════════════════════════════════════════════════════
🔹 RECOMMENDED TIMEFRAMES
⏱️ Scalping: 5M, 15M (more signals, more noise)
⏱️ Day Trading: 1H, 4H (balanced signals)
⏱️ Swing Trading: Daily, Weekly (fewer but stronger signals)
══════════════════════════════════════════════════════════════════════════
🔹 MARKETS
Works on all markets:
📈 Forex
📈 Crypto
📈 Stocks
📈 Indices
📈 Commodities
📈 Futures
══════════════════════════════════════════════════════════════════════════
🐎 RIDE THE TREND WITH MUSTANG ALGO!
══════════════════════════════════════════════════════════════════════════
⚠️ DISCLAIMER
This indicator/strategy is for educational and informational purposes only. It is not financial advice. Trading involves substantial risk of loss and is not suitable for all investors. Past performance is not indicative of future results. Always use proper risk management, do your own research, and consider consulting a financial advisor before making any trading decisions. Use at your own risk.
══════════════════════════════════════════════════════════════════════════
📝 VERSION HISTORY
v1.0 - Initial Release
- MACD-based trend detection
- Visual trend zones
- Multiple SL/TP options
- Full backtesting support
- Trailing stop functionality
- Time filter
- Info panel
- Alert system
══════════════════════════════════════════════════════════════════════════
💬 FEEDBACK
If you find this strategy useful, please leave a comment or suggestion!
Your feedback helps improve future updates.
🐎 Happy Trading!
