Trendchange Zones Indicator | iSolani
Spotting Reversals Before They Happen: The iSolani Trendshift System
Where RSI Meets Smart Volume Analysis - Your Visual Guide to Market Turns
Core Methodology
RSI-Powered Zones
Identifies critical levels using:
14-period RSI (default) with 70/30 thresholds
Semi-transparent boxes marking overbought (red) and oversold (green) territories
Zone persistence until RSI returns to neutral range
Dynamic Level Tracking
Plots evolving support/resistance using:
Pivot highs/lows with 15-bar lookback (default)
Auto-extending lines that adapt to new price extremes
Volume-Confirmed Breakouts
Flags significant moves with:
5/10 EMA volume oscillator
20% volume threshold (default) for confirmation
Technical Innovation
Three-Layer Confirmation
Unique combination of:
Classic RSI extremes
Price structure through pivot points
Volume-fueled momentum shifts
Adaptive Visualization
Zones maintain historical context at 33% transparency
Dynamic lines extend indefinitely until invalidated
Discreet labels for breakout events
System Workflow
Calculates RSI values in real-time
Draws colored zones when RSI crosses 70/30
Marks pivot points every 15 bars (default)
Updates support/resistance lines on new pivots
Triggers alerts when price breaks levels with volume confirmation
Standard Configuration
RSI Settings : 14-period length
Pivot Detection : 15-bar left/right lookback
Visuals : 33% transparency zones with thin borders
Volume Threshold : 20% oscillator difference
Alerts : Breakout signals with "B" labels
This system transforms the classic RSI into a spatial analysis tool - not just showing when markets are overextended, but where they're likely to reverse. The dynamic lines act as moving barriers that adapt to market structure, while the volume filter ensures only high-conviction breaks get flagged. By layering momentum, price action, and volume dynamics, it creates a multi-spectrum view of potential trend changes.
D-ATR

Smart Buy/Sell Signal IndicatorOverview
The Smart Buy/Sell Signal Indicator is a multi-factor trading tool that i ntegrates Supertrend, Bollinger Bands, RSI, ADX, and Moving Averages to generate high-probability buy and sell signals. Unlike simple crossover-based strategies, this indicator leverages multiple layers of confirmation to reduce false signals and improve trade execution accuracy.
This indicator is designed for trend-following traders, scalpers, and swing traders, helping them identify key reversal points and momentum shifts with precise breakout conditions.
How It Works
The Smart Buy/Sell Signal Indicator filters out weak trade signals by combining trend, volatility, momentum, and strength indicators in the following manner:
✅ Supertrend-Based Trend Filtering:
• The script checks if the price is above or below the Supertrend level before confirming a buy or sell signal.
• Buy signals occur below the Supertrend Down level, confirming support.
• Sell signals occur above the Supertrend Up level, confirming resistance.
✅ Bollinger Bands for Overbought & Oversold Conditions:
• Buy signals are confirmed when price touches the Bollinger Lower Band (suggesting oversold conditions).
• Sell signals are confirmed when price touches the Bollinger Upper Band (suggesting overbought conditions).
• This ensures that trades occur at high-probability reversal zones, rather than random price action.
✅ RSI Momentum Confirmation:
• Buy trades trigger when RSI is below 50 (indicating strength building from an oversold region).
• Sell trades trigger when RSI is above 50 (indicating weakness forming in an overbought region).
• This ensures signals are momentum-backed and not counter-trend moves.
✅ ADX Strength Confirmation:
• The script filters signals using the ADX (Average Directional Index) to ensure that only trades with sufficient market strength are executed.
• If the ADX value is below a threshold (default: 15), the signal is ignored to prevent false breakouts in choppy markets.
✅ Confirmation Moving Average (MA) for Trend Validation:
• The script applies an additional confirmation filter using a Moving Average (SMA/EMA).
• Buy signals trigger only when the price is above the MA, aligning with trend direction.
• Sell signals trigger only when the price is below the MA, ensuring alignment with the broader market structure.
✅ Trade Cooldown Mechanism (Minimum Bars Between Signals):
• To avoid frequent signals in sideways markets, a cooldown period is implemented.
• Default: 5 bars between signals (adjustable).
• Prevents rapid consecutive trades, reducing false entries.
Key Features
✔️ Supertrend & Moving Average Confirmation – Ensures trades are taken only in the correct trend direction.
✔️ Bollinger Bands Integration – Helps identify high-probability reversal zones.
✔️ ADX Strength Filtering – Ensures trades are only executed when the market has enough strength.
✔️ Momentum-Based RSI Filtering – Avoids counter-trend trades and confirms directional strength.
✔️ Trade Cooldown Mechanism – Reduces overtrading and noise in sideways markets.
✔️ Webhook Alerts for Automation – Auto-execute trades or receive real-time notifications.
✔️ Customizable Inputs – Adjustable thresholds, EMA/SMA length, ADX filter, cooldown period for flexibility.
✔️ Works Across Multiple Timeframes – Suitable for scalping (5m, 15m), swing trading (1H, 4H), and position trading (Daily).
How to Use
📌 Scalping & Intraday Trading:
• Use on 5m, 15m, or 30m timeframes.
• Look for Bollinger Band touch + RSI confirmation + Supertrend support/resistance validation before entering trades.
📌 Swing Trading:
• Use on 1H or 4H timeframes.
• Enter only when ADX is strong and price aligns with Supertrend direction.
📌 Webhook Automation:
• Set up TradingView Alerts to auto-execute trades via Webhook-compatible platforms.
Why This Combination?
This indicator is not just a simple moving average crossover tool.
It is designed to filter out weak breakouts and only execute trades that have:
✅ Trend confirmation (Supertrend + Moving Average)
✅ Volatility filtering (Bollinger Bands for overbought/oversold confirmation)
✅ Momentum validation (RSI threshold filtering)
✅ Market strength requirement (ADX ensures sufficient momentum)
This multi-layered approach ensures that only the highest-quality setups are executed, improving both win rate and reliability.
Why It’s Worth Using?
🚀 Reduces False Breakouts – Avoids weak breakouts by requiring ADX confirmation.
🚀 Works in All Market Conditions – Trend-following logic for trending markets, volatility-based entries for reversals.
🚀 Customizable to Any Trading Style – Adjustable parameters for trend, momentum, and strength filtering.
🚀 Seamless Webhook Automation – Execute trades automatically with TradingView alerts.
🚀 Ready to trade smarter?
✅ Add the Smart Buy/Sell Signal Indicator to your TradingView chart today! 🎯🔥

Daily True Range (DTR) vs Average True Range (ATR)Overview
The "DTR vs ATR with Color-Coded Percentage" indicator is a powerful volatility analysis tool designed for traders who want to understand daily price movements in the context of historical volatility. It calculates the Daily True Range (DTR)—the raw measure of a single day’s volatility—and compares it to the Average True Range (ATR), which smooths volatility over a user-defined period (default 14 days). The indicator presents this data in an intuitive table, featuring a color-coded percentage that visually represents how the current day’s move (DTR) stacks up against the average volatility (ATR). This helps traders quickly assess whether the current day’s price action is unusually volatile, average, or subdued relative to recent history.
Purpose
Volatility Comparison: Visualize how the current day’s price range (DTR) relates to the average range (ATR) over a specified period.
Decision Support: Identify days with exceptional movement (e.g., breakouts or reversals) versus normal or quiet days, aiding in trade entry/exit decisions.
Risk Management: Gauge daily volatility to adjust position sizing or stop-loss levels based on whether the market is exceeding or falling short of typical movement.
Features
Daily True Range (DTR) Calculation:
Computes the True Range for the current day as the greatest of:
Current day’s High - Low
High - Previous Close
Low - Previous Close
Aggregates data on any timeframe to ensure accurate daily values.
Average True Range (ATR):
Calculates the smoothed average of DTR over a customizable period (default 14 days) using Wilder’s smoothing method.
Updates in real-time as the day progresses.
Timeframe Flexibility: Works on any chart timeframe (e.g., 1-minute, 1-hour) while always calculating DTR and ATR based on daily data.
Color-Coded Display in either compact or table mode
The percentage value is color-coded in the table based on configurable thresholds:
Safe (default 75): Normal range, within typical volatility
Warning: (default 75-125): Above-average volatility.
Danger (default 125): Exceptionally high volatility

Multi-Timeframe ATR Levels by Hitesh2603Description:
"Multi-Timeframe ATR Levels by Hitesh2603" is a versatile and adaptive indicator designed to help traders identify key price levels based on the Average True Range (ATR) from a higher timeframe. The script automatically adapts to the current chart’s timeframe and allows you to customize the higher timeframe for ATR calculations, making it ideal for intraday and swing trading strategies.
The indicator plots upper and lower price levels based on the ATR multiplier, providing clear visual cues for potential profit-taking or exit points. It also includes features like editable timeframe presets , historical level plotting , labels , and alerts , making it a powerful tool for traders of all experience levels.
---
Key Features:
1. Automatic Timeframe Adaptation : - The script automatically detects the current chart’s timeframe and selects the appropriate higher timeframe for ATR calculations.
2. Editable Preset Timeframe Pairs : - Customize the higher timeframe for each chart timeframe directly in the indicator settings.
3. Dynamic ATR-Based Levels :- Plots upper and lower price levels using the formula:
- Upper Level = Current Candle Open + (Previous Candle ATR * Multiplier)
- Lower Level = Current Candle Open - (Previous Candle ATR * Multiplier)
4. Customizable Inputs :
- Adjust ATR length, multiplier, line length, colors, and more.
5. Labels :
- Displays the exact values of the upper and lower levels for easy reference.
6. Historical Levels :
- Optionally plots historical levels for all candles.
7. Alerts :
- Get notified when the price crosses the upper or lower levels.
---
Use Cases:
1. Intraday Trading :
- Use the script on a 5-minute or 15-minute chart with a 1-hour higher timeframe to identify intraday profit-taking or exit points.
2. Swing Trading :
- Use the script on a 1-hour or 4-hour chart with a daily higher timeframe to identify swing trading opportunities.
3. Position Trading :
- Use the script on a daily chart with a weekly higher timeframe to identify key levels for position trading.
4. Breakout Confirmation :
- Use the upper and lower levels as confirmation points for breakouts or reversals.
5. Risk Management :
- Use the levels to set stop-loss or take-profit targets based on market volatility.
---
How to Use:
1. Add the Script to Your Chart :
- Search for "Multi-Timeframe ATR Levels by Hitesh2603" in the TradingView indicator library and add it to your chart.
2. Customize the Settings :
- Adjust the inputs (e.g., ATR length, multiplier, line length, colors, etc.) to suit your trading strategy.
3. Set the Higher Timeframe :
- The script will automatically display an input for the higher timeframe based on the current chart’s timeframe. Customize it as needed.
4. Interpret the Levels :
- The script will plot two horizontal lines (upper and lower levels) on the chart. Use these levels for profit-taking, exits, or breakout confirmation.
5. Enable Alerts :
- Set up alerts to get notified when the price crosses the upper or lower levels.
---
Input Parameters:
1. ATR Length :
- The period used to calculate the ATR (default: 14).
2. ATR Multiplier :
- The multiplier applied to the ATR to calculate the levels (default: 0.65).
3. Line Length :
- The number of candles to extend the lines (default: 10).
4. Show Labels :
- Toggle to display the exact values of the levels (default: true).
5. Show Historical Levels :
- Toggle to plot historical levels for all candles (default: false).
6. Line Colors :
- Customize the colors of the upper and lower levels.
7. Line Width :
- Adjust the thickness of the lines (default: 2).
---
Example:
- Current Chart : 5-minute
- Higher Timeframe : 1-hour
- Previous Hour’s ATR : 4.6
- Current Hour’s Open : 102
- Multiplier : 0.65
Levels :
- Upper Level = 102 + (4.6 * 0.65) = 105.0
- Lower Level = 102 - (4.6 * 0.65) = 99.0
The script will plot horizontal lines at 105.0 and 99.0 on the 5-minute chart.
---
Alerts:
- Price Crosses Upper Level :
- Triggered when the price crosses above the upper level.
- Price Crosses Lower Level :
- Triggered when the price crosses below the lower level.
---
Notes:
- The script is designed to be flexible and adaptable to various trading styles and timeframes.
- Always backtest and validate the indicator with your trading strategy before using it in live trading.
---
Credits:
- Developed by Hitesh2603 .
- Special thanks to the TradingView community for inspiration and support.

Uptrick: Alpha TrendIntroduction
Uptrick: Alpha Trend is a comprehensive technical analysis indicator designed to provide traders with detailed insights into market trends, momentum, and risk metrics. It adapts to various trading styles—from quick scalps to longer-term positions—by dynamically adjusting its calculations and visual elements. By combining multiple smoothing techniques, advanced color schemes, and customizable data tables, the indicator offers a holistic view of market behavior.
Originality
The Alpha Trend indicator distinguishes itself by blending established technical concepts with innovative adaptations. It employs three different smoothing techniques tailored to specific trading modes (Scalp, Swing, and Position), and it dynamically adjusts its parameters to match the chosen mode. The indicator also offers a wide range of color palettes and multiple on-screen tables that display key metrics. This unique combination of features, along with its ability to adapt in real time, sets it apart as a versatile tool for both novice and experienced traders.
Features
1. Multi-Mode Trend Line
The indicator automatically selects a smoothing method based on the trading mode:
- Scalp Mode uses the Hull Moving Average (HMA) for rapid responsiveness.
- Swing Mode employs the Exponential Moving Average (EMA) for balanced reactivity.
- Position Mode applies the Weighted Moving Average (WMA) for smoother, long-term trends.
Each method is chosen to best capture the price action dynamics appropriate to the trader’s timeframe.
2. Adaptive Momentum Thresholds
It tracks bullish and bearish momentum with counters that increment as the trend confirms directional movement. When these counters exceed a user-defined threshold, the indicator generates optional buy or sell signals. This approach helps filter out minor fluctuations and highlights significant market moves.
3. Gradient Fills
Two types of fills enhance visual clarity:
- Standard Gradient Fill displays ATR-based zones above and below the trend line, indicating potential bullish and bearish areas.
- Fading Gradient Fill creates a smooth transition between the trend line and the price, visually emphasizing the distance between them.
4. Bar Coloring and Signal Markers
The indicator can color-code bars based on market conditions—bullish, bearish, or neutral—allowing for immediate visual assessment. Additionally, signal markers such as buy and sell arrows are plotted when momentum thresholds are breached.
5. Comprehensive Data Tables
Uptrick: Alpha Trend offers several optional tables for detailed analysis:
- Insider Info: Displays key metrics like the current trend value, bullish/bearish momentum counts, and ATR.
- Indicator Metrics: Lists input settings such as trend length, damping, signal threshold, and net momentum.
- Market Analysis: Summarizes overall trend direction, trend strength, Sortino ratio, return, and volatility.
- Price & Trend Dynamics: Details price deviation from the trend, trend slope, and ATR ratio.
- Momentum & Volatility Insights: Presents RSI, standard deviation (volatility), and net momentum.
- Performance & Acceleration Metrics: Focuses on the Sortino ratio, trend acceleration, return, and trend strength.
Each table can be positioned flexibly on the chart, allowing traders to customize the layout according to their needs.
Why It Combines Specific Smoothing Techniques
Smoothing techniques are essential for filtering out market noise and revealing underlying trends. The indicator combines three smoothing methods for the following reasons:
- The Hull Moving Average (HMA) in Scalp Mode minimizes lag and responds quickly to price changes, which is critical for short-term trading.
- The Exponential Moving Average (EMA) in Swing Mode gives more weight to recent data, striking a balance between speed and smoothness. This makes it suitable for mid-term trend analysis.
- The Weighted Moving Average (WMA) in Position Mode smooths out short-term fluctuations, offering a clear view of longer-term trends and reducing the impact of transient market volatility.
By using these specific methods in their respective trading modes, the indicator ensures that the trend line is appropriately responsive for the intended time frame, enhancing decision-making while maintaining clarity.
Inputs
1. Trend Length (Default: 30)
Defines the lookback period for the smoothing calculation. A shorter trend length results in a more responsive line, while a longer length produces a smoother, less volatile trend.
2. Trend Damping (Default: 0.75)
Controls the degree of smoothing applied to the trend line. Lower values lead to a smoother curve, whereas higher values increase sensitivity to price fluctuations.
3. Signal Strength Threshold (Default: 5)
Specifies the number of consecutive bullish or bearish bars required to trigger a signal. Higher thresholds reduce the frequency of signals, focusing on stronger moves.
4. Enable Bar Coloring (Default: True)
Toggles whether each price bar is colored to indicate bullish, bearish, or neutral conditions.
5. Enable Signals (Default: True)
When enabled, this option plots buy or sell arrows on the chart once the momentum thresholds are met.
6. Enable Standard Gradient Fill (Default: False)
Activates ATR-based gradient fills around the trend line to visualize potential support and resistance zones.
7. Enable Fading Gradient Fill (Default: True)
Draws a gradual color transition between the trend line and the current price, emphasizing their divergence.
8. Trading Mode (Options: Scalp, Swing, Position)
Determines which smoothing method and ATR period to use, adapting the indicator’s behavior to short-term, medium-term, or long-term trading.
9. Table Position Inputs
Allows users to select from nine possible chart positions (top, middle, bottom; left, center, right) for each data table.
10. Show Table Booleans
Separate toggles control the display of each table (Insider Info, Indicator Metrics, Market Analysis, and the three Deep Tables), enabling a customized view of the data.
Color Schemes
(Default) - The colors in the preview image of the indicator.
(Emerald)
(Sapphire)
(Golden Blaze)
(Mystic)
(Monochrome)
(Pastel)
(Vibrant)
(Earth)
(Neon)
Calculations
1. Trend Line Methods
- Scalp Mode: Utilizes the Hull Moving Average (HMA), which computes two weighted moving averages (one at half the length and one at full length), subtracts them, and then applies a final weighted average based on the square root of the length. This method minimizes lag and increases responsiveness.
- Swing Mode: Uses the Exponential Moving Average (EMA), which assigns greater weight to recent prices, thus balancing quick reaction with smoothness.
- Position Mode: Applies the Weighted Moving Average (WMA) to focus on longer-term trends by emphasizing the entire lookback period and reducing the impact of short-term volatility.
2. Momentum Tracking
The indicator maintains separate counters for bullish and bearish momentum. These counters increase as the trend confirms directional movement and reset when the trend reverses. When a counter exceeds the defined signal strength threshold, a corresponding signal (buy or sell) is triggered.
3. Volatility and ATR Zones
The Average True Range (ATR) is calculated using a period that adapts to the selected trading mode (shorter for Scalp, longer for Position). The ATR value is then used to define upper and lower zones around the trend line, highlighting the current level of market volatility.
4. Return and Trend Acceleration
- Return is calculated as the difference between the current and previous closing prices, providing a simple measure of price change.
- Trend Acceleration is derived from the change in the trend line’s movement (its first derivative) compared to the previous bar. This metric indicates whether the trend is gaining or losing momentum.
5. Sortino Ratio and Standard Deviation
- The Sortino Ratio measures risk-adjusted performance by comparing returns to downside volatility (only considering negative price changes).
- Standard Deviation is computed over the lookback period to assess the extent of price fluctuations, offering insights into market stability.
Usage
This indicator is suitable for various time frames and market instruments. Traders can enable or disable specific visual elements such as gradient fills, bar coloring, and signal markers based on their preference. For a minimalist approach, one might choose to display only the primary trend line. For a deeper analysis, enabling multiple tables can provide extensive data on momentum, volatility, trend dynamics, and risk metrics.
Important Note on Risk
Trading involves inherent risk, and no indicator can eliminate the uncertainty of the markets. Past performance is not indicative of future results. It is essential to use proper risk management, test any new tool thoroughly, and consult multiple sources or professional advice before making trading decisions.
Conclusion
Uptrick: Alpha Trend unifies a diverse set of calculations, adaptive smoothing techniques, and customizable visual elements into one powerful tool. By combining the Hull, Exponential, and Weighted Moving Averages, the indicator is able to provide a trend line that is both responsive and smooth, depending on the trading mode. Its advanced color schemes, gradient fills, and detailed data tables deliver a comprehensive analysis of market trends, momentum, and risk. Whether you are a short-term trader or a long-term investor, this indicator aims to clarify price action and assist you in making more informed trading decisions.

MTF Signal XpertMTF Signal Xpert – Detailed Description
Overview:
MTF Signal Xpert is a proprietary, open‑source trading signal indicator that fuses multiple technical analysis methods into one cohesive strategy. Developed after rigorous backtesting and extensive research, this advanced tool is designed to deliver clear BUY and SELL signals by analyzing trend, momentum, and volatility across various timeframes. Its integrated approach not only enhances signal reliability but also incorporates dynamic risk management, helping traders protect their capital while navigating complex market conditions.
Detailed Explanation of How It Works:
Trend Detection via Moving Averages
Dual Moving Averages:
MTF Signal Xpert computes two moving averages—a fast MA and a slow MA—with the flexibility to choose from Simple (SMA), Exponential (EMA), or Hull (HMA) methods. This dual-MA system helps identify the prevailing market trend by contrasting short-term momentum with longer-term trends.
Crossover Logic:
A BUY signal is initiated when the fast MA crosses above the slow MA, coupled with the condition that the current price is above the lower Bollinger Band. This suggests that the market may be emerging from a lower price region. Conversely, a SELL signal is generated when the fast MA crosses below the slow MA and the price is below the upper Bollinger Band, indicating potential bearish pressure.
Recent Crossover Confirmation:
To ensure that signals reflect current market dynamics, the script tracks the number of bars since the moving average crossover event. Only crossovers that occur within a user-defined “candle confirmation” period are considered, which helps filter out outdated signals and improves overall signal accuracy.
Volatility and Price Extremes with Bollinger Bands
Calculation of Bands:
Bollinger Bands are calculated using a 20‑period simple moving average as the central basis, with the upper and lower bands derived from a standard deviation multiplier. This creates dynamic boundaries that adjust according to recent market volatility.
Signal Reinforcement:
For BUY signals, the condition that the price is above the lower Bollinger Band suggests an undervalued market condition, while for SELL signals, the price falling below the upper Bollinger Band reinforces the bearish bias. This volatility context adds depth to the moving average crossover signals.
Momentum Confirmation Using Multiple Oscillators
RSI (Relative Strength Index):
The RSI is computed over 14 periods to determine if the market is in an overbought or oversold state. Only readings within an optimal range (defined by user inputs) validate the signal, ensuring that entries are made during balanced conditions.
MACD (Moving Average Convergence Divergence):
The MACD line is compared with its signal line to assess momentum. A bullish scenario is confirmed when the MACD line is above the signal line, while a bearish scenario is indicated when it is below, thus adding another layer of confirmation.
Awesome Oscillator (AO):
The AO measures the difference between short-term and long-term simple moving averages of the median price. Positive AO values support BUY signals, while negative values back SELL signals, offering additional momentum insight.
ADX (Average Directional Index):
The ADX quantifies trend strength. MTF Signal Xpert only considers signals when the ADX value exceeds a specified threshold, ensuring that trades are taken in strongly trending markets.
Optional Stochastic Oscillator:
An optional stochastic oscillator filter can be enabled to further refine signals. It checks for overbought conditions (supporting SELL signals) or oversold conditions (supporting BUY signals), thus reducing ambiguity.
Multi-Timeframe Verification
Higher Timeframe Filter:
To align short-term signals with broader market trends, the script calculates an EMA on a higher timeframe as specified by the user. This multi-timeframe approach helps ensure that signals on the primary chart are consistent with the overall trend, thereby reducing false signals.
Dynamic Risk Management with ATR
ATR-Based Calculations:
The Average True Range (ATR) is used to measure current market volatility. This value is multiplied by a user-defined factor to dynamically determine stop loss (SL) and take profit (TP) levels, adapting to changing market conditions.
Visual SL/TP Markers:
The calculated SL and TP levels are plotted on the chart as distinct colored dots, enabling traders to quickly identify recommended exit points.
Optional Trailing Stop:
An optional trailing stop feature is available, which adjusts the stop loss as the trade moves favorably, helping to lock in profits while protecting against sudden reversals.
Risk/Reward Ratio Calculation:
MTF Signal Xpert computes a risk/reward ratio based on the dynamic SL and TP levels. This quantitative measure allows traders to assess whether the potential reward justifies the risk associated with a trade.
Condition Weighting and Signal Scoring
Binary Condition Checks:
Each technical condition—ranging from moving average crossovers, Bollinger Band positioning, and RSI range to MACD, AO, ADX, and volume filters—is assigned a binary score (1 if met, 0 if not).
Cumulative Scoring:
These individual scores are summed to generate cumulative bullish and bearish scores, quantifying the overall strength of the signal and providing traders with an objective measure of its viability.
Detailed Signal Explanation:
A comprehensive explanation string is generated, outlining which conditions contributed to the current BUY or SELL signal. This explanation is displayed on an on‑chart dashboard, offering transparency and clarity into the signal generation process.
On-Chart Visualizations and Debug Information
Chart Elements:
The indicator plots all key components—moving averages, Bollinger Bands, SL and TP markers—directly on the chart, providing a clear visual framework for understanding market conditions.
Combined Dashboard:
A dedicated dashboard displays key metrics such as RSI, ADX, and the bullish/bearish scores, alongside a detailed explanation of the current signal. This consolidated view allows traders to quickly grasp the underlying logic.
Debug Table (Optional):
For advanced users, an optional debug table is available. This table breaks down each individual condition, indicating which criteria were met or not met, thus aiding in further analysis and strategy refinement.
Mashup Justification and Originality
MTF Signal Xpert is more than just an aggregation of existing indicators—it is an original synthesis designed to address real-world trading complexities. Here’s how its components work together:
Integrated Trend, Volatility, and Momentum Analysis:
By combining moving averages, Bollinger Bands, and multiple oscillators (RSI, MACD, AO, ADX, and an optional stochastic), the indicator captures diverse market dynamics. Each component reinforces the others, reducing noise and filtering out false signals.
Multi-Timeframe Analysis:
The inclusion of a higher timeframe filter aligns short-term signals with longer-term trends, enhancing overall reliability and reducing the potential for contradictory signals.
Adaptive Risk Management:
Dynamic stop loss and take profit levels, determined using ATR, ensure that the risk management strategy adapts to current market conditions. The optional trailing stop further refines this approach, protecting profits as the market evolves.
Quantitative Signal Scoring:
The condition weighting system provides an objective measure of signal strength, giving traders clear insight into how each technical component contributes to the final decision.
How to Use MTF Signal Xpert:
Input Customization:
Adjust the moving average type and period settings, ATR multipliers, and oscillator thresholds to align with your trading style and the specific market conditions.
Enable or disable the optional stochastic oscillator and trailing stop based on your preference.
Interpreting the Signals:
When a BUY or SELL signal appears, refer to the on‑chart dashboard, which displays key metrics (e.g., RSI, ADX, bullish/bearish scores) along with a detailed breakdown of the conditions that triggered the signal.
Review the SL and TP markers on the chart to understand the associated risk/reward setup.
Risk Management:
Use the dynamically calculated stop loss and take profit levels as guidelines for setting your exit points.
Evaluate the provided risk/reward ratio to ensure that the potential reward justifies the risk before entering a trade.
Debugging and Verification:
Advanced users can enable the debug table to see a condition-by-condition breakdown of the signal generation process, helping refine the strategy and deepen understanding of market dynamics.
Disclaimer:
MTF Signal Xpert is intended for educational and analytical purposes only. Although it is based on robust technical analysis methods and has undergone extensive backtesting, past performance is not indicative of future results. Traders should employ proper risk management and adjust the settings to suit their financial circumstances and risk tolerance.
MTF Signal Xpert represents a comprehensive, original approach to trading signal generation. By blending trend detection, volatility assessment, momentum analysis, multi-timeframe alignment, and adaptive risk management into one integrated system, it provides traders with actionable signals and the transparency needed to understand the logic behind them.

RELATIVE VOLThis script, titled "Relative Vol," is designed to visualize and analyze volume data on TradingView. It calculates and displays the relative volume based on the average volume over a set lookback period, with volume expressed as a percentage of the average. Key features include:
Volume Percentage Calculation: The script calculates the volume percentage relative to the average volume over a specified lookback period (default of 20). It compares the current volume to the historical average and plots it as a percentage on the chart.
Volume Color Coding: The bars are color-coded based on the relationship between price action and volume:
Bullish volume above average: Green
Bearish volume above average: Red
Bullish volume below average: Light gray
Bearish volume below average: Dark gray
Daily Data Integration: It pulls in daily average volume and daily Average True Range (ATR) data:
Displays the daily average volume and ATR values in a table on the top-right of the chart.
Colors in the table reflect whether the daily average volume is high (greater than 1,000,000) and if the daily ATR is above 2.
Custom Timeframe Calculation: The script adjusts the lookback period and volume calculation based on the timeframe of the chart (1-minute, 5-minute, 15-minute, 30-minute, 60-minute, or daily).
This script provides traders with a visual representation of relative volume, helping them identify whether current trading activity is above or below average and how it correlates with price movement. Additionally, the integration of daily volume and ATR data helps assess overall market volatility and liquidity trends.

ATR stop lossPlots the stop loss level based on average true range (ATR) and a multiplier of choice (1 to 2.5, default is 1.5), subtracted from closing price.
Additions in this version:
You can now show percentage labels to help evaluate the level of risk.
The color of the plotted line and the text labels can be picked by the user.

Johnny's Volatility-Driven Trend Identifier w/ Reversal SignalsJohnny's Volatility-Driven Trend Identifier w/ Reversal Signals is designed to identify high-probability trend shifts and reversals by incorporating volatility, momentum, and impulse-based filtering. It is specifically built for traders who want to capture strong trend movements while minimizing false signals caused by low volatility noise.
By leveraging Rate of Change (ROC), Relative Strength Index (RSI), and Average True Range (ATR)-based volatility detection, the indicator dynamically adapts to market conditions. It highlights breakout trends, reversals, and early signs of momentum shifts using strategically placed labels and color-coded trend visualization.
Inspiration taken from Top G indicator .
What This Indicator Does
The Volatility-Driven Trend Identifier works by:
Measuring Market Extremes & Momentum:
Uses ROC normalization with standard deviation to identify impulse moves in price action.
Implements RSI filtering to determine overbought/oversold conditions that validate trend strength.
Utilizes ATR-based volatility tracking to ensure signals only appear when meaningful market movements are occurring.
Identifying Key Trend Events:
Power Peak (🔥): Marks a confirmed strong downtrend, ideal for shorting opportunities.
Surge (🚀): Indicates a confirmed strong uptrend, signaling a potential long entry.
Soft Surge (↗): Highlights a mild bullish reentry or early uptrend formation.
Soft Peak (↘): Shows a mild bearish reentry or early downtrend formation.
Providing Adaptive Filtering for Reliable Signals:
Filters out weak trends with a volatility check, ensuring signals appear only in strong market conditions.
Implements multi-level confirmation by combining trend strength metrics, preventing false breakouts.
Uses gradient-based visualization to color-code market sentiment for quick interpretation.
What This Indicator Signals
Breakouts & Impulse Moves: 🚀🔥
The Surge (🚀) and Power Peak (🔥) labels indicate confirmed momentum breakouts, where the trend has been validated by a combination of ROC impulse, RSI confirmation, and ATR volatility filtering.
These signals suggest that the market is entering a strong trend, and traders can align their entries accordingly.
Early Trend Formation & Reentries: ↗ ↘
The Soft Surge (↗) and Soft Peak (↘) labels indicate areas where a trend might be forming, but is not yet fully confirmed.
These signals help traders anticipate potential entries before the trend gains full strength.
Volatility-Adaptive Trend Filtering: 📊
Since the indicator only activates in volatile conditions, it avoids the pitfalls of low-range choppy markets where false signals frequently occur.
ATR-driven adaptive windowing allows the indicator to dynamically adjust its sensitivity based on real-time volatility conditions.
How to Use This Indicator
1. Identifying High-Probability Entries
Bullish Entries (Long Trades)
Look for 🚀 Surge signals in an uptrend.
Confirm with RSI (should be above 50 for momentum).
Ensure volatility is increasing to validate the breakout.
Use ↗ Soft Surge signals for early entries before the trend fully confirms.
Bearish Entries (Short Trades)
Look for 🔥 Power Peak signals in a downtrend.
RSI should be below 50, indicating downward momentum.
Volatility should be rising, ensuring market momentum is strong.
Use ↘ Soft Peak signals for early entries before a full bearish confirmation.
2. Avoiding False Signals
Ignore signals when the market is ranging (low ATR).
Check RSI and ROC alignment to ensure trend confirmation.
Use additional confluences (e.g., price action, support/resistance levels, moving averages) for enhanced accuracy.
3. Trend Confirmation & Filtering
The stronger the trend, the higher the likelihood that Surge (🚀) and Power Peak (🔥) signals will continue in their direction.
Soft Surge (↗) and Soft Peak (↘) act as early warning signals before major breakouts occur.
What Makes This a Machine Learning-Inspired Moving Average?
While this indicator is not a direct implementation of machine learning (as Pine Script lacks AI/ML capabilities), it mimics machine learning principles by adapting dynamically to market conditions using the following techniques:
Adaptive Trend Selection:
It does not rely on fixed moving averages but instead adapts dynamically based on volatility expansion and momentum detection.
ATR-based filtering adjusts the indicator’s sensitivity to real-time conditions.
Multi-Factor Confirmation (Feature Engineering Equivalent in ML):
Combines ROC, RSI, and ATR in a structured way, similar to how ML models use multiple inputs to filter and classify data.
Implements conditional trend recognition, ensuring that only valid signals pass through the filter.
Noise Reduction with Data Smoothing:
The algorithm avoids false signals by incorporating trend intensity thresholds, much like how ML models remove outliers to refine predictions.
Adaptive filtering ensures that low-volatility environments do not produce misleading signals.
Why Use This Indicator?
✔ Reduces False Signals: Multi-factor validation ensures only high-confidence signals are triggered.
✔ Works in All Market Conditions: Volatility-adaptive nature allows the indicator to perform well in both trending and ranging markets.
✔ Great for Swing & Intraday Trading: It helps spot momentum shifts early and allows traders to catch major market moves before they fully develop.
✔ Visually Intuitive: Color-coded trends and clear signal markers make it easy to interpret.

Liquidity Trap Detector (LTD)The Liquidity Trap Detector is an advanced trading tool designed to identify liquidity zones and potential traps set by institutional players. It provides traders with a comprehensive framework to align with smart money movements, helping them avoid common retail pitfalls such as bull and bear traps.
The indicator focuses on detecting liquidity sweeps, breaker blocks, and areas of institutional accumulation/distribution. It integrates multiple technical analysis methods to offer high-probability signals and insights into how liquidity dynamics unfold in the market.
Note : This indicator is not designed for beginners; it is intended for traders who already have a solid understanding of trading fundamentals. It is tailored for individuals who are familiar with concepts like liquidity, order blocks, and traps. Traders with at least 6 months to 1 year of trading experience will fully appreciate the power and potential of this indicator, as they will have the necessary knowledge to leverage its features effectively. Beginners may find it challenging to grasp the advanced concepts embedded in this tool.
Why Combine These Elements?
The components of the Liquidity Trap Detector are carefully chosen to address the core challenges of identifying institutional activity and liquidity traps. Here’s why each element is included and how they work together:
1. Order Blocks:
• Purpose: Identify zones where large institutional players accumulate or distribute positions.
• Role in the Indicator: These zones act as primary liquidity areas, where price is likely to reverse or consolidate due to significant order flow.
2. Breaker Blocks:
• Purpose: Highlight areas where liquidity has been swept, leading to potential price reversals or continuations.
• Role in the Indicator: Confirms whether a liquidity trap has occurred and provides actionable levels for entry or exit.
3. ATR-Based Volatility Zones:
• Purpose: Filter signals based on market volatility to ensure trades align with statistically significant price movements.
• Role in the Indicator: Defines dynamic support and resistance zones, improving the accuracy of signal generation.
4. Volume Delta:
• Purpose: Measure the imbalance between aggressive buyers and sellers, often indicating institutional activity.
• Role in the Indicator: Validates whether a liquidity trap is backed by smart money absorption or retail-driven momentum.
5. Trend Confirmation (EMA):
• Purpose: Align liquidity trap signals with the broader market trend, reducing false positives.
• Role in the Indicator: Ensures trades are executed in the direction of the prevailing trend.
What Makes It Unique?
1. Gen 1 Liquidity Zones and Traps:
• The indicator identifies Gen 1 Liquidity Zones, which represent the first areas where liquidity is accumulated or swept. While these zones often lead to reversals, they can sometimes fail, resulting in continuation moves. The indicator highlights these scenarios, helping traders adapt.
• For example, a bull trap identified in a Gen 1 Zone may see price move higher after an initial red candle, completing a secondary liquidity sweep before reversing.
2. Multi-Layer Signal Validation:
• Signals are only generated when liquidity, volume, trend, and volatility align. This ensures high-probability setups and reduces noise in choppy markets.
3. Dynamic Adaptability:
• ATR-based zones and volume delta filtering allow the indicator to adapt to different market conditions, from trending to range-bound environments.
4. Institutional Insights:
• By focusing on liquidity sweeps, order blocks, and volume imbalances, the indicator helps traders align with institutional strategies rather than retail behavior.
How It Works
The Liquidity Trap Detector uses a step-by-step process to identify and validate liquidity traps:
1. Identifying Liquidity Zones:
• Order Blocks: Mark key zones of institutional activity where price is likely to reverse.
• Breaker Blocks: Highlight areas where liquidity sweeps have occurred, signaling potential traps.
2. Filtering with Volatility (ATR):
• ATR defines dynamic support and resistance zones, ensuring signals are only generated near significant price levels.
3. Validating Traps with Volume Delta:
• Volume delta shows whether liquidity sweeps are backed by aggressive buying/selling from institutions, confirming the trap’s validity.
4. Aligning with Market Trends:
• EMA ensures signals align with the broader trend to reduce false positives.
5. Monitoring Gen 1 Liquidity Zones:
• The indicator highlights Gen 1 Liquidity Zones where price may initially reverse or sweep further before a true reversal. Traders are alerted to potential continuation scenarios if volume or momentum suggests unmet liquidity above/below the zone.
How to Use It
Buy Signal:
• Triggered when:
• Price sweeps below an order block and forms a breaker block, indicating a liquidity trap.
• Volume delta confirms aggressive selling absorption.
• ATR volatility zone supports the reversal.
• EMA confirms a bullish trend.
• Action: Enter a Buy trade and set:
• Stop Loss (SL): Below the order block.
• Take Profit (TP): Near the next resistance or liquidity zone.
Sell Signal:
• Triggered when:
• Price sweeps above an order block and forms a breaker block, indicating a liquidity trap.
• Volume delta confirms aggressive buying absorption.
• ATR volatility zone supports the reversal.
• EMA confirms a bearish trend.
• Action: Enter a Sell trade and set:
• SL: Above the order block.
• TP: Near the next support or liquidity zone.
Timeframes:
• Best suited for scalping and intraday trading on lower timeframes (5m, 15m, 1H).
• Can also be applied to swing trading on higher timeframes.
Example Scenarios:
1. Bull Trap in a Gen 1 Zone:
• Price sweeps above a resistance order block, forms a breaker block, and reverses sharply. However, if momentum persists, price may continue higher after a minor pullback. The indicator helps traders anticipate this by monitoring volume and trend shifts.
2. Bear Trap with Secondary Sweep:
• Price sweeps below a support order block but fails to reverse immediately, instead forming a secondary liquidity sweep before turning bullish. The indicator highlights both scenarios, allowing for flexible trade management.
Why Use It?
The Liquidity Trap Detector offers:
1. Precision: Combines multiple filters to identify institutional liquidity traps with high accuracy.
2. Adaptability: Works across trending and range-bound markets.
3. Smart Money Alignment: Helps traders avoid retail traps by focusing on liquidity sweeps and institutional behavior.
Choppiness IndexThis Pine Script v6 indicator calculates the Choppiness Index over a user-defined length and segments it based on user-defined thresholds for choppy and trending market conditions. The indicator allows users to toggle the visibility of choppy, trending, and neutral segments using checkboxes.
Here's how it works:
Inputs: Users can set the length for the Choppiness Index calculation and thresholds for choppy and trending conditions. They can also choose which segments to display.
Choppiness Index Calculation: The script calculates the Choppiness Index using the ATR and the highest-high and lowest-low over the specified length.
Segment Determination: The script determines which segment the current Choppiness Index value falls into based on the thresholds. The color changes exactly at the threshold values.
Dynamic Plotting: The Choppiness Index is plotted with a color that changes based on the segment. The plot is only visible if the segment is "turned on" by the user.
Threshold Lines: Dashed horizontal lines are plotted at the choppy and trending thresholds for reference.
This indicator helps traders visualize market conditions and identify potential transitions between choppy and trending phases, with precise color changes at the threshold values.

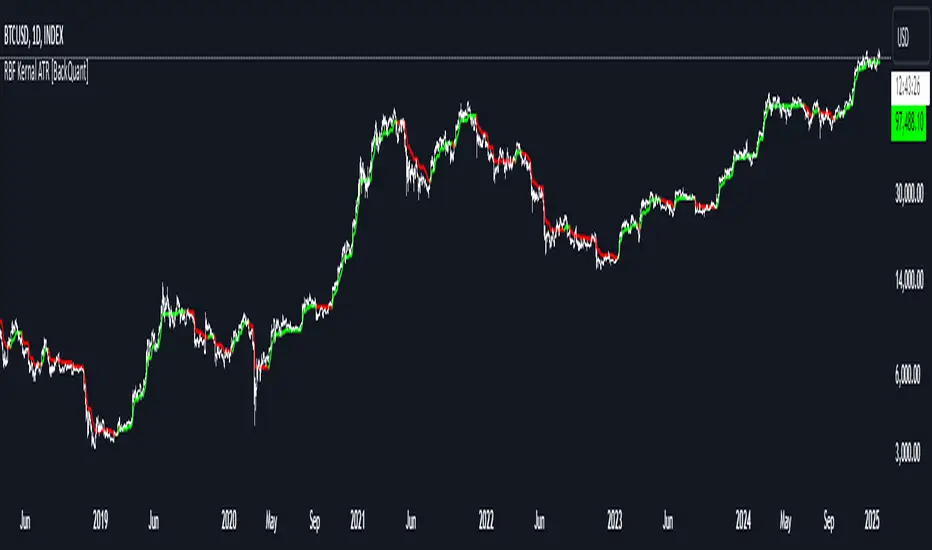
Radial Basis Kernal ATR [BackQuant]Radial Basis Kernel ATR
The Radial Basis Kernel ATR is a trading indicator that combines the classic Average True Range (ATR) with advanced Radial Basis Function (RBF) kernel smoothing . This innovative approach creates a highly adaptive and precise tool for detecting volatility, identifying trends, and providing dynamic support and resistance levels.
With its configurable parameters and ability to adjust to market conditions, this indicator offers traders a robust framework for making informed decisions across various assets and timeframes.
Key Feature: Radial Basis Function Kernel Smoothing
The Radial Basis Function (RBF) kernel is at the heart of this indicator, applying sophisticated mathematical techniques to smooth price data and calculate an enhanced version of ATR. By weighting data points dynamically, the RBF kernel ensures that recent price movements are given appropriate emphasis without overreacting to short-term noise.
The RBF kernel uses a gamma factor to control the degree of smoothing, making it highly adaptable to different asset classes and market conditions:
Gamma Factor Adjustment :
For low-volatility data (e.g., indices), a smaller gamma (0.05–0.1) ensures smoother trends and avoids overly sharp responses.
For high-volatility data (e.g., cryptocurrencies), a larger gamma (0.1–0.2) captures the increased price fluctuations while maintaining stability.
Experimentation is Key : Traders are encouraged to backtest and visually compare different gamma values to find the optimal setting for their specific asset and strategy.
The gamma factor dynamically adjusts based on the variance of the source data, ensuring the indicator remains effective across a wide range of market conditions.
Average True Range (ATR) with Dynamic Bands
The ATR is a widely used volatility measure that captures the degree of price movement over a specific period. This indicator enhances the traditional ATR by integrating the RBF kernel, resulting in a smoothed and adaptive ATR calculation.
Dynamic bands are created around the RBF kernel output using a user-defined ATR factor , offering valuable insights into potential support and resistance zones. These bands expand and contract based on market volatility, providing a visual representation of potential price movement.
Moving Average Confluence
For additional confirmation, the indicator includes the option to overlay a moving average on the smoothed ATR. Traders can choose from several moving average types, such as EMA , SMA , or Hull , and adjust the lookback period to suit their strategy. This feature helps identify broader trends and potential confluence areas, making the indicator even more versatile.
Long and Short Trend Detection
The indicator provides long and short signals based on the directional movement of the smoothed ATR:
Long Signal : Triggered when the ATR crosses above its previous value, indicating bullish momentum.
Short Signal : Triggered when the ATR crosses below its previous value, signaling bearish momentum.
These trend signals are visually highlighted on the chart with green and red bar coloring (optional), providing clear and actionable insights.
Customization Options
The Radial Basis Kernel ATR offers extensive customization options, allowing traders to tailor the indicator to their preferences:
RBF Kernel Settings
Source : Select the price data (e.g., close, high, low) used for the kernel calculation.
Kernel Length : Define the lookback period for the RBF kernel, controlling the smoothing effect.
Gamma Factor : Adjust the smoothing sensitivity, with smaller values for smoother trends and larger values for responsiveness.
ATR Settings
ATR Period : Set the period for ATR calculation, with shorter periods capturing more short-term volatility and longer periods providing a broader view.
ATR Factor : Adjust the scaling of ATR bands for dynamic support and resistance levels.
Confluence Settings
Moving Average Type : Choose from various moving average types for additional trend confirmation.
Moving Average Period : Define the lookback period for the moving average overlay.
Visualization
Trend Coloring : Enable or disable bar coloring based on trend direction (green for long, red for short).
Background Highlighting : Add optional background shading to emphasize long and short trends visually.
Line Width : Customize the thickness of the plotted ATR line for better visibility.
Alerts and Automation
To help traders stay on top of market movements, the indicator includes built-in alerts for trend changes:
Kernel ATR Trend Up : Triggered when the ATR indicates a bullish trend.
Kernel ATR Trend Down : Triggered when the ATR signals a bearish trend.
These alerts ensure traders never miss important opportunities, providing timely notifications directly to their preferred device.
Suggested Gamma Values
The effectiveness of the gamma factor depends on the asset type and the selected kernel length:
Low Volatility Assets (e.g., indices): Use a smaller gamma factor (approximately 0.05–0.1) for smoother trends.
High Volatility Assets (e.g., crypto): Use a larger gamma factor (approximately 0.1–0.2) to capture sharper price movements.
Experimentation : Fine-tune the gamma factor using backtests or visual comparisons to optimize for specific assets and strategies.
Trading Applications
The Radial Basis Kernel ATR is a versatile tool suitable for various trading styles and strategies:
Trend Following : Use the smoothed ATR and dynamic bands to identify and follow trends with confidence.
Reversal Trading : Spot potential reversals by observing interactions with dynamic ATR bands and moving average confluence.
Volatility Analysis : Analyze market volatility to adjust risk management strategies or position sizing.
Final Thoughts
The Radial Basis Kernel ATR combines advanced mathematical techniques with the practical utility of ATR, offering traders a powerful and adaptive tool for volatility analysis and trend detection. Its ability to dynamically adjust to market conditions through the RBF kernel and gamma factor makes it a unique and indispensable part of any trader's toolkit.
By combining sophisticated smoothing , dynamic bands , and customizable visualization , this indicator enhances the ability to read market conditions and make more informed trading decisions. As always, backtesting and incorporating it into a broader strategy are recommended for optimal results.
Comprehensive Volume and Metrics with Pre-Market Volume Data
This script is designed for traders who want a detailed view of market activity, including regular market and pre-market volume, dollar volume, relative volume (RVOL), average daily range (ADR), average true range (ATR), relative strength index (RSI), and the QQQ’s percentage change.
The script includes customizable metrics displayed in tables on the chart for easy analysis, with the option to toggle the visibility of each metric.
Key Features:
Volume and Dollar Volume:
Displays the volume of shares traded during the current day (or pre-market, if enabled).
Includes a calculation of dollar volume, representing the total dollar amount of trades (Volume × Close Price).
Relative Volume (RVOL):
Displays RVOL Day, which is the relative volume of the current day compared to the 2-day moving average.
Shows RVOL 90D, indicating relative volume over the past 90 days.
Both RVOL metrics are calculated as percentages and display the percentage change compared to the standard (100%).
Pre-Market Data:
Includes pre-market volume (PVOL) and pre-market dollar volume (P$ VOL) which are displayed only if pre-market data is enabled.
Tracks volume and dollar volume during pre-market hours (4:00 AM to 9:30 AM Eastern Time) for more in-depth analysis.
Optionally, shows pre-market RSI based on volume-weighted close prices.
Average Daily Range (ADR):
Displays the percentage change between the highest and lowest prices over the defined ADR period (default is 20 days).
Average True Range (ATR):
Shows the ATR, a popular volatility indicator, for a given period (default is 14 bars).
RSI (Relative Strength Index):
Displays RSI for the given period (default is 14).
RSI is calculated using pre-market data when available.
QQQ:
Shows the percentage change of the QQQ ETF from the previous day’s close.
The QQQ percentage change is color-coded: green for positive, red for negative, and gray for no change.
Customizable Inputs:
Visibility Options: Toggle the visibility of each metric, such as volume, dollar volume, RVOL, ADR, ATR, RSI, and QQQ.
Pre-Market Data: Enable or disable the display of pre-market data for volume and dollar volume.
Table Positioning: Adjust the position of tables displaying the metrics either at the bottom-left or bottom-right of the chart.
Text Color and Table Background: Choose between white or black text for the tables and customize the background color.
Tables:
The script utilizes tables to display multiple metrics in an organized and easy-to-read format.
The values are updated dynamically, reflecting real-time data as the market moves.
Pre-Market Data:
The script calculates pre-market volume and dollar volume, along with other key metrics like RSI and RVOL, to help assess market sentiment before the market officially opens.
The pre-market data is accumulated from 4:00 AM to 9:30 AM ET, allowing for pre-market analysis and comparison to regular market hours.
User-Friendly and Flexible:
This script is designed to be highly customizable, giving you the ability to toggle which metrics to display and where they appear on the chart. You can easily focus on the data that matters most to your trading strategy.

Dual EMA Volatility Barrier | JeffreyTimmermansDual EMA Volatility Barrier
The "Dual EMA Volatility Barrier" indicator combines the power of the Double Exponential Moving Average (DEMA) with volatility-based stops to provide a robust trend-following system. This indicator helps traders identify and confirm trends, offering a way to filter out noise using volatility measures like the Average True Range (ATR) and a higher timeframe filter for additional trend validation.
Key Features
Dual Exponential Moving Average (DEMA):
DEMA Calculation: A more responsive moving average that reduces lag compared to standard EMAs. This helps detect trend changes faster.
Source Customization: Allows traders to choose the source (default is close), which can help adapt the strategy for different market conditions.
Volatility Barrier (Vstop):
Volatility-Based Stops: The Vstop is calculated using the Average True Range (ATR) multiplied by a user-defined factor. This forms a dynamic stop level that adjusts based on market volatility.
Trend Direction: The Vstop adapts to whether the market is in an uptrend or downtrend, providing a stop-loss level that moves accordingly.
Higher Timeframe Trend Filter:
Higher Timeframe DEMA: The higher timeframe filter uses a DEMA from a larger timeframe to confirm the trend direction. Only consider bullish signals if the price is above the higher timeframe DEMA.
Customizable Higher Timeframe: Traders can select any timeframe (e.g., D for daily) to check the trend from a higher perspective.
Signal Generation:
Bullish Signal: Triggered when the trend is up, and the price is above the higher timeframe DEMA, with a corresponding Vstop change indicating an upward trend.
Bearish Signal: Triggered when the trend is down and the price is below the higher timeframe DEMA, with a corresponding Vstop change indicating a downward trend.
Trend Reversals: Identifies key trend reversals by showing the transition between uptrend and downtrend states.
Plotting and Visuals:
DEMA and Vstop Plot: The indicator plots both the DEMA and the Vstop on the chart, providing a visual guide for trend and volatility.
Background Color Fill: The area between the DEMA and Vstop is filled with a color (green for bullish, red for bearish) to provide a clear visual representation of the trend.
Signal Labels: Plot arrows and labels ("Bullish" and "Bearish") directly on the chart to highlight trend changes.
Dashboard:
Ticker & Timeframe Display: The dashboard in the bottom-right corner shows the current symbol (ticker) and timeframe, along with the current trend (Bullish or Bearish).
Real-Time Updates: The dashboard updates in real time, providing traders with quick insights into the current market conditions.
Alerts:
Bullish Alert: Activated when the trend is bullish and confirmed by the higher timeframe DEMA.
Bearish Alert: Activated when the trend is bearish and confirmed by the higher timeframe DEMA.
Customizable Messages: Alerts provide details about the ticker and trend conditions for easy action.
Improvements:
Higher Timeframe Filtering: The higher timeframe DEMA filter ensures that traders align their trades with the broader market trend, improving the overall accuracy of signals.
Volatility-Based Stops: The ATR-based volatility stops allow for adaptive risk management that responds to changing market conditions.
Dynamic Signal Detection: The bullish and bearish signals change in real time, providing actionable insights for traders.
Visual and Dashboard Updates: The chart visually reflects the trend and volatility dynamics, while the dashboard provides summary information at a glance.
Customizable Alerts: Alerts based on trend changes make it easy to stay informed without constantly monitoring the chart.
Use Cases:
Trend Following: Ideal for identifying and following strong trends by combining short-term and long-term trend indicators.
Volatility-Based Risk Management: Use the Vstop to manage trade exits, as it adjusts to market volatility.
Higher Timeframe Confirmation: Use the higher timeframe DEMA to ensure that the trade aligns with the overall market trend.
Alerts for Real-Time Action: Set alerts to notify when the market signals a shift, whether bullish or bearish.
The Dual EMA Volatility Barrier is a powerful tool for traders seeking to combine trend-following with volatility management. The integration of DEMA, ATR, and a higher timeframe filter allows for a more nuanced understanding of market conditions, ensuring traders can make informed decisions with minimal lag.
This script is inspired by "viResearch" . However, it is more advanced and includes additional features and options.
-Jeffrey
Trendilo ARTrendilo AR is a custom trading indicator designed to identify market trends using advanced techniques such as the Arnaud Legoux Moving Average (ALMA), volume confirmations, and dynamic volatility bands. This indicator provides a clear visualization of trends, including significant changes and custom alerts.
Review of Indicators Used
1. ALMA
Description:
ALMA is a moving average that applies an advanced filter to smooth price data, reducing noise and focusing on actual trends.
Usage in the Indicator:
Used to calculate the smoothed percentage price change and determine trend direction. Customizable parameters include:
- Length: Defines the number of bars to consider.
- Offset: Adjusts sensitivity toward recent prices.
- Sigma: Controls the degree of smoothing.
Advantages:
- Reduced lag in trend detection.
- Resistance to market noise.
2. ATR
Description:
ATR measures the market’s average volatility by considering the range between high and low prices over a given period.
Usage in the Indicator:
ATR is used to calculate "dynamic smoothing", adjusting the indicator’s sensitivity based on current market volatility.
Advantages:
- Adapts to high or low volatility conditions.
- Helps define dynamic support and resistance levels.
3. SMA
Description:
SMA calculates the average of prices or volume over a specific time period.
Usage in the Indicator:
Used to calculate the volume moving average (Volume SMA) to confirm whether the current volume supports the detected trend.
Advantages:
- Easy to understand and calculate.
- Provides volume-based trend confirmation.
4. RMS Bands
Description:
RMS Bands calculate the standard deviation of percentage price changes, creating upper and lower levels that act as overbought and oversold indicators.
Usage in the Indicator:
- Define the range within which the market is considered neutral.
- Crosses above or below the bands indicate trend changes.
Advantages:
- Visual identification of strong trends.
- Helps filter false signals.
Colors and Visuals Used in the Indicator
1. ALMA Line
Colors:
- Green: Indicates a confirmed uptrend (with sufficient volume).
- Red: Indicates a confirmed downtrend (with sufficient volume).
- Gray: Indicates a neutral phase or insufficient volume to confirm a trend.
2. RMS Bands
- Upper and Lower Lines:
- Purple (with transparency): These lines represent the RMS bands (upper and lower) and
adjust opacity based on trend strength.
- Stronger trends result in less transparency (more solid colors).
3. Highlighted Background (Strong Trends)
- Color:
- Light Green (transparent): Highlights a strong trend when the smoothed percentage change (ALMA) exceeds 1.5 times the RMS.
4. Horizontal Lines
- Baseline (0):
- Dark Gray: Serves as a central reference to identify the directionality of percentage changes.
- Additional Line (0.1):
- Blue: A customizable line to mark user-defined key levels.
5. Bar Colors
- Bar Colors:
- Green: When the price is in a confirmed uptrend.
- Red: When the price is in a confirmed downtrend.
- No color: When there is insufficient volume or no clear trend.
How to Use the Indicator
1. Initial Setup
1. Add the Indicator to Your Chart: Copy the code into the Pine Editor on TradingView and apply it to your chart.
2. Customize Parameters: Adjust values based on your trading strategy:
- Smoothing: Controls the level of smoothing for percentage changes.
- Lookback Length: Defines the observation period for calculations.
- Band Multiplier: Adjusts the width of RMS bands.
2. Signal Interpretation
1. Indicator Colors:
- Green: Confirmed uptrend.
- Red: Confirmed downtrend.
- Gray: No clear trend or insufficient volume.
2. RMS Bands:
- If the ALMA line (smoothed percentage change) crosses above the upper RMS band, it signals a potential uptrend.
- If it crosses below the lower RMS band, it signals a potential downtrend.
3. Volume Confirmation:
- The indicator's color activates only if the current volume exceeds the Volume SMA.
3. Alerts and Decisions
1. Trend Change Alerts:
- The indicator automatically triggers alerts when an uptrend or downtrend is detected.
- Configure these alerts to receive real-time notifications.
2. Strong Trend Signals:
- When the magnitude of the percentage change exceeds 1.5 times the RMS, the chart background highlights the strong trend.
4. Trading Strategies
1. Buy:
- Enter long positions when:
- The indicator turns green.
- Volume confirms the trend.
- Consider placing a stop-loss just below the lower RMS band.
2. Sell:
- Enter short positions when:
- The indicator turns red.
- Volume confirms the trend.
- Consider placing a stop-loss just above the upper RMS band.
3. Neutral:
- Avoid trading when the indicator is gray, as no clear trend or insufficient volume is present.
Disclaimer: As this is my first published indicator, please use it with caution. Feedback is highly appreciated to improve its performance.
Happy Trading!

Risk-Adjusted Trend IndicatorThe Risk-Adjusted Trend Indicator is a comprehensive tool designed to evaluate market trends while factoring in risk levels. By combining trend strength, volatility, and dynamic scaling, this indicator provides traders with clear, actionable signals for optimal entries and exits. Its focus on risk-adjusted metrics ensures that signals are both reliable and contextually informed by prevailing market conditions.
Key Features:
1. Exponential Moving Average (EMA):
• The EMA serves as the foundation for trend detection, offering a smoothed representation of price movement over a user-defined period.
• Aids in distinguishing bullish and bearish trends effectively.
2. Average True Range (ATR):
• ATR is used to gauge market volatility, ensuring that the indicator adapts to changing market conditions.
• Facilitates the normalization of trend strength relative to current market volatility.
3. Risk-Adjusted Trend Score:
• Computes the difference between the price and EMA and normalizes it using the ATR to account for risk.
• This metric allows traders to focus on trends with favorable risk-reward ratios, filtering out weak or high-risk setups.
4. Dynamic Scaling:
• Adjusts the risk-adjusted score to fit within the chart’s price range, making the visualization intuitive and easy to interpret.
5. Buy/Sell Signals:
• Buy signals are triggered when the risk-adjusted score crosses above a positive threshold.
• Sell signals are triggered when the score crosses below a negative threshold.
• Signals are plotted directly on the chart with intuitive markers for quick decision-making.
6. Background Color Zones:
• Highlights bullish and bearish trend zones using subtle background shading, enhancing visual clarity.
Reason for Combining These Elements
The Risk-Adjusted Trend Indicator blends elements of trend analysis, volatility measurement, and risk assessment to address a fundamental challenge in trading: identifying high-confidence trades that align with a trader’s risk tolerance. Here’s why these components were chosen and how they work together:
1. EMA (Trend Detection):
• Provides a reliable baseline for trend direction, ensuring that the indicator aligns with the market’s prevailing trend.
2. ATR (Volatility Normalization):
• Adjusts trend strength calculations based on market volatility, allowing the indicator to adapt to varying market conditions and avoid false signals in high-volatility environments.
3. Risk-Adjusted Score:
• By factoring in both trend strength and volatility, this score ensures that only trends with favorable risk-reward dynamics are highlighted.
• This approach minimizes overtrading and reduces exposure to high-risk setups.
4. Dynamic Scaling:
• Ensures that the indicator’s outputs remain visually accessible, regardless of the asset or timeframe being analyzed.
• Enhances usability by aligning the score with price action on the chart.
5. Visual Aids (Signals and Background Zones):
• The inclusion of visual signals and background zones simplifies decision-making, making the tool suitable for both novice and experienced traders.

Improved Trend Shot | JeffreyTimmermansImproved Trend Shot
The "Improved Trend Shot" is an advanced trend-following tool that integrates cutting-edge features and the principles of John Ehlers’ SuperSmoother Filter to provide traders with more accurate trend detection and better decision-making. This enhanced version includes multiple smoothing types, customizable lengths, dynamic alerts, and a comprehensive dashboard to help traders quickly interpret market conditions.
This script is inspired by "TRW" . However, it is more advanced and includes additional features and options.
Key Features and Improvements
Smoothed Lines and Trend Detection
The core of the Improved Smooth Trend Shot relies on three key lines to capture market momentum:
Fast Line: Highly sensitive to short-term price changes, offering rapid responsiveness to market movements.
Middle Line: Provides a medium-term view of market trends, acting as a more stable reference.
Slow Line: Focuses on long-term trends, offering a broader perspective on market direction.
These three smoothed lines interact dynamically to create a visual color-coded cloud that helps traders easily interpret market conditions:
Green Cloud: Indicates an upward trend when the Fast line is above the Slow line.
Red Cloud: Signals a downward trend when the Fast line is below the Slow line.
The cloud color adjusts based on the relative positioning of the Fast, Middle, and Slow lines, helping traders to identify bullish or bearish trends with ease.
Dynamic Cloud Visualization and Alerts
The cloud and trend lines adapt to market conditions, updating in real-time to reflect changes in trend strength and momentum. Traders can also set up real-time alerts to notify them of important trend shifts, such as:
Fast and Slow Crossovers: Alerts when the Fast line crosses the Slow line.
Middle and Slow Crossovers: Alerts when the Middle line crosses the Slow line.
This makes it easier to capture trading opportunities and respond promptly to market changes.
Enhanced Smoothing Options
Traders can now choose from multiple smoothing types, including:
EMA (Exponential Moving Average)
SMA (Simple Moving Average)
DEMA (Double Exponential Moving Average)
WMA (Weighted Moving Average)
Each smoothing type has different properties, allowing traders to select the best fit for their trading style. The smoothing length can also be customized, offering flexibility in fine-tuning how sensitive or stable the trend lines should be.
Improved Signal Logic and Precision
The signal logic has been optimized for better precision. Now, the system provides more accurate buy and sell alerts based on:
Trend Detection: The color-coded cloud and the relative positions of the Fast, Middle, and Slow lines help visualize whether the trend is bullish or bearish.
Rising and Falling Indicators: The indicator also checks if each line is rising or falling over the last three bars, offering early signals of momentum shifts.
Dashboard Insights
The dashboard provides real-time updates on the positions and movements of the smoothed lines:
Line Positions: Displays the positions of the Fast, Middle, and Slow lines.
Trend Direction: Shows whether each line is rising or falling.
Price Levels: Displays the price levels for each of the smoothed lines, offering clear reference points for market evaluation.
These features help traders better understand the state of the market, offering valuable insights for both trend-following and reversal-based strategies.
Crossovers and Signal Triggers
The Improved Smooth Trend Shot focuses on crossovers between the different smoothed lines as primary trading signals. There are two types of crossovers:
Fast Shots: This occurs when the Fast line crosses the Slow line.
Slow Shots: This occurs when the Middle line crosses the Slow line.
These crossovers serve as key entry or exit points for traders, helping them spot potential trend reversals. The improved logic ensures that crossovers are accurately detected, reducing the chances of false signals.
Customization Options
The Improved Smooth Trend Shot offers a high degree of customization:
Smoothing Length: Adjust the smoothing period to balance between fast responses and stable trends.
Source Selection: Default to the average of high and low prices (hl2), or choose other price sources.
Smoothing Type: Select from EMA, SMA, DEMA, or WMA for personalized trend analysis.
Signal Type: Choose between Fast Shots or Slow Shots based on the type of crossover you want to focus on.
Long, Medium, and Short-Term Applications
Although the default settings are optimized for long-term trend analysis, the Improved Smooth Trend Shot is highly adaptable. By adjusting the smoothing length and selecting different smoothing types, traders can use the tool for:
Short-Term Trading: Focus on fast responses to market shifts using shorter smoothing periods.
Medium-Term Trading: Tailor the settings to capture intermediate trends.
Long-Term Trend Analysis: Use longer smoothing periods for a more stable and comprehensive view of market dynamics.
Advanced ATR Filtering and Alerts
The inclusion of ATR (Average True Range) filtering helps ensure that signals are triggered only when significant price movements occur. This helps reduce noise and false signals, ensuring traders only act on meaningful market shifts.
Conclusion
The Improved Smooth Trend Shot is a powerful and versatile tool that enhances the original SuperSmoother Filter with advanced features like customizable smoothing options, real-time alerts, and an intuitive dashboard. Whether you're a day trader, swing trader, or long-term investor, this enhanced indicator provides a comprehensive and actionable view of market trends.
The combination of enhanced signal accuracy, dynamic trend visualization, and in-depth customization ensures that the Improved Smooth Trend Shot is an indispensable tool for traders across all market conditions.
-Jeffrey

DAILY ATR LEVELS AND EXPECTED MOVE LEVELSThis Pine Script code is designed to visualize ATR (Average True Range) levels and expected move levels on a chart. It provides useful inputs for customizing how these levels are displayed, such as line width, style, and color. The script is divided into several sections, each focused on a different feature:
1. User Inputs for Customization:
- Line Width and Style: Users can customize the line width, style (solid, dotted, or dashed), and color for various levels.
- Offset for Line Placement: The rightOffset input controls how far in the future the lines extend (measured in minutes).
- Show Labels: Labels can be toggled on/off for ATR levels and expected move lines, with customizable text colors.
2. ATR Levels and ATR Settings:
- The ATR length (atrLength) and the multiplier (atrMultiplier) control the calculation of ATR levels.
- The script plots ATR levels based on the daily open price, including key levels like ATR +25%, ATR +50%, etc., for both positive and negative movements.
- Line Drawing: The script dynamically creates lines for each ATR level, and the lines are customized according to the user's inputs. For each level, the line.new function is used to plot a line from the start of the day (daily open) to a point offset in the future.
- Labels: Labels are added near each ATR level to make them more identifiable, such as "ATR +25%" or "Daily Open."
3. Expected Move Calculation and Logic:
- The script calculates the expected move for the next trading session based on the previous close price and the volatility derived from the VIX (Volatility Index).
- The expected move is calculated as a percentage of the previous close and is added and subtracted from the previous close price to generate upper and lower levels.
- Volatility Adjustment: The VIX value is adjusted by the square root of 252 (the number of average trading days in a year) to calculate the daily volatility.
- Upper and Lower Lines: Lines are drawn for the expected move's upper and lower bounds, showing the potential price movement based on volatility.
4. Customizable Expected Move Lines:
- Line Style and Color: The upper and lower expected move lines can be customized in terms of width, style, and color, as specified by the user.
- Labels for Expected Move Levels: Labels are added for the upper and lower expected move lines, such as "Expected Move Upper" and "Expected Move Lower."
5. Logic for Drawing Lines:
- The script continuously evaluates whether the levels should be displayed based on the user's preferences.
- If showATRLevels or showLineEM is enabled, the script will draw the respective lines and labels on the chart.
- It uses line.new to draw the lines and label.new to position the labels at the correct levels on the chart.
6. Handling Time and Line Deletion:
- The script handles the dynamic nature of the chart by deleting previous lines (using line.delete) to avoid cluttering the chart with outdated lines.
- The time for the lines is set dynamically using the startTime and endTime variables, ensuring that lines are drawn within the correct timeframe.
Summary of Key Features:
- ATR Levels: Plots key levels of ATR, such as daily open, ATR +25%, ATR -25%, etc., with customizable colors and line styles.
- Expected Move Levels: Calculates and plots the upper and lower bounds of the expected move based on the VIX and previous close price.
- Customization Options: Users can control the appearance (line width, style, color) and whether to show labels for the ATR and expected move levels.
- Dynamic Updates: The lines and labels update dynamically throughout the trading day, adjusting based on market conditions.
Overall, this script is designed to help traders visualize volatility and potential price movement on a daily chart by providing ATR-based levels and expected move projections. It offers a high degree of customization to suit different charting preferences.

ADR Table BY @ICT_YEROADR Table BY @ICT_YERO
Created by: @ICT_YERO
This custom indicator is designed to provide the Average Daily Range (ADR) for multiple timeframes, including Daily, 4-Hour, and 1-Hour. The indicator is tailored to assist traders in understanding price volatility and making informed trading decisions.
Key Features
Multi-Timeframe ADR Calculation:
Automatically calculates and displays the ADR for Daily, 4-Hour, and 1-Hour timeframes.
Helps traders identify potential price movement ranges for different trading sessions.
Dynamic Range Visualization:
Clear visual representation of the ADR on the chart, making it easy to spot price extremes.
Real-time updates to reflect changes in price movement.
Custom Alerts:
Option to set alerts when the price approaches the ADR high or low.
Useful for identifying potential reversal zones or breakout opportunities.
User-Friendly Interface:
Simple and intuitive settings to customize colors, levels, and display preferences.
Seamlessly integrates with your existing TradingView setup.
ICT-Inspired Methodology:
Designed for traders who follow ICT concepts, focusing on precision and high-probability setups.
Applications
Range Trading: Helps determine the high and low boundaries for scalping or intraday setups.
Volatility Analysis: Understand market behavior during different times of the day or week.
Reversal Zones: Identify areas where price is likely to reverse, based on ADR extremes.
Whether you're a scalper, day trader, or swing trader, this indicator provides a comprehensive overview of price volatility across multiple timeframes, making it an essential tool for your trading arsenal.

DAILY ATR LEVELSThis script is a custom technical indicator for use in TradingView, designed to display daily Average True Range (ATR) levels on the chart, along with the daily opening price. It provides a customizable way to track price levels relative to the daily ATR, which can be useful for traders looking for volatility-based price targets or ranges.
///////////////////////////////////////////////////////////////////////////////////////////////////////////////////////////////////////////////////////
Customization Options:
- Line Width: Determines the thickness of the plotted lines for the ATR levels and daily open line, ranging from 1 to 10.
- Right Offset (minutes): A time offset (in minutes) that shifts the end of the daily opening price line to the right for visual clarity.
- Line Style: The user can choose between solid, dashed, or dotted lines for all the plotted levels.
- Display Options: Users can toggle the visibility of the daily opening price line (showDayLevel), labels (showLabels), and ATR levels (showATRLevels).
- Colors: Customizable colors for the daily opening price line (dayLevelColor), labels (labelTextColor), and the ATR levels for both positive and negative values (atrLevelPlusColor and atrLevelMinusColor).
ATR Settings:
- ATR Length: Defines the number of periods (bars) to use when calculating the ATR. The default is 180, which corresponds to the ATR calculated on the daily chart using the last 180 bars.
- ATR Multiplier: Allows the user to scale the ATR levels by a multiplier (from 0.1 to 5.0), adjusting the sensitivity of the levels.
- ATR Levels: Users can toggle visibility for several predefined ATR levels, such as +25%, +50%, +75%, +100%, -25%, -50%, -75%, and -100%. These levels represent price points above or below the daily open based on the ATR.
///////////////////////////////////////////////////////////////////////////////////////////////////////////////////////////////////////////////////////
ATR Levels Calculation:
- The ATR is calculated based on the daily chart using the ta.atr() function with the specified ATR length, default is set at 180.
- The script computes multiple ATR levels above and below the daily open price, adjusting each level by 25%, 50%, 75%, and 100% of the ATR value (scaled by the ATR multiplier).
ATR Level Plotting:
- For each ATR level (positive and negative), a line is drawn across the chart at the corresponding price level.
- The color, line style, and width of these lines can be customized.
- Each ATR level also has an optional label showing the percentage level (e.g., "ATR +25%") at the specified price, which is positioned at the end of the line.
- The labels are removed from the previous bars to avoid clutter.
Workflow:
- The script first calculates the daily opening price using the request.security() function to pull the open price from the daily chart.
- It then calculates the ATR based on the selected length and multiplier.
- The start time for the daily open line is determined by the bar's timestamp at the start of the day, and the end time is adjusted using the user-defined right offset.
- After determining the relevant price levels (for the opening price and ATR levels), the script plots these levels on the chart as lines. It handles the drawing and deletion of lines to ensure that the chart remains updated in real time.
- If labels are enabled, text labels are displayed next to the ATR levels and the daily open line, providing clear markers for the user.
Practical Use:
- Volatility Analysis: This indicator is useful for identifying key price levels based on daily volatility (ATR). Traders can use it to set potential targets or support/resistance levels that are adjusted for volatility.
- Day Trading or Swing Trading: The daily opening price line helps traders quickly see where the price opened for the day, and the ATR levels give a dynamic range for the day's potential price movement.
Overall, this script is designed to provide a clear, customizable view of daily price levels in relation to the ATR, helping traders make informed decisions based on volatility and price action.

AI InfinityAI Infinity – Multidimensional Market Analysis
Overview
The AI Infinity indicator combines multiple analysis tools into a single solution. Alongside dynamic candle coloring based on MACD and Stochastic signals, it features Alligator lines, several RSI lines (including glow effects), and optionally enabled EMAs (20/50, 100, and 200). Every module is individually configurable, allowing traders to tailor the indicator to their personal style and strategy.
Important Note (Disclaimer)
This indicator is provided for educational and informational purposes only.
It does not constitute financial or investment advice and offers no guarantee of profit.
Each trader is responsible for their own trading decisions.
Past performance does not guarantee future results.
Please review the settings thoroughly and adjust them to your personal risk profile; consider supplementary analyses or professional guidance where appropriate.
Functionality & Components
1. Candle Coloring (MACD & Stochastic)
Objective: Provide an immediate visual snapshot of the market’s condition.
Details:
MACD Signal: Used to identify bullish and bearish momentum.
Stochastic: Detects overbought and oversold zones.
Color Modes: Offers both a simple (two-color) mode and a gradient mode.
2. Alligator Lines
Objective: Assist with trend analysis and determining the market’s current phase.
Details:
Dynamic SMMA Lines (Jaw, Teeth, Lips) that adjust based on volatility and market conditions.
Multiple Lengths: Each element uses a separate smoothing period (13, 8, 5).
Transparency: You can show or hide each line independently.
3. RSI Lines & Glow Effects
Objective: Display the RSI values directly on the price chart so critical levels (e.g., 20, 50, 80) remain visible at a glance.
Details:
RSI Scaling: The RSI is plotted in the chart window, eliminating the need to switch panels.
Dynamic Transparency: A pulse effect indicates when the RSI is near critical thresholds.
Glow Mode: Choose between “Direct Glow” or “Dynamic Transparency” (based on ATR distance).
Custom RSI Length: Freely adjustable (default is 14).
4. Optional EMAs (20/50, 100, 200)
Objective: Utilize moving averages for trend assessment and identifying potential support/resistance areas.
Details:
20/50 EMA: Select which one to display via a dropdown menu.
100 EMA & 200 EMA: Independently enabled.
Color Logic: Automatically green (price > EMA) or red (price < EMA). Each EMA’s up/down color is customizable.
Configuration Options
Candle Coloring:
Choose between Gradient or Simple mode.
Adjust the color scheme for bullish/bearish candles.
Transparency is dynamically based on candle body size and Stochastic state.
Alligator Lines:
Toggle each line (Jaw/Teeth/Lips) on or off.
Select individual colors for each line.
RSI Section:
RSI Length can be set as desired.
RSI lines (0, 20, 50, 80, 100) with user-defined colors and transparency (pulse effect).
Additional lines (e.g., RSI 40/60) are also available.
Glow Effects:
Switch between “Dynamic Transparency” (ATR-based) and “Direct Glow”.
Independently applied to the RSI 100 and RSI 0 lines.
EMAs (20/50, 100, 200):
Activate each one as needed.
Each EMA’s up/down color can be customized.
Example Use Cases
Trend Identification:
Enable Alligator lines to gauge general trend direction through SMMA signals.
Timing:
Watch the Candle Colors to spot potential overbought or oversold conditions.
Fine-Tuning:
Utilize the RSI lines to closely monitor important thresholds (50 as a trend barometer, 80/20 as possible reversal zones).
Filtering:
Enable a 50 EMA to quickly see if the market is trading above (bullish) or below (bearish) it.

Catalyst TrendCatalyst Trend – A Comprehensive Trend and Regime Analyzer
The Catalyst Trend indicator was designed to dynamically and intuitively merge various classic analytical techniques. The goal is to filter out short-term market noise and reveal reliable trend phases or potential turning points. Below is a detailed explanation of its core elements and practical usage.
1. Concept and Idea
Multidimensional Trend Detection
This indicator goes beyond a simple momentum or volatility focus. It factors in multiple measurements to provide a more well-rounded market perspective.
Versatile Indicator Fusion
Linear Regression (LinReg): Multiple LinReg calculations are combined to smooth out price fluctuations and produce a robust trendline—known here as the “Cycle Reduced Line.”
ADX (Average Directional Index): Measures trend strength.
RSI (Relative Strength Index): Flags potential overbought or oversold conditions, in both the current timeframe and a higher timeframe.
ATR (Average True Range): Assesses volatility; used to dynamically adjust calculation lengths.
By weaving these elements together, the indicator adds value beyond simply stacking multiple indicators. It adapts to real-time market conditions, aiming to highlight genuine trends and reduce false signals.
2. Key Functions and Calculations
Dynamic Length & Smoothing
A blend of volatility (ATR), ADX values, and RSI inputs determines how many candles are used in the LinReg calculations and how heavily the data is smoothed.
This allows the indicator to respond promptly during periods of high volatility, while automatically adjusting to filter out unnecessary noise in quieter phases.c
Cycle Reduced Line
The script averages several offset LinReg calculations to produce a cleaner overall signal. Random outliers are thus minimized, making the trend path more visually consistent.
An additional EMA smoothing (“Final Smoothing”) further stabilizes this trendline, reducing the impact of minor price fluctuations.
Channel Bands (Optional)
These bands are derived from the standard deviation of the price residual (the difference between the smoothed price and the trendline).
They highlight potential over-extension zones: the upper band can mark short-term overbought areas, while the lower band might indicate oversold conditions.
Trend and Sideways Determination
Slope Calculation: The slope of the trendline (comparing the current bar to the previous one) helps identify short-term directional shifts.
DX Threshold: Once the ADX surpasses a user-defined threshold and the slope is positive, it may indicate a developing uptrend. Similarly, if the slope is negative and ADX > threshold, it could signal a potential downtrend.
Multi-Level Color Coding
Original Mode: Interpolated colors reflect uptrends, downtrends, and sideways phases, factoring in metrics like ADX and RSI.
Single Color: For a neutral look, the indicator can be displayed in one uniform color.
HTF RSI: This mode uses the higher-timeframe RSI to color the trendline (Long/Short/Neutral), offering a quick gauge of overarching market pressure.
3. Use Cases and Interpretation
Timeframes & Markets
The indicator is versatile and adapts well to different intervals, from 5-minute charts to weekly views.
It can be applied to various markets—crypto, forex, stocks—since volatility and trend strength are universal concepts.
Signal Recognition
Color Swings into a more pronounced upward hue (e.g., green) may signal mounting strength.
Neutral or mixed tones often point to sideways phases, which breakout traders might watch for potential price surges.
A shift to downward colors (e.g., red) may indicate a growing bearish trend.
Channel Bands & Volatility
When the bands spread widely, it’s wise to proceed with caution: abrupt spikes above the upper band or below the lower band can flag rapid short-term extremes.
These bands are more of a reference for potential overextension than a strict buy or sell trigger.
Additional Confirmations
Not a standalone panacea: The Catalyst Trend indicator is an analytical tool, best used alongside other methods such as volume analysis or price action (candlestick patterns, support/resistance levels) to bolster confidence in trading decisions.
4. Practical Tips
Parameter Adjustments
Depending on the market—crypto vs. traditional currency pairs—different ADX, RSI, or smoothing periods may be more effective. Experiment with the settings to tailor the indicator to your preferred timeframe.
Strategic Integration
Trailing Stops: For those riding a trend, the trendline or the channel bands may serve as a reference to trail stop-loss orders.
Trend Confirmation: Using RSI and ADX filters can help traders avoid sideways markets or stay the course when the trend is strong.
5. Important Final Notes
No Guarantee of Profits
No indicator can predict the future. Markets are inherently volatile and often unpredictable.
Responsible Risk Management
Test the indicator in a demo environment or with smaller positions before committing to large trades.

ATR/DTR with Custom Percentage DisplayThis Pine Script indicator provides a detailed view of the Average True Range (ATR) and Daily True Range (DTR), along with additional calculated metrics to assist in analyzing price volatility. The key features of the indicator include:
ATR Calculation:
The ATR is calculated over a user-defined timeframe, allowing traders to assess average market volatility over a specific period.
DTR Calculation:
The DTR represents the absolute range (high - low) of the current or chosen timeframe, providing insights into the day's price movement.
ATR/DTR Percentage:
This metric calculates the DTR as a percentage of the ATR, showing how the daily range compares to the average range, with dynamic coloring to highlight when it exceeds a user-defined threshold.
Custom Percentage of ATR:
Users can input a custom percentage to calculate and display a corresponding value of the ATR. For example, entering 15% will compute and display 15% of the ATR in the indicator’s table.
Dynamic Table Display:
The indicator outputs all these metrics in a well-organized table that is overlaid on the chart. The table includes:
ATR
DTR
ATR/DTR percentage
The user-defined percentage of ATR
Customizable Features:
Color Coding: The table dynamically changes its background color when the ATR/DTR percentage exceeds a user-defined threshold.
Placement Options: The table's position on the chart can be adjusted (e.g., bottom-right, top-center) for optimal visibility.
Use Case:
This indicator is ideal for traders who want a deeper understanding of market volatility and prefer visual representation of how current price movements compare to historical averages. It is especially useful for:
Setting volatility-based stop-loss levels.
Identifying high-volatility trading opportunities.
Tailoring strategies around price movement patterns.
