Trend Follower Intraday [ Adjustable TF ]Trend Follower Intraday for 3 minute Time-Frame (Adjustable) , that has the time condition for Indian Markets as well.
Unlike the Free Scripts - Risk Management , Position Sizing , Partial Exit etc. are also included .
Send us a Message to know more about the strategy.
// ══════════════════════════════════════════════════════════════════════════ //
The Timing can be changed to fit other markets, scroll down to "TIME CONDITION" to know more.
The commission is also included in the strategy .
The basic idea is when ,
1) EMA1 crosses above EMA2 , is a Long condition .
2) EMA1 crosses below EMA2 , is a Short condition .
3) Green Section indicates Long position.
4) Red Section indicates Short position.
5) Allowed hours specifies the trade entry timing.
6) ATR STOP is the stop-loss value on chart , can be adjusted in INPUTS.
7) Target 1 is the 1st target value on chart , can be adjusted in INPUTS.
8) RISK is Maximum Risk per trade for the intraday trade can be changed .
9) Total Capital used can be adjusted under INPUTS.
10) ATR TRAIL is used for trailing after entry, as mentioned in the inputs below.
11) Check trades under the list of trades .
12) Trade only in liquid stocks .
13) Risk only 1-5% of total capital.
14) Inputs can be changed for better back-test results, but also manually check the trades before setting alerts
15) SQUARE OFF TIME - As you change the time frame , also change the square-off time to the candle's closing time.
Eg: For 3min Time-frame , Hour = 2Hrs | Minute = 57min
16) Strategy stops for the day if you have a loss .
17) COMMISSION value is set to 20Rs and SLIPPAGE value is set to 2 . Go to properties to change it .
*The input values and the results are mentioned under "BACKTEST RESULTS" below*
// ══════════════════════════════ //
// ————————> RISK MANAGEMENT <——————— //
// ══════════════════════════════ //
Risk management is done based on max loss per trade and can be adjusted in the INPUTS.
// ═══════════════════════════ //
// ————————> POSITION SIZE <——————— //
// ═══════════════════════════ //
Quantity of each trade is different based on the loss
// ═════════════════════════ //
// ————————> PROPERTIES <——————— //
// ═════════════════════════ //
COMMISSION , SLIPPAGE ,RECALCULATE is already mentioned in the code.
COMMISSION can be charges , based on the broker charges.
// ═══════════════════════════════//
// ————————> TIME CONDITION <————————— //
// ═══════════════════════════════//
The time can be changed in the INPUT.
The Indian Markets open at 9:15am and closes at 3:30pm.
The 'Allowed hours' under Inputs specifies the time at which Entries should happen .
"Close All" function closes all the trades before 3pm , at the open of the next candle.
To change the time to close all trades , check INPUT.
All open trades get closed by 3pm , because some brokers don't allow you to place fresh intraday orders after 3pm .
// ═══════════════════════════════════════════════ //
// ————————> BACKTEST RESULTS ( 123 CLOSED TRADES ) <————————— //
// ═══════════════════════════════════════════════ //
INPUTS can be changed for better Back-Test results.
The strategy applied to NSE:JSWENERGY (3 min Time-Frame and with a capital of 3,00,000 ) gives us 81% profitability , as shown below
It was tested for a period a 6 months with a Profit Factor of 1.957 ,net Profit of 43,000Rs .
Sharpe Ratio = 0.745
Sortino Ratio = 2.091
No strategy in the world promises 100% profits in all market conditions , so always define your risk before trading.
Also check Back-Test results manually ,before setting Alerts
The Graph has a Linear Curve with Consistent Profits.
The INPUTS are as follows,
1) EMA1 ————————————————> 38
2) EMA2 ————————————————> 118
3) ALLOWED HRS ———————————> 9:35 TO 14:30
4) ATR STOP ——————————————> 3.2
5) RISK ——————————————————> 3000
6) ATR TRAIL ———————————————> 2.6
7) TARGET 1 ————————————————> 2.4
8) MAX POSITION VALUE ——————————> 3,00,000
8) MAX DRAWDOWN —————————————> 9,000
8) SQUARE-OFF ————————————————> 14:57
NSE:JSWENERGY
Apply it to your charts Now !
NSE:JSWENERGY
Send us a message for FREE TRIALS | Instant Access
Thank You ☺
Daytrading

CONSOLIDATION BAND BREAKOUT [5MIN TF]CONSOLIDTION BREAKOUT STRATEGY for 5 minute Time-Frame , that has the time condition adjustable for Indian Markets.
// ══════════════════════════════════════════════════════════════════════════ //
Unlike the Free Scripts - Risk Management , Position Sizing , Partial Exit etc. are also included .
Message to know more about the strategy.
// ══════════════════════════════════════════════════════════════════════════ //
The Timing can be changed to fit other markets, scroll down to "TIME CONDITION" to know more.
The commission is also included in the strategy .
The basic idea is when ,
1) Price crosses above upper Level ,indicated by Red Line, is a Long condition .
2) Price crosses below lower Level ,indicated by Green Line , is a Short condition .
3) Candle close crosses above ema1 , is a part of the Long condition .
4) Candle close crosses below ema1 , is a part of the Short condition .
5) Allowed hours specifies the trade entry timing.
6) ATR STOP is the stop-loss value on chart , can be adjusted in INPUTS.
7) Target 1 is the 1st target value on chart , can be adjusted in INPUTS.
8) RISK is Maximum Risk per trade for the intraday trade can be changed .
9) Total Capital used can be adjusted under INPUTS.
10) ATR TRAIL is used for trailing after entry, as mentioned in the inputs below.
11) Check trades under the list of trades .
12) Trade only in liquid stocks .
13) Risk only 1-5% of total capital.
14) Inputs can be changed for better back-test results, but also manually check the trades before setting alerts
15) SQUARE OFF TIME - As you change the time frame , also change the square-off time to that candle's closing time.
Eg: For 3min Time-frame , Hour = 2Hrs | Minute = 57min
16) Strategy stops for the day if you have a loss .
*The input values and the results are mentioned under "BACKTEST RESULTS" below*
// ══════════════════════════════ //
// ————————> RISK MANAGEMENT <——————— //
// ══════════════════════════════ //
Risk management is done based on max loss per trade and can be adjusted in the INPUTS.
// ═══════════════════════════ //
// ————————> POSITION SIZE <——————— //
// ═══════════════════════════ //
Quantity of each trade is different based on the loss
// ═════════════════════════ //
// ————————> PROPERTIES <——————— //
// ═════════════════════════ //
COMMISSION , SLIPPAGE ,RECALCULATE is already mentioned .
COMMISSION can be charges , based on the broker charges.
// ═══════════════════════════════//
// ————————> TIME CONDITION <————————— //
// ═══════════════════════════════//
The time can be changed in the INPUT.
The Indian Markets open at 9:15am and closes at 3:30pm.
The 'Allowed hours' under Inputs specifies the time at which Entries should happen .
"Close All" function closes all the trades before 3pm , at the open of the next candle.
To change the time to close all trades , check INPUT.
All open trades get closed at 3pm , because some brokers don't allow you to place fresh intraday orders after 3pm .
// ═══════════════════════════════════════════════ //
// ————————> BACKTEST RESULTS ( 123 CLOSED TRADES )<————————— //
// ═══════════════════════════════════════════════ //
INPUTS can be changed for better Back-Test results.
The strategy applied to NSE:TCS (5 min Time-Frame and with a capital of 1,00,000 ) gives us 77% profitability , as shown below
It was tested for a period a 1 year with a Profit Factor of 2.143 ,net Profit of 10,886 Rs .
The Initial Capital and Risk can be increased for better results.
The graph has a Linear Curve with Consistent Profits.
The INPUTS are as follows,
1) LENGTH ——————————————> 79
2) MUT_STDEV ————————————> 2.3
3) ALLOWED HRS ———————————> 9:25 TO 14:30
4) ATR STOP ——————————————> 2.2
5) RISK ——————————————————> 400
6) ATR TRAIL ———————————————> 2.6
7) TARGET 1 ————————————————> 2.1
8) MAX POSITION VALUE ——————————> 1,00,000
8) MAX DRAWDOWN —————————————> 2,000
8) SQUARE-OFF ————————————————> 14:55
NSE:TCS
Apply it to your charts Now !!
Send us a message to know more about this strategy
Thank You ☺ NSE:TCS

SUPPORT RESISTANCE STRATEGY [5MIN TF]A SUPPORT RESISTANCE BREAKOUT STRATEGY for 5 minute Time-Frame , that has the time condition for Indian Markets
The Timing can be changed to fit other markets, scroll down to "TIME CONDITION" to know more.
The commission is also included in the strategy .
The basic idea is when ,
1) Price crosses above Resistance Level ,indicated by Red Line, is a Long condition.
2) Price crosses below Support Level ,indicated by Green Line , is a Short condition.
3) Candle high crosses above ema1, is a part of the Long condition .
4) Candle low crosses below ema1, is a part of the Short condition .
5) Volume Threshold is an added confirmation for long/short positions.
6) Maximum Risk per trade for the intraday trade can be changed .
7) Default qty size is set to 50 contracts , which can be changed under settings → properties → order size.
8) ATR is used for trailing after entry, as mentioned in the inputs below.
// ═════════════════════════//
// ————————> INPUTS <————————— //
// ═════════════════════════//
→ L_Bars ———————————> Length of Resistance / Support Levels.
→ R_Bars ———————————> Length of Resistance / Support Levels.
→ Volume Break ———————> Volume Breakout from range to confirm Long/Short position.
→ Price Cross Ema —————> Added condition as explained above (3) and (4).
→ ATR LONG —————————> ATR stoploss trail for Long positions.
→ ATR SHORT ————————> ATR stoploss trail for Short positions.
→ RISK ————————————> Maximum Risk per trade intraday.
The strategy was back-tested on TCS ,the input values and the results are mentioned under "BACKTEST RESULTS" below.
// ═════════════════════════ //
// ————————> PROPERTIES<——————— //
// ═════════════════════════ //
Default_qty_size ————> 50 contracts , which can be changed under
Settings
↓
Properties
↓
Order size
// ═══════════════════════════════//
// ————————> TIME CONDITION <————————— //
// ═══════════════════════════════//
The time can be changed in the script , Add it → click on ' { } ' → Pine editor→ making it a copy [right top corner} → Edit the line 27.
The Indian Markets open at 9:15am and closes at 3:30pm.
The 'time_cond' specifies the time at which Entries should happen .
"Close All" function closes all the trades at 3pm , at the open of the next candle.
To change the time to close all trades , Go to Pine Editor → Edit the line 92 .
All open trades get closed at 3pm , because some brokers don't allow you to place fresh intraday orders after 3pm .
// ═══════════════════════════════════════════════ //
// ————————> BACKTEST RESULTS ( 100 CLOSED TRADES )<————————— //
// ═══════════════════════════════════════════════ //
INPUTS can be changed for better Back-Test results.
The strategy applied to NSE:TCS ( 5 min Time-Frame and contract size 50) gives us 60% profitability , as shown below
It was tested for a period a 6 months with a Profit Factor of 1.8 ,net Profit of 30,000 Rs profit .
Sharpe Ratio : 0.49
Sortino Ratio : 1.4
The graph has a Linear Curve with Consistent Profits.
The INPUTS are as follows,
1) L_Bars —————————> 4
2) R_Bars —————————> 4
3) Volume Break ————> 5
4) Price Cross Ema ——> 100
5) ATR LONG ——————> 2.4
6) ATR SHORT —————> 2.6
7) RISK —————————> 2000
8) Default qty size ——> 50
NSE:TCS
Save it to favorites.
Apply it to your charts Now !!
Thank You ☺ NSE:TCS

PIVOT STRATEGY [INDIAN MARKET TIMING]
A Back-tested Profitable Strategy for Free!!
A PIVOT INTRADAY STRATEGY for 5 minute Time-Frame , that also explains the time condition for Indian Markets
The Timing can be changed to fit other markets, scroll down to "TIME CONDITION" to know more.
The commission is also included in the strategy .
The basic idea is when ,
1) Price crosses above ema1 ,indicated by pivot highest line in green color .
2) Price crosses below ema1 ,indicated by pivot lowest line in red color .
3) Candle high crosses above pivot highest , is the Long condition .
4) Candle low crosses below pivot lowest , is the Short condition .
5) Maximum Risk per trade for the intraday trade can be changed .
6) Default_qty_size is set to 60 contracts , which can be changed under settings → properties → order size .
7) ATR is used for trailing after entry, as mentioned in the inputs below.
// ═════════════════════════//
// ————————> INPUTS <————————— //
// ═════════════════════════//
Leftbars —————> Length of pivot highs and lows
Rightbars —————> Length of pivot highs and lows
Price Cross Ema —————> Added condition
ATR LONG —————> ATR stoploss trail for Long positions
ATR SHORT —————> ATR stoploss trail for Short positions
RISK —————> Maximum Risk per trade for the day
The strategy was back-tested on RELIANCE ,the input values and the results are mentioned under "BACKTEST RESULTS" below .
// ═════════════════════════ //
// ————————> PROPERTIES<——————— //
// ═════════════════════════ //
Default_qty_size ————> 60 contracts , which can be changed under settings
↓
properties
↓
order size
// ═══════════════════════════════//
// ————————> TIME CONDITION <————————— //
// ═══════════════════════════════//
The time can be changed in the script , Add it → click on ' { } ' → Pine editor→ making it a copy [right top corner} → Edit the line 25 .
The Indian Markets open at 9:15am and closes at 3:30pm .
The 'time_cond' specifies the time at which Entries should happen .
"Close All" function closes all the trades at 3pm, at the open of the next candle.
To change the time to close all trades , Go to Pine Editor → Edit the line 103 .
All open trades get closed at 3pm , because some brokers don't allow you to place fresh intraday orders after 3pm .
NSE:RELIANCE
// ═══════════════════════════════════════════════ //
// ————————> BACKTEST RESULTS ( 128 CLOSED TRADES )<————————— //
// ═══════════════════════════════════════════════ //
INPUTS can be changed for better back-test results.
The strategy applied to NIFTY ( 5 min Time-Frame and contract size 60 ) gives us 60% profitability y , as shown below
It was tested for a period a 6 months with a Profit Factor of 1.45 ,net Profit of 21,500Rs profit .
Sharpe Ratio : 0.311
Sortino Ratio : 0.727
The graph has a Linear Curve with consistent profits .
The INPUTS are as follows,
1) Leftbars ————————> 3
2) Rightbars ————————> 5
3) Price Cross Ema ——————> 150
4) ATR LONG ————————> 2.7
5) ATR SHORT ———————> 2.9
6) RISK —————————> 2500
7) Default qty size ——————> 60
NSE:RELIANCE
Save it to favorites.
Apply it to your charts Now !!
↓
FOLLOW US FOR MORE !
Thank me later ;)

3c Ultimate reversal strategy With scanner and backtester v2This might just be the ultimate strategy to identify reversals.
This strategy includes a scanner, a backtester and ability to connect it with you 3 commas bot(See adviced settings below)
Strategy:
-Signals reversal that happened in the last bar. This signal DO NOT repaint.
-Identifies potential reversal that might happen in the current bar but can also not happen depending upon the timeframe closing price.
-The strategy combines the Moving Average Trend Changer, SuperTrend (ATR price detection) and ADX.
-It reduces the number of false signals in sideways market conditons and give more reliable trade signals.
-The signal does not repaint and can be used in any market condition. It determines the trend with high precision.
Take profit:
-Set 2 separate TP conditions.
-You can take profit using percentage, ATR, or RR(Risk Reward), aswell as using Trailing Take Profit.
- Use sell signal from the strategy(I often find way better results using that)
Stoploss:
-You can use either ATR, Percentage or sell signal from the strategy
(For now to let the strategy itself decide when to TP or SL, just set these parameters really high.)
Scanner:
-Identifies coins that are currently in the sell zone
-Identifies coins that are currently in the buy zone
-Screener explores up to 20 pairs in current graph's time frame.
-Optimize the strategy to your liking and use the built in backtester to see if it is a viable strategy.
3commas settings:
-For now you can only use simple bots.
-Create LONG and SHORT bots for the coins you like to trade and set up alerts(You can send long and short signal from the same alert)
-Set TP to 50% the strategy will handle buys and exits based on your inputs.
-Set safety orders to 0. I might add DCA to the strategy if testing proves that to be a good solution.
-When you have made the bots input the bot ID and token adress in the settings of the strategy.
-When creating the alert use this webhook :https://3commas.io/trade_signal/trading_view
-In the message field you use {{strategy.order.alert_message}} as the placeholder.
In the future this signal might make it to the 3commas marketplace. You can then subscribe to that signal where I have cherrypicked coins based on thorough backtesting and optimization.

Trade HourThis script is just finds the best hour to buy and sell hour in a day by checking chart movements in past
For example if the red line is on the 0.63 on BTC/USDT chart it mean the start of 12AM hour on a day is the best hour to buy (all based on
It's just for 1 hour time-frame but you can test it on other charts.
IMPORTANT: You can change time Zone in strategy settings.to get the real hours as your location timezone
IMPORTANT: Its for now just for BTC/USDT but you can optimize and test for other charts...
IMPORTANT: A green and red background color calculated for show the user the best places of buy and sell (green : positive signal, red: negative signals)
settings :
timezone : We choice a time frame for our indicator as our geo location
source : A source to calculate rate of change for it
Time Period : Time period of ROC indicator
About Calculations:
1- We first get a plot that just showing the present hour as a zigzag plot
2- So we use an indicator ( Rate of change ) to calculate chart movements as positive and negative numbers. I tested ROC is the best indicator but you can test close-open or real indicator or etc as indicator.
3 - for observe effects of all previous data we should indicator_cum that just a full sum of indicator values.
4- now we need to split this effects to hours and find out which hour is the best place to buy and which is the best for sell. Ok we should just calculate multiple of hour*indicator and get complete sum of it so:
5- we will divide this number to indicator_cum : (indicator_mul_hour_cum) / indicator_cum
6- Now we have the best hour to buy! and for best sell we should just reverse the ROC indicator and recalculate the best hour for it!
7- A green and red background color calculated for show the user the best places of buy and sell that dynamically changing with observing green and red plots(green : positive signal, red: negative signals) when green plot on 15 so each day on hour 15 the background of strategy indicator will change to 15 and if its go upper after some days and reached to 16 the background green color will move to 16 dynamically.

3C QFL Mean reversalWhat is QFL trading strategy?
QFL stands for Quickfingersluc, and sometimes it is referred to as the Base Strategy or Mean Reversals. Its main idea is about identifying the moment of panic selling and buying below the base level and utilizing Safety orders.
What is Base level or Support Level?
Base level or Support Level refers to the lowest price level that was reached before the moment the price started increasing again. At that level, you can notice that buyers of some cryptocurrencies make a strong reaction.
In this strategy we can also reverse the strategy and go short. But i must warn you that that is alot riskier.
QFL is meant to be used on higher TF's like 1hr, 2hr and 4hr. But this strategy also work well on lower Timeframes.
The script also simulates DCA strategy with parameters used in 3commas DCA bots for futures trading.
Experiment with parameters to find your trading setup.
Beware how large your total leveraged position is and how far can market go before you get liquidated!
Do that with the help of futures liquidation calculators you can find online!
Included:
An internal average price and profit calculating, instead of TV`s native one, which is subject to severe slippage.
A graphic interface, so levels are clearly visible and back-test analyzing made easier.
Long & Short direction of the strategy.
Table display a summary of past trades
Vertical colored lines appear when the new maximum deviation from the original price has
been reached
All the trading happens with total account capital, and all order sizes inputs are expressed in percent.

3C Crossover with TTP & TSLThis is not a set and forget strategy. It needs constant tweaking to maintain a high winrate. Also what works on one pair can be horrible on another.
This strategy works best on the 1 min or 5 min TF but also works well on the 15 min. Haven't done any testing in higher TF's as im only interested in scalping.
If enabled you can retrive data for the filters on any TF.
The strategy do not repaint.
You do not need a 3c subscription to run this strategy as the bot turns on and off the bot itself.
Instructions for the 3commas connector:
1. First, you need to prepare 3commas Long/Short bots that will only listen to custom TV signals.
2. Inputs for the 3commas bot can be found at the end of the user inputs.
3. Once you have entered the required details into the inputs, turn on 3commas comments. They should appear on the chart (looks messy).
4. Now you can add the alert where you should paste the 3commas Webhook URL: 3commas.io
5. For the alert message text insert the placeholder {{strategy.order.comment}} and delete the rest. 6. Once the alert is saved, you can turn off those 3commas comments to have a clearer chart.
7. With a new alert, the bot and trade should launch.
Long or Short trades are determined with a crossing of the fast MA over the slow MA for Long and the opposite for Short. By checking Close position on MA cross the deal will close on a crossover/under of the 2 MA's
You can select from various different MA's and of course lenghts. You can add both EMA filter on any lenght aswell as ATR to determine to go long or short.
Using the MA gap can help you to not enter trades in a low volatile ranging market.
The RSI filter, sets the maximum RSI threshold for a long position and the minimum for a short. By default and what i recomend is that you enter Longs when RSI is above 50 and shorts when RSI are below 50.
-You can set confirmation of the trade direction with RSI , i.e. for Long the RSI must rise a specified number of bars back, vice versa for Short.
Enabling the pullback filter is great to avoid Longing tops and Shorting bottoms.
Stop loss can be set be either a fixed percentage or by using ATR
Take profit can be set by using percentage, ATR or RiskReward ratio(RR). if you use ATR as a stoploss i recomend using RR as the TP.
Yu can choose to trail the TP with either Percentage or ATR
Whats ahead. I really want to incorporate RSI divergencies, but haven't figured out how yet. Any other ideas would be greatly appreciated.
Have a look at my other strategies. They are similar to this but works abit differently.

3C MACD & RSI Scalper no repaintThis is not a set and forget strategy. It needs constant tweaking to maintain a high winrate. Also what works on one pair can be horrible on another.
This strategy works best on the 1 min or 5 min TF but also works well on the 15 min. Haven't done any testing in higher TF's as im only interested in scalping.
If enabled you can retrive data on the MACD and RSI from any timeframe.
The strategy do not repaint.
You can filter on sessions as well as days. Often trading during say only the EU times and not trading during weekends yields better results. This is because weekeds and eg. the Asia Sessions are alot less volatile.
You do not need a 3c subscription to run this strategy as the bot turns on and off the bot itself.
Instructions for the 3commas connector:
1. First, you need to prepare 3commas Long/Short bots that will only listen to custom TV signals.
2. Inputs for the 3commas bot can be found at the end of the user inputs.
3. Once you have entered the required details into the inputs, turn on 3commas comments. They should appear on the chart (looks messy).
4. Now you can add the alert where you should paste the 3commas Webhook URL: 3commas.io
5. For the alert message text insert the placeholder {{strategy.order.comment}} and delete the rest. 6. Once the alert is saved, you can turn off those 3commas comments to have a clearer chart.
7. With a new alert, the bot and trade should launch.
Long or Short trades are determined with a crossing of the fast MA over the slow MA for Long and the opposite for Short. Trades should only happen close to the crossovers.
You can select from various different MA's and of course lenghts. I often find that using HEMA as the fast MA and DEMA as the slow give more trades while also maintaining a high winrate.
Then for Long we use the MACD indicator where we look for high peaks in negative values for Long and vice versa for Shorts. These should be significantly higher than other peaks (or if you will lower peaks for a Long).
The key is to detect high peaks on the histogram, which we will try to achieve by checking if the last 2 values were higher than X bars back. If you want to make it even more specific, then you can turn on the additional checkbox which compares the current value to the average value of X bars back, and if it is greater than, say, 72% the value of the average then it's ok to enter the trade.
The RSI filter, sets the maximum RSI threshold for a long position and the minimum for a short. By default and what i recomend is that you enter Longs when RSI is above 50 and shorts when RSI are below 50.
-You can set confirmation of the trade direction with RSI, i.e. for Long the RSI must rise a specified number of bars back, vice versa for Short.
Enabling the pullback filter is great to avoid Longing tops and Shorting bottoms.
Whats ahead. I really want to incorporate RSI divergencies, but haven't figured out how yet. Any other ideas would be greatly appreciated.
Have a look at my other strategies. They are similar to this but works abit differently.
The 3 strike line and the engulfing candles are not something that has an impact on the script yet, and might never be. But i do like to turn them on for a visual to see if the trade the strategy opened is a good one.

Crypto_Troll_Turtle_StrategyTurtle Strategy for high marketcap cryptocurrencies
I'm glad to launch my strategy which is based on
moving averages / bollinger bands / RSI and volume
It's basically made for scalping with an interesting return over the last two years and a perspectively low drawdown
if you're interested in the strategy and you want to use it for futures trading you can contact me for a money & risk management rules that you can use and prevent you from a huge loss !! it's for free don't worry xD you can find my contact in the author's instructions' label
The optimal timeframe to use is 1H
I'll be trying to launch telegram signals for this strategy as soon as possible for the following pairs: BTCUSDT ETHUSDT BNBUSDT timeframe: 1H
I'm open to all reviews ! thanks !

Hulk Strategy x35 Leverage 5m chart w/Alerts This strategy is a pullback strategy that utilizes 2 EMAs as a way of identifying trend, MACD as an entry signal, and RSI and ADX to filter bad trades. By using the confirmation of all of these indicators the strategy attempts to catch pullbacks, and it is optimized to wait for high probability setups. Take not that the strategy is optimized for use on BTCUSDT along with 35 times leverage(Using leverage is risky). The Hulk Strategy waits for strong trend confirmation and then attempts to identify pullbacks using MACD and RSI. By using these it identifies strong short term movement against the trend(hence the name Hulk). To use the strategy wait for the strategy to make an entry, and then enter with a stop loss of 1.1% and a take profit of 1.35% with respect to if it is a long or short position. The trade frequency of this strategy is high as it is made for use on the 5m timeframe. But this does not mean you will have to be staring at your computer constantly as an average of 1 trade takes place each day. This will vary a lot though, somedays the strategy enters up to 4 times. I wish you good trading and hope that you like this strategy!
P.S. The indicators on my chart are visualizations of the indicators used in the strategy, they are not necessary for the strategy to work though. Also the colored in cloud on the price chart is an EMA cloud and it comes with the strategy when you add it to your chart. This EMA cloud consists of two EMAs a 50 and a 200 EMA.

Top 40 High Low Strategy for SPY, 5minThis strategy is developed based on my High Low Index SPY Top 40 indicator
Notes:
- this strategy is only developed for SPY on the 5 min chart . It seems to work with QQQ as well, but it isn't optimized for it
- P/L shown is based on 10 SPY option contracts, call or put, with strike price closest to the entry SPY price and expiry of 0 to 1 day. This includes commissions (can be changed). This is only an estimate calculated using an arbitrary multiplier factor, this can be changed in the setting
- P/L is based on $5000 initial capital
- Works with both regular / extended trading session turned on/off. However, max drawdown is 1/2 with extended trading session ON
- there is still a bug that doesn't allow alert to be created due to calculation error, will update once fixed
This strategy combines signals from the following indicators to determine entry signals:
- High Low Index SPY Top 40
- MACD
- Linear Regression Slope
Entry signal is triggered when:
- High Low Index line crosses the EMA line
- MACD trending in the same direction
- Linear Regression slope is accelerating above a threshold in the same direction, indicating a strong trend
Profit target(PT) and stop loss(SL) are determined using ATR value, with 2:1 Reward to Risk ratio as default.
Exit signal may be triggered prior to PT or SL trigger when:
- High Low Index SPY Top 40 shows a reversal after overbought or oversold conditions (optional)
- Opposite entry signal is triggered
There are a number of optional settings:
- Turn on/off "option trading", P/L will be calculated using share price only without multiplication factor for trading option contracts
- # of options per trade, default to 10
- Reinvest with profit made
- Trade with trailing SL after PT hit
- Take profit early based on Top 40 overbought/oversold
- Trade 0/1 day expiry. This will signal exit by the end of the day on Mon/Wed/Fri, and only exits 1/2 of positions (if in profit) on Tues/Thurs
- Can reduce the SL level without impacting PT
- No entry between 10:05 - 10:20 (don't ask me why, but statistically it performs better)
Consider donating me some of your profit if you make $$$ hahaha~ ;)
Enjoy~~

Super Auto Breakout Day Trade Volatile stocksThis strategy is looking at MA and distance from MA to determine entry and exit for highly volatile day trade stocks.
This trading strategy is not good for big-cap stocks as the movement there is not much in terms of %.
The target for open trade is to close at a 10% gain or at 2.8% loss which is a good risk to reward ratio.
Premium ScalperThe strategy works with a combination of a number of different factors, including:
- Volume
- Moving averages
- Volatility
- RSI
This strategy generates long and short signals based on volume movements, moving averages and RSI. By combining other algorithms, low volatility periods can be filtered out.
The best results can be achieved by pairing the indicator with a bot through 3Commas and using a diversification strategy. This way you spread your risk over different pairs and you therefore also have a great chance of taking big moves.
The strategy results we display are results WITHOUT leverage. It is therefore also possible to only long on spot with this strategy, but for optimal results a trading bot link is required.
The settings we have used for these results are an order size of 100% with a 0.08% commission size.
Side note: This indicator does NOT use repainting!
We offer the possibility to try the indicator for free for 7 days.

QaSH DCA StrategyThis is a backtesting script that demonstrates the power of incorporating dollar cost averaging into your trading strategies. Catch the bottom of those lightning fast dips buy placing your limit orders ahead of time.
Four entry conditions have been included:
- ASAP mode
- Quickfinger's Luc
- Bullish pivot point
- Bearish pivot point
An EMA-based entry condition filter is included
Placement of all DCA orders is adjustable, and "take profit" % is also variable and can depend on the size of the price dip.
TripleEMA + StochasticRSI + ATR Scalping Strategy by TradeSmartCOINBASE:BTCUSD Hello everyone and welcome to our second script release!
This script is one of many upcoming scripts. This one is a test for us, how it works, how you guys like this kind of stuff, and for feedback what we should change/improve at.
So feel free to comment any suggestions you have.
SCRIPT IS OPTIMIZED FOR:
BTC/USD (Coinbase) 15 minute timeframe
(Keep in mind default settings does not include trading fees, you can set it at the properties)
I recommend using this script on a trading exchange where the fees are extremely low or on an exchange where you get paid to place limit orders.
(I am not a financial avdvisor and none of this is financial advice.)
Now you can modify the following:
Stochastic RSI
3 different EMA
Length of ATR (for stop loss and take profit)
Stop Loss and Take Profit Risk to Reward ratio
Choice between Capital Risk on each trade or Risk of % of Capital
Allowing Short/Long entries only
Limit between dates
Trading days 1-7
We will update the script with more and more features taking in consideration your requests.
Hope you like it! Don't forget to let us know what we should change or improve. Thanks, and have a great day!
STRATEGY ENTRY RULES
LONG
When EMAs are lining up (meaning for ex. 400 < 13 < 7), and the Stochastic RSI crosses upwards (meaning blue line crosses orange upwards), then go long.
SHORT
When EMAs are lining down (meaning for ex. 7 < 13 < 400), and the Stochastic RSI crosses downwards (meaning blue line crosses orange downwards), then go short.
TAKE PROFIT
When price hits the exit price (calculated from stop loss with the risk ratio)
STOP LOSS
When price hits stop loss then exit the position.
QUANTITY TO BUY (Risk per Trade % or Capital %)
Risk Per Trade % attribute: we can set how much money we want to risk on one trade. Meaning that if we lose that particular position, then a Risk Per Trade % value of our equity will be lost.
Example: if you set the Risk Per Trade % to 1 % and you have a 100$ account balance, then if you loose the trade you will loose 1$ max.
Capital % we can set with how big % of our capital we want to enter into a position. Meaning that we enter with a set % of our capital.
Example: if you set the Capital % to 1 % and you have a 100$ account balance, then you will enter the position with 1$.
First Release Settings: (2021-10-25) for BTC/USD (Coinbase) 15 minute timeframe
Stochastic RSI settings: (Not displayed in the script. If you want to see it you have to add it separately.)
K: 3
D: 2
RSI Length: 6
Stochastic Length: 16
RSI Source: hlc3
EMA 1: 5
Source One: Close
EMA 2: 12
Source Two: Close
EMA 3: 215
Source Three: Close
Length of ATR: 16
Stop Loss Multiplier (risk): 3.6
Exit Price Multiplier (reward): 1
Risk Percentage: 3
Allow Long Entries: yes
Allow Short Entries: yes
Valid Trading Days: 1234567
The valid trading days of the Limit Trading Time feature. Numbers represent the days: Sunday (1), Monday (2), Tuesday (3), …, Saturday (7)
If you like this one, follow for more scripts! Thank you for your support!

vStrat Algo 1.0 (BETA)vStrat Algo 1.0
The Very First Scalping/Intraday Trading Algo for Options
Note: If you have any favorite indicators that you use regularly and are helpful, feel free to use them in conjunction to this strategy.
Legend:
long = buy call
short = buy put
close entry = sell call/put
BULL = bullish engulfing
BEAR = bearish engulfing
OS = oversold
OB = overbought
Instructions:
1. You can choose to watch the 3 minute or 5 minute chart but be aware of the Pro’s and Con’s. It’s not recommended to use this strategy on the 1 minute chart, but this works on higher timeframes. Keep in mind that the signals will vary on each timeframe.
3 minute 5 minute
i.ibb.co i.ibb.co
2. It’s best to use this strategy right at market open. If a “long” (buy CALLS) or “short” (buy PUTS) signal was given at pre-market, I do not recommend taking it. Only take signals once the market opens. If you really wish to take the signal that was given 1-5 minutes before the market opened, you most definitely can, but its’s just riskier. What I would do is, wait 3-10 minutes after market open and if one Moving Average is respecting the other and holding above or below it, you can enter especially if the blow is bullish, the vStrat Algo 1.0 will also tell you if the candles are bearish or bullish. Use your best judgement.
i.ibb.co [
3. You do not have to wait for the exit signal, everyone's risk management is different so take profits whenever you're green or hold as long as the short-term MA is still trending above or below the long-term MA and is not touching or bouncing off it.
i.ibb.co
4. Avoid taking any signals from 11:30 AM ET - 2:30 PM ET, when stocks are trading sideways since the algo’s stop losses get triggered here due to the low volume.
i.ibb.co
5. Lastly, there is no magic indicator or strategy, this algorithm is designed based on multiple conditions. Each signal gets triggered when ALL the conditions are met. This strategy is based off advanced moving averages, one that reduces lag and responds quicker than the simple and exponential ones, RSI value, S/R, pivot points, and a few others. I’m always looking for ways to improve this scalping algorithm so rest assured any complaints or suggestions will be taken and fixed as timely as possible. For best results, avoid trading with your emotions. If you’re a new user, open a small position, set a stop loss, and let the algorithm decide how you will trade it for that day. Keep doing this until you get more familiar with the script then slowly increase your position sizing, but do not invest money you can’t afford to lose. Play with the settings, change the lengths if you wish, but the script was created to provide the most accurate signals as it is. If you do decide to change these inputs, the signals will also be different. Take profits whenever you see fit, the goal is to have a green day and grow your account slowly but surely. If you make a profit, do not risk giving your money back to the market by overtrading. Always do your own due diligence and use your best judgement. Good luck, Traders!
DISCLAIMER : All information found here, including any ideas, opinions, views, predictions, forecasts, commentaries, suggestions, or stock picks, expressed, or implied herein, are for informational, entertainment or educational purposes only and should not be construed as personal investment advice. While the information provided is believed to be accurate, it may include errors or inaccuracies. Conduct your own due diligence or consult a licensed financial advisor or broker before making any and all investment decisions. Any investments, trades, speculations, or decisions made on the basis of any information found on this site, expressed, or implied herein, are committed at your own risk, financial or otherwise.
Algo Trading Strategy (Nifty & BankNifty)What is Algo Trading Strategy ( Nifty & Bank Nifty )?
There are many 9 to 5 working professionals who have some spare money to invest each month but they can not do active trading because they are busy with their full time job.
So they wish to have an automated system which could take and close trades for them with a proven back-tested strategy, proper money management, ability to trade within particular timings, pre-defined maximum loss they can bear and so on.
To cater needs of such type of traders, we created from scratch; and published an 'AutoTrading Algo (Nifty & Bank Nifty) in Sep 2021. (The link is given below, please read on).
Many people who want to try this AutoTrading Algo want us to share stats of this algo with them.
In order to fulfil this demand, we have converted that "Algo Trading" Study into a Strategy whose description you are reading right now.
For all other queries related to how our "Algo Trading (Nifty & Bank Nifty)" works, what are its limitations, benefits and other features, please read the description of our main 'Algo Trading (Bank Nifty & Nifty )' study which is available at following link:
Note:
1. in order to test this strategy on longer time period, you must have a Premium TradingView account.
2. If you have premium TradingView account, the stats you generate will exactly match with our stats which we keep sharing in our channel.
3. To Enable Auto-Trading, You will need to connect this Algo with your broker's trading platform through 3rd party platforms. We will guide you on how to do this, when you contact us.

Forex Daytrade T3 MA sessionThis is a simple yet very efficient daytrading strategy for most crosses pairs, like EUR/NZD, EUR/AUD , GBP/NZD, GBP/AUD and so on.
It tends to works best with 1h and 15 min time frame charts.
Its components are :
Entry time = session that we want to trade, where we can combine for example half of London and all of NY using an hour system.
T3 Moving average
Price action.
Rules for entry
For long , we are during the hours we want to trade, current close is price is above previous high and at the same time is above moving average
For short , we are during the hours we want to trade, current close is price is below previous low and at the same time is below moving average
Rules for exit
We exit when either the opposite condition is triggered, if the hours of trading are off or based on a percentage TP/SL system movement.
For this example we use 1% movement both for TP and SL
If you have any questions, let me know !
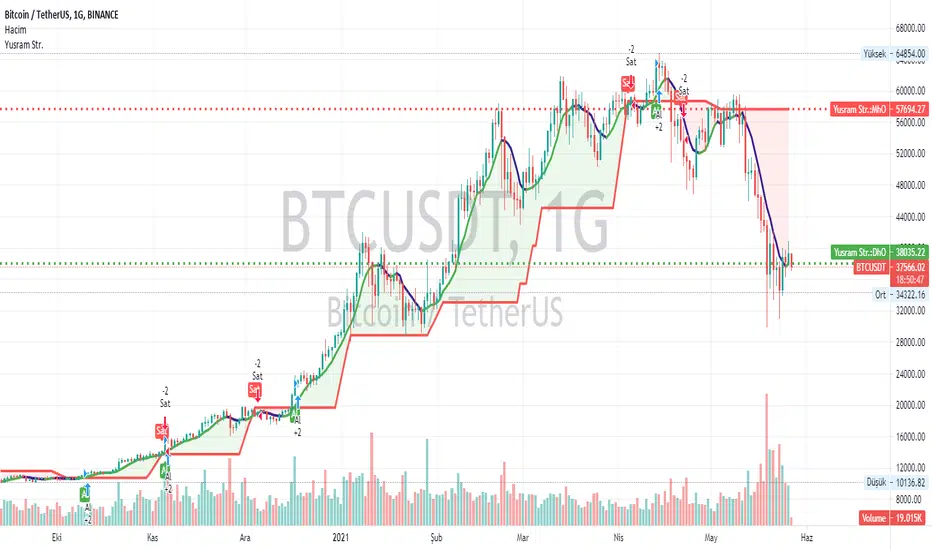
Yusram Mount MaV - Day MaV CrossOver Strgty
This indicator shows the comparison between the 7-day fast simple average and the monthly slow average of 5 bars. The red line indicates the monthly green and blue lines the daily average. If the Green-Blue line crosses the red upwards, it is a buy signal and the opposite is a sell signal. As soon as it turns green blue without waiting for the sell signal, a sell signal is created. If you are trading fast, you can consider turning green to blue as an opportunity. In the long run, the red intersection can be interpreted as a Stop point.
I hope it will be useful to everyone.
You can also find the strategy indicator with the same name.
I got the name of this indicator from my daughter's name. The meaning of the name Yüsra means "convenience". I hope this indicator will help you.Yüsram Mount HO - Day HO
alGROWithm Premium - Strategy TesterThe alGROWithm Strategy Tester is a supplement to the original alGROWithm indicator.
Use this strategy to do your own back testing and find the best settings that work for your asset of choice.
█ WHY THIS IS IMPORTANT
Different assets require different settings for optimal results. This strategy script will allow you back test different settings for alGROWithm in order to analyze key metrics such as win rate and P/L. TradingView functionality also enables you to view a high level performance summary and even see every single individual trade made by the algo.
█ BEST PRACTICES
Depending on the asset you are testing, it is very important to update the settings as needed. For example, if you are back testing on US30, you will likely need to increase the starting capital. For other assets, you may also need to change the order size to use the Contracts option.
It is important to decide for yourself which back testing parameter you will weigh more heavily in terms of importance. For example, a day trader may want to use a setting that maximizes win rate rather than profit % since we are humans and not computers. Further, it is highly recommended to utilize all of the rich features that TradingView provides with regards to back testing. For example, using the List of Trades tab, go back to find a failed trade and analyze the trade to see if you actually would have taken it in the moment.
After finding the best sensitivity for your asset, it is important to set that sensitivity value on the non-strategy version of alGROWithm for usage. Changing settings on this version will not carry over to the non-strategy version.
█ DEFAULT SETTINGS
We have set the following default settings on the strategy:
Starting capital: $100k
Order size: 30% of equity
Sell 1/5 of position every Take Profit level

NZDJPY signal [DinhChienFX Corner] Ver 1.0The right screen is never predicting before. Just a the best result at the history for confident to using for Trade.
------------------------
Risk: 1%.
1. The Long signal is calculate by the Close of candle crossing up The Keltner Channel Upper.
2. The Short {Sell] signal is calculate by the Close of candle crossing down The Keltner Channel Lower.
3. Reset the Up/Down confirm at Entry.
4. Don''t entry when occurs the Reversal Candle (over 80% the Heigh of Keltner Channel).
a. Not filter the Candel is over 80%.
b. Filter the Candel is over 80% for Not Entry.
5. Stoploss and Take Profit is calculated by Plus or Minus from the Price Entry.
6. Report the result at Backtest:
a. The Long-term result:
b. The Mid-tern result (every year):
- From 1/1/2017 to 1/1/2018:
- From 1/1/2018 to 1/1/2019:
- From 1/1/2019 to 1/1/2020:
c. The Short-term result:
- From 1/1/2020 to 5 Sep 2020
---------------------------------------
The right screen is never predicting before. Just a the best result at the history for confident to using for Trade.
Thanks for watching .

EURUSD signal [DinhChienFX Corner] Ver 3.0* Signals are tested successfully for 3.5 years with a steady win rate year on year until now.
Risk: 1%.
* Backtest time: 3.5 years / Premium, varies between currency pairs (Cryto default backtest time is shorter since the market is open both Saturday and Sunday: about 2 years).
The price rule of EURUSD in 20,000 past H1 candles past:
- Upterm (Long): Buy
+ When the price crossing up (Crossover) the Upper line gives 1 point.
- Downterm (Short): Sell
+ When the price crossing down (Crossunder) the Lower line gives 1 point.
- 2 or more points (> = 2), the entry conditions are met
- The entry point for the highest winning rate: when the price adjusts to the Upper / Lower line, the order price is at the closing price of the adjustment candle.
- When the above conditions are met, the Indicator shows a Buy / Sell signal according to the trend.
-----------------------------------
- Maximum risk / reward winning ratio: 1 / 1.05
- Stoploss: Calculated from the entry point + - actual fluctuation with the formula ATR (20) * risk ratio (risk).
- Profit: Calculated from the entry point + - actual fluctuation by the formula ATR (20) * reward ratio (reward).
- Profit: So the product has a stable profit of over 30% / year.
- Should backtest 3 Years (long term), every Year (medium term) and quarterly or 6 months (short term). If each year the success rate is always over 50%, it can be used for real trade.
