Tristan's Devil Mark (Short / Long, with W%R)The Devil’s Mark indicator is a visual tool designed to help traders identify potential short and long opportunities based on candle structure and market momentum. It combines price action analysis with the Williams %R (W%R) oscillator to highlight candles with high potential for reversal or continuation.
Can be used on any timeline, from scalping day trades to swing trades on daily and higher timelines. Know that the higher the timeline the less likely the indicator will show. (Asia and London sessions tend to show many indicators. I find this more useful for NY session.)
How the script works
Candle Structure Conditions
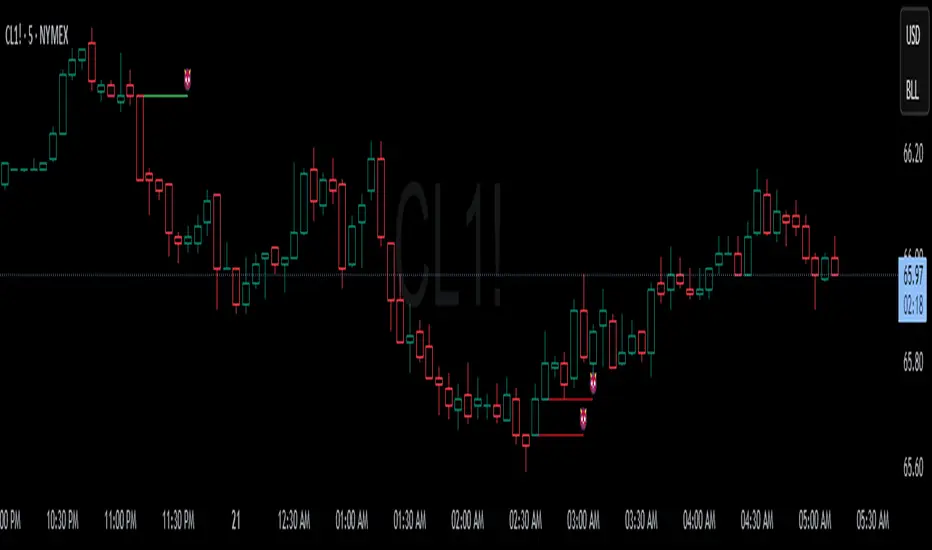
Short (Sell) Wedge: Plotted above green candles that have no bottom wick, indicating that inside that candle there was strong upward momentum without downside hesitation .
Long (Buy) Wedge: Plotted below red candles that have no top wick, indicating that inside that candle there was strong downward momentum without upside hesitation .
These candles are visually emphasized as wedges to mark potential turning points.
Williams %R Filter
The indicator uses Williams %R to measure overbought and oversold conditions:
Proximity to 0 (nearZeroThresh): Determines how close W%R must be to 0 (overbought) to trigger a Sell Wedge. This acts as a “Sell sensitivity” filter.
Proximity to -100 (nearHundredThresh): Determines how close W%R must be to -100 (oversold) to trigger a Buy Wedge. This acts as a “Buy sensitivity” filter.
When the candle meets both the candle structure and the W%R condition, the wedge is plotted in purple (“Within W%R Range”).
When the "ignore W%R filter" toggle is on, all eligible candles are plotted regardless of W%R. Wedges that normally would not meet W%R criteria are plotted in light purple (“Outside W%R Range”) to distinguish them. #YOLO (🚫 I recommend leaving "Ignore W%R Filter" OFF)
Settings Explained
Williams %R Length: The number of bars used to calculate the W%R oscillator. Shorter lengths make it more sensitive; longer lengths smooth the readings.
Proximity to 0 / 100: Controls how “strict” the indicator is in requiring overbought or oversold W%R conditions to trigger. Lower values mean closer to extreme zones, higher values are more permissive.
Ignore W%R Toggle: Option to show Devil’s Marks on every eligible candle regardless of W%R. Useful for visualizing purely price-action-based signals.
What the trader sees
Purple wedges: Candles meeting both candle structure and W%R conditions.
Light purple wedges: Candles meeting candle structure but ignored W%R (when toggle is on). #YOLO (🚫 I recommend leaving "Ignore W%R Filter" OFF)
Short opportunities are wedges above bars (green candles with no bottom wick).
Long opportunities are wedges below bars (red candles with no top wick).
Trading Insight
The Devil’s Mark is a momentum and reversal alert tool:
Look for purple downward-pointing wedges when W%R is near overbought. This is a potential shorting opportunity. Buying at the close of that candle may improve your short trades.
Look for purple upward-pointing wedges when W%R is near oversold. This is a potential
long opportunity. Buying at the close of that candle may improve your long trades.
Light purple wedges show the same price-action cues without W%R confirmation—useful for aggressive traders who want every potential setup. #YOLO #YMMV #noFullPort
Settings / Security
The “Output values” checkbox appears for each plotted series (like a plot or plotshape) and controls whether the series will also be exposed numerically in the Data Window or used by other indicators/scripts.
Here’s what it means in practice:
1. Checked (true)
The series values (like candle high, low, or any computed value) are exported to the Data Window and can be read by other scripts using request.security() or ta functions.
Example: You can see the exact numerical value of each plotted point in the Data Window when you hover over the chart.
Useful if you want to backtest or reference these plotted values programmatically.
2. Unchecked (false)
The series is plotted visually only.
The numeric values are hidden from the Data Window and cannot be accessed by other scripts.
Makes the chart cleaner if you don’t need the numeric outputs.
Devilsmark

Devils MarkThe Devil’s Mark Indicator identifies bullish or bearish candlesticks with no opposing wick, plotting a horizontal line at the open/low (bullish) or open/high (bearish) price to mark the inefficiency.
This line highlights the level where price is expected to retrace to form the missing wick, serving as a visual cue.
The line is automatically removed from the chart once price crosses it, confirming the inefficiency has been rebalanced.