TickerLibLibrary "TickerLib"
Ticker Library
exists(tickerId)
Test if a tickerId exists
Parameters:
tickerId (string)
Returns: (bool)
notExist(tickerId)
Test if a tickerId do not exists
Parameters:
tickerId (string)
Returns: (bool)
getExchange(tickerId)
Pass a tickerId return the exchange
Parameters:
tickerId (string)
Returns: (string) exchange
isPerp(tickerId)
Test if tickerId is a perps pair
Parameters:
tickerId (string)
Returns: (bool)
isNotPerp(tickerId)
Test if tickerId is not a perps pair
Parameters:
tickerId (string)
Returns: (bool)
getPair(tickerId)
Pass a tickerId return the pair without exchange
Parameters:
tickerId (string)
Returns: (string) the pair
getSpotPair(tickerId)
Pass a tickerId return the pair without exchange and perps
Parameters:
tickerId (string)
Returns: (string) the pair
Display
Casa_TableLibrary "Casa_Table"
A powerful library for creating customizable tables from data arrays and matrices.
Features flexible formatting options including:
- Multiple function implementations for different levels of control
- Consistent column counts required across matrix rows
- Matching dimensions needed for color arrays/matrices
- Cell spanning capabilities across rows/columns
- Rich examples demonstrating proper data structure setup
The library makes it easy to transform your data into professional-looking
tables while maintaining full control over their visual appearance.
floatArrayToCellArray(floatArray)
Helper function that converts a float array to a Cell array so it can be rendered with the fromArray function
Parameters:
floatArray (array) : (array) the float array to convert to a Cell array.
Returns: array The Cell array to return.
stringArrayToCellArray(stringArray)
Helper function that converts a string array to a Cell array so it can be rendered with the fromArray function
Parameters:
stringArray (array) : (array) the array to convert to a Cell array.
Returns: array The Cell array to return.
floatMatrixToCellMatrix(floatMatrix)
Helper function that converts a float matrix to a Cell matrix so it can be rendered with the fromMatrix function
Parameters:
floatMatrix (matrix) : (matrix) the float matrix to convert to a string matrix.
Returns: matrix The Cell matrix to render.
stringMatrixToCellMatrix(stringMatrix)
Helper function that converts a string matrix to a Cell matrix so it can be rendered with the fromMatrix function
Parameters:
stringMatrix (matrix) : (matrix) the string matrix to convert to a Cell matrix.
Returns: matrix The Cell matrix to return.
fromMatrix(CellMatrix, position, verticalOffset, transposeTable, textSize, borderWidth, tableNumRows, blankCellText)
Takes a CellMatrix and renders it as a table.
Parameters:
CellMatrix (matrix) : (matrix) The Cells to be rendered in a table
position (string) : (string) Optional. The position of the table. Defaults to position.top_right
verticalOffset (int) : (int) Optional. The vertical offset of the table from the top or bottom of the chart. Defaults to 0.
transposeTable (bool) : (bool) Optional. Will transpose all of the data in the matrices before rendering. Defaults to false.
textSize (string) : (string) Optional. The size of text to render in the table. Defaults to size.small.
borderWidth (int) : (int) Optional. The width of the border between table cells. Defaults to 2.
tableNumRows (int) : (int) Optional. The number of rows in the table. Not required, defaults to the number of rows in the provided matrix. If your matrix will have a variable number of rows, you must provide the max number of rows or the function will error when it attempts to set a cell value on a row that the table hadn't accounted for when it was defined.
blankCellText (string) : (string) Optional. Text to use cells when adding blank rows for vertical offsetting.
fromMatrix(dataMatrix, position, verticalOffset, transposeTable, textSize, borderWidth, tableNumRows, blankCellText)
Renders a float matrix as a table.
Parameters:
dataMatrix (matrix) : (matrix_float) The data to be rendered in a table
position (string) : (string) Optional. The position of the table. Defaults to position.top_right
verticalOffset (int) : (int) Optional. The vertical offset of the table from the top or bottom of the chart. Defaults to 0.
transposeTable (bool) : (bool) Optional. Will transpose all of the data in the matrices before rendering. Defaults to false.
textSize (string) : (string) Optional. The size of text to render in the table. Defaults to size.small.
borderWidth (int) : (int) Optional. The width of the border between table cells. Defaults to 2.
tableNumRows (int) : (int) Optional. The number of rows in the table. Not required, defaults to the number of rows in the provided matrix. If your matrix will have a variable number of rows, you must provide the max number of rows or the function will error when it attempts to set a cell value on a row that the table hadn't accounted for when it was defined.
blankCellText (string) : (string) Optional. Text to use cells when adding blank rows for vertical offsetting.
fromMatrix(dataMatrix, position, verticalOffset, transposeTable, textSize, borderWidth, tableNumRows, blankCellText)
Renders a string matrix as a table.
Parameters:
dataMatrix (matrix) : (matrix_string) The data to be rendered in a table
position (string) : (string) Optional. The position of the table. Defaults to position.top_right
verticalOffset (int) : (int) Optional. The vertical offset of the table from the top or bottom of the chart. Defaults to 0.
transposeTable (bool) : (bool) Optional. Will transpose all of the data in the matrices before rendering. Defaults to false.
textSize (string) : (string) Optional. The size of text to render in the table. Defaults to size.small.
borderWidth (int) : (int) Optional. The width of the border between table cells. Defaults to 2.
tableNumRows (int) : (int) Optional. The number of rows in the table. Not required, defaults to the number of rows in the provided matrix. If your matrix will have a variable number of rows, you must provide the max number of rows or the function will error when it attempts to set a cell value on a row that the table hadn't accounted for when it was defined.
blankCellText (string) : (string) Optional. Text to use cells when adding blank rows for vertical offsetting.
fromArray(dataArray, position, verticalOffset, transposeTable, textSize, borderWidth, blankCellText)
Renders a Cell array as a table.
Parameters:
dataArray (array) : (array) The data to be rendered in a table
position (string) : (string) Optional. The position of the table. Defaults to position.top_right
verticalOffset (int) : (int) Optional. The vertical offset of the table from the top or bottom of the chart. Defaults to 0.
transposeTable (bool) : (bool) Optional. Will transpose all of the data in the matrices before rendering. Defaults to false.
textSize (string) : (string) Optional. The size of text to render in the table. Defaults to size.small.
borderWidth (int) : (int) Optional. The width of the border between table cells. Defaults to 2.
blankCellText (string) : (string) Optional. Text to use cells when adding blank rows for vertical offsetting.
fromArray(dataArray, position, verticalOffset, transposeTable, textSize, borderWidth, blankCellText)
Renders a string array as a table.
Parameters:
dataArray (array) : (array_string) The data to be rendered in a table
position (string) : (string) Optional. The position of the table. Defaults to position.top_right
verticalOffset (int) : (int) Optional. The vertical offset of the table from the top or bottom of the chart. Defaults to 0.
transposeTable (bool) : (bool) Optional. Will transpose all of the data in the matrices before rendering. Defaults to false.
textSize (string) : (string) Optional. The size of text to render in the table. Defaults to size.small.
borderWidth (int) : (int) Optional. The width of the border between table cells. Defaults to 2.
blankCellText (string) : (string) Optional. Text to use cells when adding blank rows for vertical offsetting.
fromArray(dataArray, position, verticalOffset, transposeTable, textSize, borderWidth, blankCellText)
Renders a float array as a table.
Parameters:
dataArray (array) : (array_float) The data to be rendered in a table
position (string) : (string) Optional. The position of the table. Defaults to position.top_right
verticalOffset (int) : (int) Optional. The vertical offset of the table from the top or bottom of the chart. Defaults to 0.
transposeTable (bool) : (bool) Optional. Will transpose all of the data in the matrices before rendering. Defaults to false.
textSize (string) : (string) Optional. The size of text to render in the table. Defaults to size.small.
borderWidth (int) : (int) Optional. The width of the border between table cells. Defaults to 2.
blankCellText (string) : (string) Optional. Text to use cells when adding blank rows for vertical offsetting.
debug(message, position)
Renders a debug message in a table at the desired location on screen.
Parameters:
message (string) : (string) The message to render.
position (string) : (string) Optional. The position of the debug message. Defaults to position.middle_right.
Cell
Type for each cell's content and appearance
Fields:
content (series string)
bgColor (series color)
textColor (series color)
align (series string)
colspan (series int)
rowspan (series int)

Casa_UtilsLibrary "Casa_Utils"
A collection of convenience and helper functions for indicator and library authors on TradingView
formatNumber(num)
My version of format number that doesn't have so many decimal places...
Parameters:
num (float) : The number to be formatted
Returns: The formatted number
getDateString(timestamp)
Convenience function returns timestamp in yyyy/MM/dd format.
Parameters:
timestamp (int) : The timestamp to stringify
Returns: The date string
getDateTimeString(timestamp)
Convenience function returns timestamp in yyyy/MM/dd hh:mm format.
Parameters:
timestamp (int) : The timestamp to stringify
Returns: The date string
getInsideBarCount()
Gets the number of inside bars for the current chart. Can also be passed to request.security to get the same for different timeframes.
Returns: The # of inside bars on the chart right now.
getLabelStyleFromString(styleString, acceptGivenIfNoMatch)
Tradingview doesn't give you a nice way to put the label styles into a dropdown for configuration settings. So, I specify them in the following format: "Center", "Left", "Lower Left", "Lower Right", "Right", "Up", "Upper Left", "Upper Right", "Plain Text", "No Labels". This function takes care of converting those custom strings back to the ones expected by tradingview scripts.
Parameters:
styleString (string)
acceptGivenIfNoMatch (bool) : If no match for styleString is found and this is true, the function will return styleString, otherwise it will return tradingview's preferred default
Returns: The string expected by tradingview functions
getTime(hourNumber, minuteNumber)
Given an hour number and minute number, adds them together and returns the sum. To be used by getLevelBetweenTimes when fetching specific price levels during a time window on the day.
Parameters:
hourNumber (int) : The hour number
minuteNumber (int) : The minute number
Returns: The sum of all the minutes
getHighAndLowBetweenTimes(start, end)
Given a start and end time, returns the high or low price during that time window.
Parameters:
start (int) : The timestamp to start with (# of seconds)
end (int) : The timestamp to end with (# of seconds)
Returns: The high or low value
getPremarketHighsAndLows()
Returns an expression that can be used by request.security to fetch the premarket high & low levels in a tuple.
Returns: (tuple)
getAfterHoursHighsAndLows()
Returns an expression that can be used by request.security to fetch the after hours high & low levels in a tuple.
Returns: (tuple)
getOvernightHighsAndLows()
Returns an expression that can be used by request.security to fetch the overnight high & low levels in a tuple.
Returns: (tuple)
getNonRthHighsAndLows()
Returns an expression that can be used by request.security to fetch the high & low levels for premarket, after hours and overnight in a tuple.
Returns: (tuple)
getLineStyleFromString(styleString, acceptGivenIfNoMatch)
Tradingview doesn't give you a nice way to put the line styles into a dropdown for configuration settings. So, I specify them in the following format: "Solid", "Dashed", "Dotted", "None/Hidden". This function takes care of converting those custom strings back to the ones expected by tradingview scripts.
Parameters:
styleString (string) : Plain english (or TV Standard) version of the style string
acceptGivenIfNoMatch (bool) : If no match for styleString is found and this is true, the function will return styleString, otherwise it will return tradingview's preferred default
Returns: The string expected by tradingview functions
getPercentFromPrice(price)
Get the % the current price is away from the given price.
Parameters:
price (float)
Returns: The % the current price is away from the given price.
getPositionFromString(position)
Tradingview doesn't give you a nice way to put the positions into a dropdown for configuration settings. So, I specify them in the following format: "Top Left", "Top Center", "Top Right", "Middle Left", "Middle Center", "Middle Right", "Bottom Left", "Bottom Center", "Bottom Right". This function takes care of converting those custom strings back to the ones expected by tradingview scripts.
Parameters:
position (string) : Plain english position string
Returns: The string expected by tradingview functions
getRsiAvgsExpression(rsiLength)
Call request.security with this as the expression to get the average up/down values that can be used with getRsiPrice (below) to calculate the price level where the supplied RSI level would be reached.
Parameters:
rsiLength (simple int) : The length of the RSI requested.
Returns: A tuple containing the avgUp and avgDown values required by the getRsiPrice function.
getRsiPrice(rsiLevel, rsiLength, avgUp, avgDown)
use the values returned by getRsiAvgsExpression() to calculate the price level when the provided RSI level would be reached.
Parameters:
rsiLevel (float) : The RSI level to find price at.
rsiLength (int) : The length of the RSI to calculate.
avgUp (float) : The average move up of RSI.
avgDown (float) : The average move down of RSI.
Returns: The price level where the provided RSI level would be met.
getSizeFromString(sizeString)
Tradingview doesn't give you a nice way to put the sizes into a dropdown for configuration settings. So, I specify them in the following format: "Auto", "Huge", "Large", "Normal", "Small", "Tiny". This function takes care of converting those custom strings back to the ones expected by tradingview scripts.
Parameters:
sizeString (string) : Plain english size string
Returns: The string expected by tradingview functions
getTimeframeOfChart()
Get the timeframe of the current chart for display
Returns: The string of the current chart timeframe
getTimeNowPlusOffset(candleOffset)
Helper function for drawings that use xloc.bar_time to help you know the time offset if you want to place the end of the drawing out into the future. This determines the time-size of one candle and then returns a time n candleOffsets into the future.
Parameters:
candleOffset (int) : The number of items to find singular/plural for.
Returns: The future time
getVolumeBetweenTimes(start, end)
Given a start and end time, returns the sum of all volume across bars during that time window.
Parameters:
start (int) : The timestamp to start with (# of seconds)
end (int) : The timestamp to end with (# of seconds)
Returns: The volume
isToday()
Returns true if the current bar occurs on today's date.
Returns: True if current bar is today
padLabelString(labelText, labelStyle)
Pads a label string so that it appears properly in or not in a label. When label.style_none is used, this will make sure it is left-aligned instead of center-aligned. When any other type is used, it adds a single space to the right so there is padding against the right end of the label.
Parameters:
labelText (string) : The string to be padded
labelStyle (string) : The style of the label being padded for.
Returns: The padded string
plural(num, singular, plural)
Helps format a string for plural/singular. By default, if you only provide num, it will just return "s" for plural and nothing for singular (eg. plural(numberOfCats)). But you can optionally specify the full singular/plural words for more complicated nomenclature (eg. plural(numberOfBenches, 'bench', 'benches'))
Parameters:
num (int) : The number of items to find singular/plural for.
singular (string) : The string to return if num is singular. Defaults to an empty string.
plural (string) : The string to return if num is plural. Defaults to 's' so you can just add 's' to the end of a word.
Returns: The singular or plural provided strings depending on the num provided.
timeframeInSeconds(timeframe)
Get the # of seconds in a given timeframe. Tradingview's timeframe.in_seconds() expects a simple string, and we often need to use series string, so this is an alternative to get you the value you need.
Parameters:
timeframe (string)
Returns: The number of secondsof that timeframe
timeframeOfChart()
Convert a timeframe string to a consistent standard.
Returns: The standard format for the string, or the unchanged value if it is unknown.
timeframeToString(timeframe)
Convert a timeframe string to a consistent standard.
Parameters:
timeframe (string)
Returns: (string) The standard format for the string, or the unchanged value if it is unknown.
stringToTimeframe(strTimeframe)
Convert an english-friendly timeframe string to a value that can be used by request.security. Specifically, this corrects hour strings (eg. 4h) to their numeric "minute" equivalent (eg. 240)
Parameters:
strTimeframe (string)
Returns: (string) The standard format for the string, or the unchanged value if it is unknown.
getPriceLabel(price, labelOffset, labelStyle, labelSize, labelColor, textColor)
Defines a label for the end of a price level line.
Parameters:
price (float) : The price level to render the label at.
labelOffset (int) : The number of candles to place the label to the right of price.
labelStyle (string) : A plain english string as defined in getLabelStyleFromString.
labelSize (string) : The size of the label.
labelColor (color) : The color of the label.
textColor (color) : The color of the label text (defaults to #ffffff)
Returns: The label that was created.
setPriceLabel(label, labelName, price, labelOffset, labelTemplate, labelStyle, labelColor, textColor)
Updates the label position & text based on price changes.
Parameters:
label (label) : The label to update.
labelName (string) : The name of the price level to be placed on the label.
price (float) : The price level to render the label at.
labelOffset (int) : The number of candles to place the label to the right of price.
labelTemplate (string) : The str.format template to use for the label. Defaults to: '{0}: {1} {2}{3,number,#.##}%' which means '{price}: {labelName} {+/-}{percentFromPrice}%'
labelStyle (string)
labelColor (color)
textColor (color)
getPriceLabelLine(price, labelOffset, labelColor, lineWidth)
Defines a line that will stretch from the plot line to the label.
Parameters:
price (float) : The price level to render the label at.
labelOffset (int) : The number of candles to place the label to the right of price.
labelColor (color)
lineWidth (int) : The width of the line. Defaults to 1.
setPriceLabelLine(line, price, labelOffset, lastTime, lineColor)
Updates the price label line based on price changes.
Parameters:
line (line) : The line to update.
price (float) : The price level to render the label at.
labelOffset (int) : The number of candles to place the label to the right of price.
lastTime (int) : The last time that the line should stretch from. Defaults to time.
lineColor (color)

DrawIndicatorOnTheChartLibrary "DrawIndicatorOnTheChart"
this library is used to show an indicator (such RSI, CCI, MOM etc) on the main chart with indicator's horizontal lines in a window. Location of the window is calculated dynamically by last price movemements
drawIndicator(enabled, indicatorName, indicator1, indicator2, indicator3, indicatorcolors, period, indimax_, indimin_, levels, precision, xlocation, lnwidth)
draws the realted indicator on the chart
Parameters:
enabled (bool) : if it's enabled to show
indicatorName (string) : is the indicator name as string such "RSI", "CCI" etc
indicator1 (float) : is first indicator you want to show, such rsi(close, 14), mom(close, 10) etc
indicator2 (float) : is second indicator you want to show, such -DI of DMI
indicator3 (float) : is third indicator you want to show, such ADX of DMI
indicatorcolors (array)
period (int) : is the length of the window to show
indimax_ (float) : is the maximum value of the indicator, for example for RSI it's 100.0, if the indicator (such CCI, MOM etc) doesn't have maximum value then use "na"
indimin_ (float) : is the minimum value of the indicator, for example for RSI it's 0.0, if the indicator (such CCI, MOM etc)doesn't have maximum value then use "na"
levels (array) : is the levels of the array for the horizontal lines. for example if you want horizontal lines at 30.0, and 70.0 then use array.from(30.0, 70.0). if no horizontal lines then use array.from(na)
precision (int) : is the precision/nuber of decimals that is used to show indicator values, for example for RSI set it 2
xlocation (int) : is end location of the indicator window, for example if xlocation = 0 window is created on the index of the last bar/candle
lnwidth (int) : is the line width of the indicator lines
Returns: none

UtilityLibraryLibrary "UtilityLibrary"
A collection of custom utility functions used in my scripts.
milliseconds_per_bar()
Gets the number of milliseconds per bar.
Returns: (int) The number of milliseconds per bar.
realtime()
Checks if the current bar is the actual realtime bar.
Returns: (bool) `true` when the current bar is the actual realtime bar, `false` otherwise.
replay()
Checks if the current bar is the last replay bar.
Returns: (bool) `true` when the current bar is the last replay bar, `false` otherwise.
bar_elapsed()
Checks how much of the current bar has elapsed.
Returns: (float) Between 0 and 1.
even(number)
Checks if a number is even.
Parameters:
number (float) : (float) The number to evaluate.
Returns: (bool) `true` when the number is even, `false` when the number is odd.
sign(number)
Gets the sign of a float.
Parameters:
number (float) : (float) The number to evaluate.
Returns: (int) 1 or -1, unlike math.sign() which returns 0 if the number is 0.
atan2(y, x)
Derives an angle in radians from the XY coordinate.
Parameters:
y (float) : (float) Y coordinate.
x (float) : (float) X coordinate.
Returns: (float) Between -π and π.
clamp(number, min, max)
Ensures a value is between the `min` and `max` thresholds.
Parameters:
number (float) : (float) The number to clamp.
min (float) : (float) The minimum threshold (0 by default).
max (float) : (float) The maximum threshold (1 by default).
Returns: (float) Between `min` and `max`.
remove_gamma(value)
Removes gamma from normalized sRGB channel values.
Parameters:
value (float) : (float) The normalized channel value .
Returns: (float) Channel value with gamma removed.
add_gama(value)
Adds gamma into normalized linear RGB channel values.
Parameters:
value (float) : (float) The normalized channel value .
Returns: (float) Channel value with gamma added.
rgb_to_xyz(Color)
Extracts XYZ-D65 channels from sRGB colors.
Parameters:
Color (color) : (color) The sRGB color to process.
Returns: (float tuple)
xyz_to_rgb(x, y, z)
Converts XYZ-D65 channels to sRGB channels.
Parameters:
x (float) : (float) The X channel value.
y (float) : (float) The Y channel value.
z (float) : (float) The Z channel value.
Returns: (int tuple)
rgb_to_oklab(Color)
Extracts OKLAB-D65 channels from sRGB colors.
Parameters:
Color (color) : (color) The sRGB color to process.
Returns: (float tuple)
oklab_to_rgb(l, a, b)
Converts OKLAB-D65 channels to sRGB channels.
Parameters:
l (float) : (float) The L channel value.
a (float) : (float) The A channel value.
b (float) : (float) The B channel value.
Returns: (int tuple)
rgb_to_oklch(Color)
Extracts OKLCH channels from sRGB colors.
Parameters:
Color (color) : (color) The sRGB color to process.
Returns: (float tuple)
oklch_to_rgb(l, c, h)
Converts OKLCH channels to sRGB channels.
Parameters:
l (float) : (float) The L channel value.
c (float) : (float) The C channel value.
h (float) : (float) The H channel value.
Returns: (float tuple)
hues(l1, h1, l2, h2, dist)
Ensures the hue angles are set correctly for linearly interpolating OKLCH.
Parameters:
l1 (float) : (float) The first L channel value.
h1 (float) : (float) The first H channel value.
l2 (float) : (float) The second L channel value.
h2 (float) : (float) The second H channel value.
dist (string) : (string) The preferred angular distance to use. Options: `min` or `max` (`min` by default).
Returns: (float tuple)
lerp(a, b, t)
Linearly interpolates between two values.
Parameters:
a (float) : (float) The starting point (first value).
b (float) : (float) The ending point (second value).
t (float) : (float) The interpolation factor .
Returns: (float) Between `a` and `b`.
smoothstep(t, precise)
A non-linear (smooth) interpolation between 0 and 1.
Parameters:
t (float) : (float) The interpolation factor .
precise (bool) : (bool) Sets if the calc should be precise or efficient (`true` by default).
Returns: (float) Between 0 and 1.
ease(t, n, v, x1, y1, x2, y2)
A customizable non-linear interpolation between 0 and 1.
Parameters:
t (float) : (float) The interpolation factor .
n (float) : (float) The degree of ease (1 by default).
v (string) : (string) The easing variant type: `in-out`, `in`, or `out` (`in-out` by default).
x1 (float) : (float) Optional X coordinate of starting point (0 by default).
y1 (float) : (float) Optional Y coordinate of starting point (0 by default).
x2 (float) : (float) Optional X coordinate of ending point (1 by default).
y2 (float) : (float) Optional Y coordinate of ending point (1 by default).
Returns: (float) Between 0 and 1.
mix(color1, color2, blend, space, dist)
Linearly interpolates between two colors.
Parameters:
color1 (color) : (color) The first color.
color2 (color) : (color) The second color.
blend (float) : (float) The interpolation factor .
space (string) : (string) The color space to use for interpolating. Options: `rgb`, `oklab`, and `oklch` (`rgb` by default).
dist (string) : (string) The anglular distance to use for the hue change when the color space is set to `oklch`. Options: `min` and `max` (`min` by default).
Returns: (color) Blend of `color1` and `color2`.

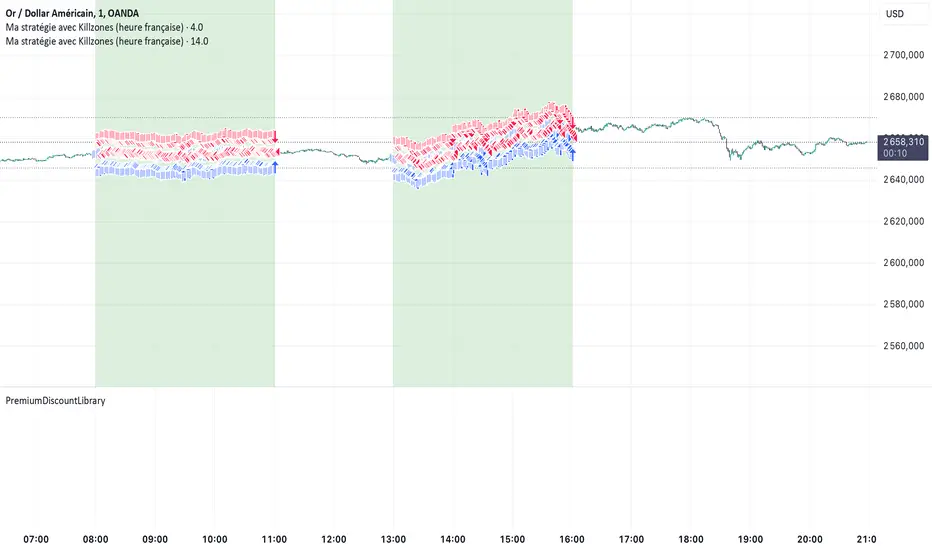
PremiumDiscountLibraryLibrary "PremiumDiscountLibrary"
isInZone(currentTime, price, trend, tz)
Vérifie si le prix est en zone premium ou discount
Parameters:
currentTime (int) : L'heure actuelle (timestamp)
price (float) : Le prix actuel
trend (string) : La tendance ("bullish" ou "bearish")
tz (string) : Le fuseau horaire pour calculer les sessions (par défaut : "GMT+1")
Returns: true si le prix est dans la zone correcte, sinon false
Milvetti_TraderPost_LibraryLibrary "Milvetti_TraderPost_Library"
This library has methods that provide practical signal transmission for traderpost.Developed By Milvetti
cancelOrders(symbol)
This method generates a signal in JSON format that cancels all orders for the specified pair. (If you want to cancel stop loss and takeprofit orders together, use the “exitOrder” method.
Parameters:
symbol (string)
exitOrders(symbol)
This method generates a signal in JSON format that close all orders for the specified pair.
Parameters:
symbol (string)
createOrder(ticker, positionType, orderType, entryPrice, signalPrice, qtyType, qty, stopLoss, stopType, stopValue, takeProfit, profitType, profitValue, timeInForce)
This function is designed to send buy or sell orders to traderpost. It can create customized orders by flexibly specifying parameters such as order type, position type, entry price, quantity calculation method, stop-loss, and take-profit. The purpose of the function is to consolidate all necessary details for opening a position into a single structure and present it as a structured JSON output. This format can be sent to trading platforms via webhooks.
Parameters:
ticker (string) : The ticker symbol of the instrument. Default value is the current chart's ticker (syminfo.ticker).
positionType (string) : Determines the type of order (e.g., "long" or "buy" for buying and "short" or "sell" for selling).
orderType (string) : Defines the order type for execution. Options: "market", "limit", "stop". Default is "market"
entryPrice (float) : The price level for entry orders. Only applicable for limit or stop orders. Default is 0 (market orders ignore this).
signalPrice (float) : Optional. Only necessary when using relative take profit or stop losses, and the broker does not support fetching quotes to perform the calculation. Default is 0
qtyType (string) : Determines how the order quantity is calculated. Options: "fixed_quantity", "dollar_amount", "percent_of_equity", "percent_of_position".
qty (float) : Quantity value. Can represent units of shares/contracts or a dollar amount, depending on qtyType.
stopLoss (bool) : Enable or disable stop-loss functionality. Set to `true` to activate.
stopType (string) : Specifies the stop-loss calculation type. Options: percent, "amount", "stopPrice", "trailPercent", "trailAmount". Default is "stopPrice"
stopValue (float) : Stop-loss value based on stopType. Can be a percentage, dollar amount, or a specific stop price. Default is "stopPrice"
takeProfit (bool) : Enable or disable take-profit functionality. Set to `true` to activate.
profitType (string) : Specifies the take-profit calculation type. Options: "percent", "amount", "limitPrice". Default is "limitPrice"
profitValue (float) : Take-profit value based on profitType. Can be a percentage, dollar amount, or a specific limit price. Default is 0
timeInForce (string) : The time in force for your order. Options: day, gtc, opg, cls, ioc and fok
Returns: Return result in Json format.
addTsl(symbol, stopType, stopValue, price)
This method adds trailing stop loss to the current position. “Price” is the trailing stop loss starting level. You can leave price blank if you want it to start immediately
Parameters:
symbol (string)
stopType (string) : Specifies the trailing stoploss calculation type. Options: "trailPercent", "trailAmount".
stopValue (float) : Stop-loss value based on stopType. Can be a percentage, dollar amount.
price (float) : The trailing stop loss starting level. You can leave price blank if you want it to start immediately. Default is current price.

ManipulationLegHelperLibraryLibrary "ManipulationLegHelperLibrary"
TODO: add library description here
devToArray(dev)
Parameters:
dev (string)
getDev(d, bull, h, l)
Parameters:
d (float)
bull (bool)
h (float)
l (float)
getBearLeg(sweeps, minLegSize, drawLegBox, boxColor)
Parameters:
sweeps (int)
minLegSize (float)
drawLegBox (bool)
boxColor (color)
getBullLeg(sweeps, minSize, drawBox, boxColor)
Parameters:
sweeps (int)
minSize (float)
drawBox (bool)
boxColor (color)
leg
Fields:
time (series int)
low (series float)
high (series float)
edge (series bool)
edge_price (series float)
validated (series int)
sweeps (series int)
barC (series int)
bx (series box)
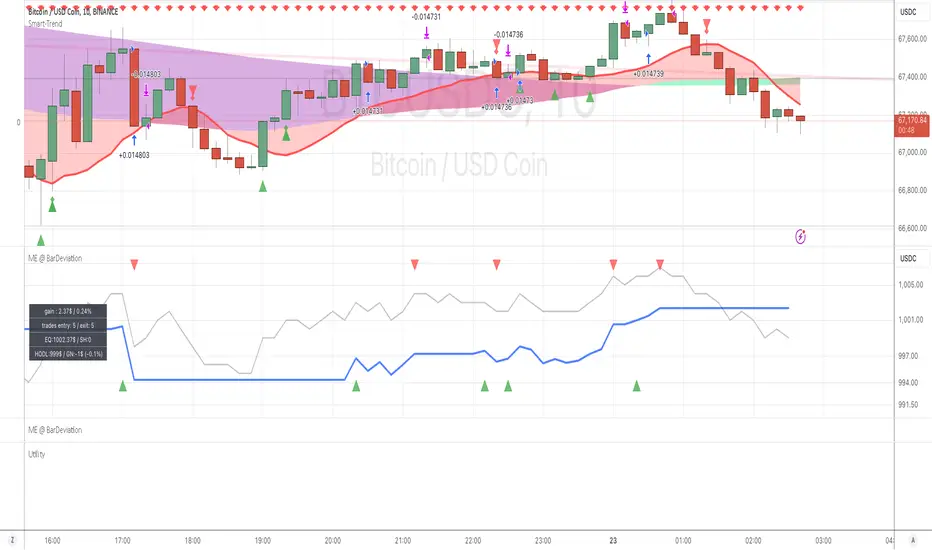
BacktestLibraryLibrary "BacktestLibrary"
A library providing functions for equity calculation and performance metrics.
since(date, active)
: Calculates the number of candles since a specified date.
Parameters:
date (simple float) : (simple float): The starting date in timestamp format (e.g., input.time(timestamp()))
active (simple bool) : (simple bool): If true, counts the number of candles since the date; if false, returns 0.
Returns: (int): The number of candles since the specified date.
buy_and_hold(r, startDate)
: Calculates the Buy and Hold Equity from a specified date.
Parameters:
r (float) : (series float): Daily returns of the asset (e.g., 0.02 for 2% move).
startDate (simple float) : (simple float): Timestamp of the starting date for the equity calculation.
Returns: (float): Buy and Hold Equity of the asset from the specified date.
equity(sig, threshold, r, startDate, signals)
: Calculates the strategy's equity on a candle-by-candle basis.
Parameters:
sig (float) : (series float): Signal values; positive for long, negative for short.
threshold (simple float) : (simple float): Signal threshold for entering trades.
r (float) : (series float): Daily returns of the asset (e.g., 0.02 for 2% move).
startDate (simple float) : (simple float): Timestamp of the starting date for the equity calculation.
signals (simple string) : (simple string): Type of signals to backtest ("Long & Short", "Long Only", "Short Only").
Returns: (float): Strategy equity on a candle-by-candle basis.
PerformanceMetrics(base, Lookback, startDate)
: Calculates performance metrics of a strategy from a specified date.
Parameters:
base (float) : (series float): Equity values of the strategy or Buy and Hold equity.
Lookback (int) : (series int): Number of periods since the start date; recommended to use the 'since' function.
startDate (simple float) : (simple float): Timestamp of the starting date for the equity calculation.
Returns: (float ): Array of performance metrics.
PerfMetricTable(buy_and_hold, strategy)
: Plots a table comparing performance metrics of Buy and Hold and Strategy equity.
Parameters:
buy_and_hold (array) : (float ): Metrics from the PerformanceMetrics() function for Buy and Hold.
strategy (array) : (float ): Metrics from the PerformanceMetrics() function for the strategy.
Returns: : Table displaying the performance metrics comparison.

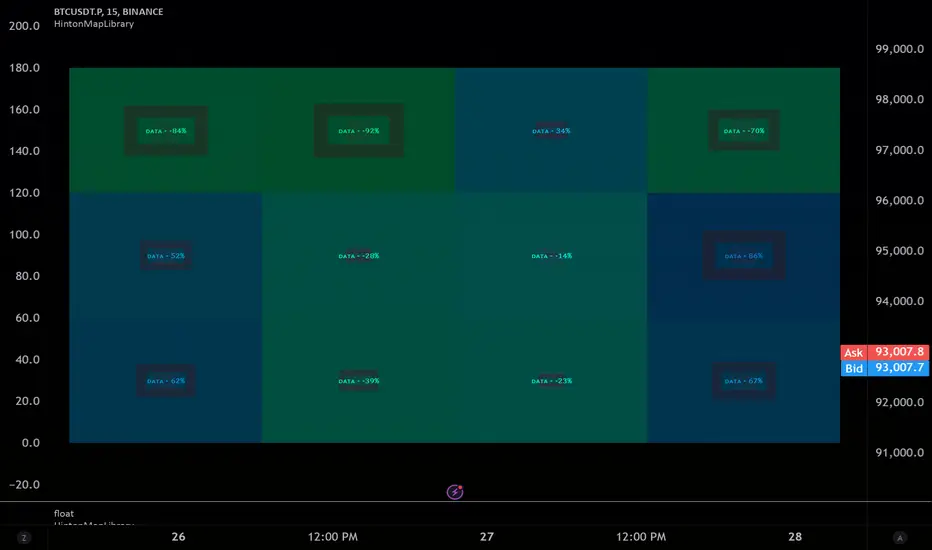
hinton_map█ HINTON MAP
This library provides functions to create and display a Hinton Map visualization. A Hinton map uses squares to represent the magnitude and direction of values in a matrix. This library allows you to display multiple ticker/timeframe/indicator combinations on a single chart, using color/boxsize/bnordersize to represent the values used. The values must be from -1.0 to 1.0 in value. 3 different values can be input per square.
Example Usage:
The example below demonstrates how to create a Hinton Map for two symbols (AAPL and MSFT) across three timeframes (1 minute, 5 minutes, and 1 day).
var hintonData = hinton_map.initHintonData(2, 3)
tickers = array.from("AAPL", "MSFT")
timeframes = array.from("1", "5", "1D")
for i = 0 to array.size(tickers) - 1
for j = 0 to array.size(timeframes) - 1
ticker = array.get(tickers, i)
timeframe = array.get(timeframes, j)
= request.security(ticker, timeframe, [close, close , ta.rsi(close, 14)], lookahead = barmerge.lookahead_on)
percent_change = (close_current - close_previous) / close_previous * 100
rsi_deviation = rsi_current - 50
hintonData.unitMatrix.set(i, j, hinton_map.createHintonUnit(
fillValue = percent_change,
borderValue = rsi_deviation,
innerValue = percent_change * rsi_deviation,
boxText = dv.from_string(str.tostring(math.round(percent_change, 2)) + "%"),
tooltipText = dv.from_string(syminfo.ticker + ", " + timeframe + ": " + str.tostring(math.round(percent_change, 2)) + "%, RSI: " + str.tostring(math.round(rsi_current, 2)))
))
hinton_map.drawHintonMap(hintonData)
█ createHintonUnit
Creates a Hinton unit.
• fillValue
Value to determine the fill color hue.
Type: float
Default Value: 0.0
• borderValue
Value to determine the border color hue and width.
Type: float
Default Value: 0.0
• innerValue
Value to determine the inner box color hue.
Type: float
Default Value: 0.0
• boxText
Text to display in the inner box.
Type: dv.DisplayValue
Default Value: na
• tooltipText
Tooltip text for the inner box.
Type: dv.DisplayValue
Default Value: na
Returns: HintonUnit
█ initHintonData
Initializes Hinton map data structure.
• rows
Number of rows.
Type: int
• columns
Number of columns.
Type: int
Returns: HintonData
█ drawHintonMap
Draws a Hinton map.
• hintonData
Hinton map data.
Type: HintonData
• unitSize
Size of each unit in bars.
Type: int
Default Value: 10
• borderWidth
Base width of the inner box border.
Type: int
Default Value: 5
• plusHue
Hue value for positive values (0-360).
Type: float
Default Value: 180
• minusHue
Hue value for negative values (0-360).
Type: float
Default Value: -30
█ HintonUnit
Data for a Hinton unit.
• fillValue
Value to determine the fill color hue.
Type: float
• borderValue
Value to determine the border color hue and width.
Type: float
• innerValue
Value to determine the inner box color hue.
Type: float
• boxText
Text to display in the inner box.
Type: dv.DisplayValue
• tooltipText
Tooltip text for the inner box.
Type: dv.DisplayValue
█ HintonData
Structure to store Hinton map data.
• unitMatrix
Matrix of Hinton units.
Type: matrix
• lineMatrix
Matrix of lines.
Type: matrix
• labelMatrix
Matrix of labels.
Type: matrix
• boxMatrix
Matrix of boxes.
Type: matrix
• fillMatrix
Matrix of line fills.
Type: matrix
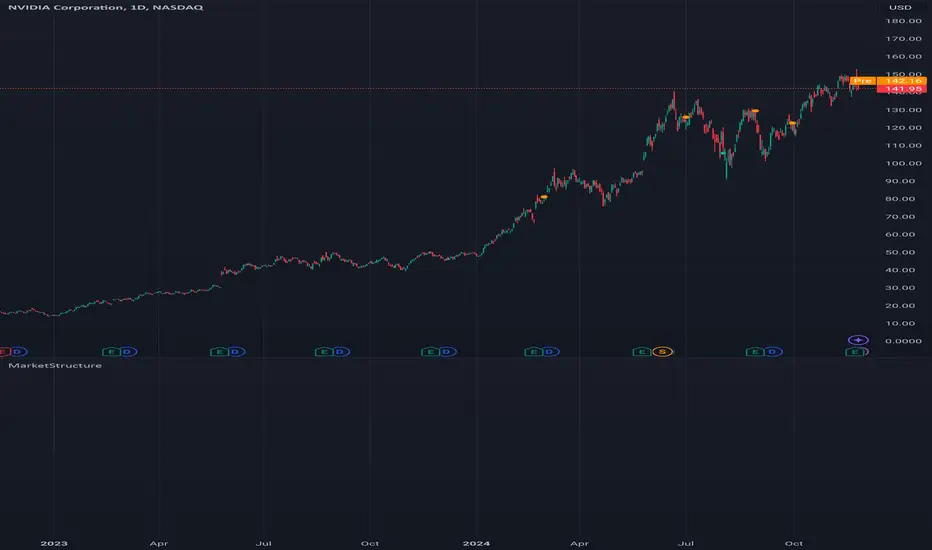
MarketStructureLibrary "MarketStructure"
Will draw out the market structure for the disired pivot length. The code is from my indicator "Marker structure" ().
Create(type, length, source, equalPivotsFactor, extendEqualPivotsZones, equalPivotsStyle, equalPivotsColor, alertFrequency)
Call on each bar. Will create a Structure object.
Parameters:
type (int) : the type of the Structure to create. 0 = internal, 1 = swing.
length (int) : The lenghts (left and right) for pivots to use.
source (string) : The source to be used for structural changes ('Close', 'High/low (aggresive)' (low in an uptrend) or 'High/low (passive)' (high in an uptrend)).
equalPivotsFactor (float) : Set how the limits are for an equal pivot. This is a factor of the Average True Length (ATR) of length 14. If a low pivot is considered to be equal if it doesn't break the low pivot (is at a lower value) and is inside the previous low pivot + this limit.
extendEqualPivotsZones (bool) : Set to true if you want the equal pivots zones to be extended.
equalPivotsStyle (string) : Set the style of equal pivot zones.
equalPivotsColor (color) : Set the color of equal pivot zones.
alertFrequency (string)
Returns: The 'structure' object.
Pivot(structure)
Sets the pivots in the structure.
Parameters:
structure (Structure)
Returns: The 'structure' object.
PivotLabels(structure)
Draws labels for the pivots found.
Parameters:
structure (Structure)
Returns: The 'structure' object.
EqualHighOrLow(structure)
Draws the boxsa for equal highs/lows. Also creates labels for the pivots included.
Parameters:
structure (Structure)
Returns: The 'structure' object.
BreakOfStructure(structure)
Will create lines when a break of strycture occures.
Parameters:
structure (Structure)
Returns: The 'structure' object.
ChangeOfCharacter(structure)
Will create lines when a change of character occures.
Parameters:
structure (Structure)
Returns: The 'structure' object.
StructureBreak
Holds drawings for a structure break.
Fields:
Line (series line) : The line object.
Label (series label) : The label object.
Pivot
Holds all the values for a found pivot.
Fields:
Price (series float) : The price of the pivot.
BarIndex (series int) : The bar_index where the pivot occured.
Type (series int) : The type of the pivot (-1 = low, 1 = high).
ChangeOfCharacterBroken (series bool) : Sets to true if a change of character has happened.
BreakOfStructureBroken (series bool) : Sets to true if a break of structure has happened.
Structure
Holds all the values for the market structure.
Fields:
Length (series int) : Define the left and right lengths of the pivots used.
Type (series int) : Set the type of the market structure. Two types can be used, 'internal' and 'swing' (0 = internal, 1 = swing).
Trend (series int) : This will be set internally and can be -1 = downtrend, 1 = uptrend.
Source (series string) : Set the source for structural chandeg. Can be 'Close', 'High/low (aggresive)' (low in an uptrend) or 'High/low (passive)' (high in an uptrend).
EqualPivotsFactor (series float) : Set how the limits are for an equal pivot. This is a factor of the Average True Length (ATR) of length 14. If a low pivot is considered to be equal if it doesn't break the low pivot (is at a lower value) and is inside the previous low pivot + this limit.
ExtendEqualPivotsZones (series bool) : Set to true if you want the equal pivots zones to be extended.
ExtendEqualPivotsStyle (series string) : Set the style of equal pivot zones.
ExtendEqualPivotsColor (series color) : Set the color of equal pivot zones.
EqualHighs (array) : Holds the boxes for zones that contains equal highs.
EqualLows (array) : Holds the boxes for zones that contains equal lows.
BreakOfStructures (array) : Holds all the break of structures within the trend (before a change of character).
Pivots (array) : All the pivots in the current trend, added with the latest first, this is cleared when the trend changes.
AlertFrequency (series string) : set the frequency for alerts.
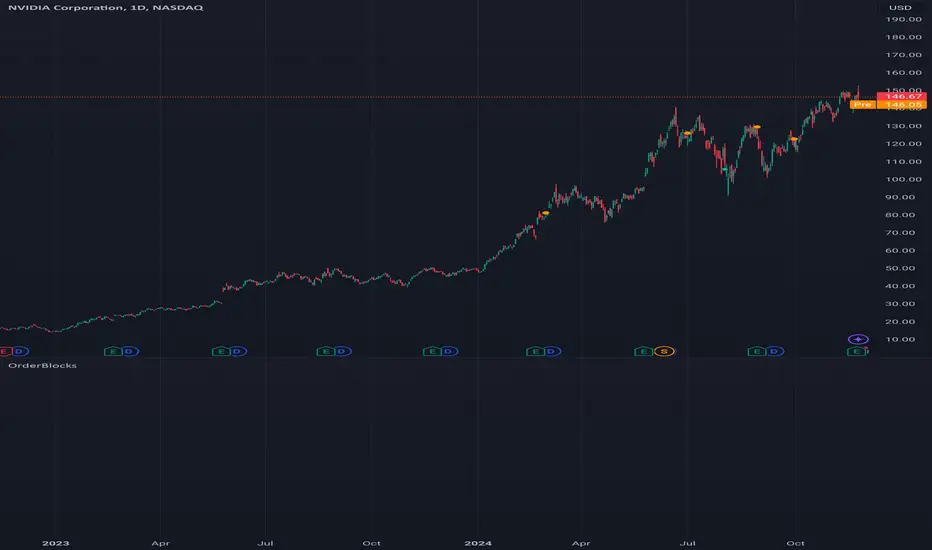
OrderBlocksLibrary "OrderBlocks"
This is a library I created that creates order blocks. It's originated from my indicator "Order blocks" (). It will return a Zone object that can be used to draw an order block. If you want to see how that is done you can check out my indicar that uses the same logic.
Create(settings)
Creates an order block if one is found according to the settings parameter.
Parameters:
settings (Settings) : set all values in this parameter to define the settings for the order block creation.
Returns: a Zone object if an order block is found, na otherwise
Zone
Fields:
Time (series int)
TimeClose (series int)
High (series float)
Low (series float)
ReactionLimit (series float)
TouchedZone (Zone type from mickes/Touched/14)
Type (series int)
Zones
Fields:
Index (series int)
Maximum (series int)
Zones (array)
Remove (Zone)
Settings
Fields:
TakeOut (series bool)
ReactionFactor (series float)
Type (series string)
ConsecutiveRisingOrFalling (series bool)
FairValueGap (series bool)
OutofOptionsHelperLibraryLibrary "OutofOptionsHelperLibrary"
Helper library for my indicators/strategies
isUp(i)
is Up candle
Parameters:
i (int)
Returns: bool
isDown(i)
is Down candle
Parameters:
i (int)
Returns: bool
TF(t)
format time into date/time string
Parameters:
t (int)
Returns: string
S(s)
format data to string
Parameters:
s (float)
Returns: string
S(s)
format data to string
Parameters:
s (int)
Returns: string
S(s)
format data to string
Parameters:
s (bool)
Returns: string
barClose(price, up, strict)
Determine if candle closed above/below price
Parameters:
price (float)
up (bool)
strict (bool) : bool if close over is required or if close at the price is good enough
Returns: bool
processSweep(L, price, up, leftB)
Determine how many liquidity sweeps were made
Parameters:
L (array)
price (float)
up (bool)
leftB (int)
Returns: int
liquidity
Fields:
price (series float)
time (series int)
oprice (series float)
otime (series int)
sweeps (series int)
bars_swept (series int)

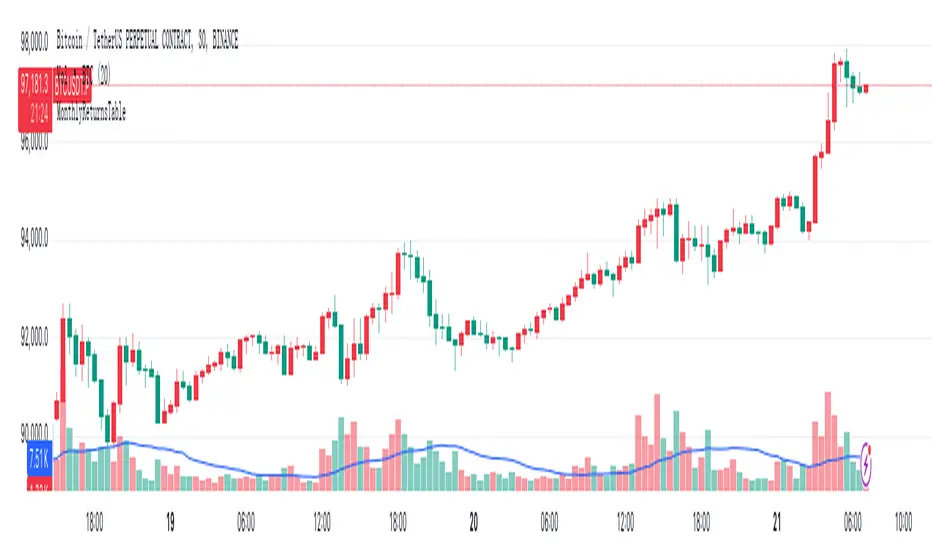
MonthlyReturnsTableLibrary "MonthlyReturnsTable"
showMonthlyReturns(show)
显示月度和年度收益率表格
Parameters:
show (bool) : (bool) 是否显示表格
Returns: 返回一个数组,包含是否显示表格的状态和当前月度收益率
DRKMetricsLibrary "DRKMetrics"
TODO: add library description here
curve(disp_ind)
Call function to get a certain curve of your strategy.
Parameters:
disp_ind (string)
Returns: Returns type of curve plot.
cleaner(disp_ind, plot)
Call function to filter out your Strategy plots
Parameters:
disp_ind (string)
plot (float)
cobraTable(option, position)
Assign this function to a random variable to get the "Performance Table"
Parameters:
option (simple string)
position (simple string)

UtilityLibrary "Utility"
A utility library for various trading tools such as signal generation, custom indicators, and multi-condition crossovers.
multiCrossover(source1, source2, threshold1, threshold2)
multiCrossover
@description Detects multi-condition crossovers between two sources with threshold filters.
Parameters:
source1 (float) : The first data series to compare.
source2 (float) : The second data series to compare.
threshold1 (float) : A value that source1 must exceed to trigger the crossover.
threshold2 (float) : A value that source2 must exceed to trigger the crossunder.
Returns: A tuple: (crossUp, crossDown) where crossUp is a boolean for upward crossover, and crossDown is for downward crossover.
macdCustom(source, fastLength, slowLength, signalLength, macdThresh)
macdCustom
@description Calculates custom MACD signals based on thresholds.
Parameters:
source (float) : The price data or input series.
fastLength (simple int) : The length of the fast EMA.
slowLength (simple int) : The length of the slow EMA.
signalLength (simple int) : The signal line length.
macdThresh (float) : A threshold for the MACD line to confirm buy/sell signals.
Returns: A tuple: (macdBuySignal, macdSellSignal) where macdBuySignal is true when MACD crosses above, and macdSellSignal is true when MACD crosses below the signal line.
combinedMacdRsi(source, fastLength, slowLength, signalLength, rsiLength, macdThresh, rsiThresh)
combinedMacdRsi
@description Generates combined signals from MACD and RSI indicators.
Parameters:
source (float) : The price data or input series.
fastLength (simple int) : The length of the fast EMA for MACD.
slowLength (simple int) : The length of the slow EMA for MACD.
signalLength (simple int) : The signal line length for MACD.
rsiLength (simple int) : The length of the RSI calculation.
macdThresh (float) : The threshold for MACD signals.
rsiThresh (float) : The threshold for RSI signals.
Returns: A tuple: (buySignal, sellSignal) where buySignal is generated when MACD is positive and RSI is below the threshold, and sellSignal when MACD is negative and RSI is above the threshold.
movingAverageCrossover(source, shortLength, longLength)
movingAverageCrossover
@description Detects crossovers between short-term and long-term moving averages.
Parameters:
source (float) : The price data or input series.
shortLength (int) : The length of the short-term moving average.
longLength (int) : The length of the long-term moving average.
Returns: A tuple: (crossUp, crossDown) where crossUp is true when the short-term MA crosses above the long-term MA, and crossDown when the reverse occurs.
Autotable█ OVERVIEW
The library allows to automatically draw a table based on a string or float matrix (or both) controlling all of the parameters of the table (including merging cells) with parameter matrices (like, e.g. matrix of cell colors).
All things you would normally do with table.new() and table.cell() are now possible using respective parameters of library's main function, autotable() (as explained further below).
Headers can be supplied as arrays.
Merging of the cells is controlled with a special matrix of "L" and "U" values which instruct a cell to merged with the cell to the left or upwards (please see examples in the script and in this description).
█ USAGE EXAMPLES
The simplest and most straightforward:
mxF = matrix.new(3,3, 3.14)
mxF.autotable(bgcolor = color.rgb(249, 209, 29)) // displays float matrix as a table in the top right corner with defalult settings
mxS = matrix.new(3,3,"PI")
// displays string matrix as a table in the top right corner with defalult settings
mxS.autotable(Ypos = "bottom", Xpos = "right", bgcolor = #b4d400)
// displays matrix displaying a string value over a float value in each cell
mxS.autotable(mxF, Ypos = "middle", Xpos = "center", bgcolor = color.gray, text_color = #86f62a)
Draws this:
Tables with headers:
if barstate.islast
mxF = matrix.new(3,3, 3.14)
mxS = matrix.new(3,3,"PI")
arColHeaders = array.from("Col1", "Col2", "Col3")
arRowHeaders = array.from("Row1", "Row2", "Row3")
// float matrix with col headers
mxF.autotable(
bgcolor = #fdfd6b
, arColHeaders = arColHeaders
)
// string matrix with row headers
mxS.autotable(arRowHeaders = arRowHeaders, Ypos = "bottom", Xpos = "right", bgcolor = #b4d400)
// string/float matrix with both row and column headers
mxS.autotable(mxF
, Ypos = "middle", Xpos = "center"
, arRowHeaders = arRowHeaders
, arColHeaders = arColHeaders
, cornerBgClr = #707070, cornerTitle = "Corner cell", cornerTxtClr = #ffdc13
, bgcolor = color.gray, text_color = #86f62a
)
Draws this:
█ FUNCTIONS
One main function is autotable() which has only one required argument mxValS, a string matrix.
Please see below the description of all of the function parameters:
The table:
tbl (table) (Optional) If supplied, this table will be deleted.
The data:
mxValS (matrix ) (Required) Cell text values
mxValF (matrix) (Optional) Numerical part of cell text values. Is concatenated to the mxValS values via `string_float_separator` string (default " ")
Table properties, have same effect as in table.new() :
defaultBgColor (color) (Optional) bgcolor to be used if mxBgColor is not supplied
Ypos (string) (Optional) "top", "bottom" or "center"
Xpos (string) (Optional) "left", "right", or "center"
frame_color (color) (Optional) frame_color like in table.new()
frame_width (int) (Optional) frame_width like in table.new()
border_color (color) (Optional) border_color like in table.new()
border_width (int) (Optional) border_width like in table.new()
force_overlay (simple bool) (Optional) If true draws table on main pane.
Cell parameters, have same effect as in table.cell() ):
mxBgColor (matrix) (Optional) like bgcolor argument in table.cell()
mxTextColor (matrix) (Optional) like text_color argument in table.cell()
mxTt (matrix) (Optional) like tooltip argument in table.cell()
mxWidth (matrix) (Optional) like width argument in table.cell()
mxHeight (matrix) (Optional) like height argument in table.cell()
mxHalign (matrix) (Optional) like text_halign argument in table.cell()
mxValign (matrix) (Optional) like text_valign argument in table.cell()
mxTextSize (matrix) (Optional) like text_size argument in table.cell()
mxFontFamily (matrix) (Optional) like text_font_family argument in table.cell()
Other table properties:
tableWidth (float) (Optional) Overrides table width if cell widths are non zero. E.g. if there are four columns and cell widths are 20 (either as set via cellW or via mxWidth) then if tableWidth is set to e.g. 50 then cell widths will be 50 * (20 / 80), where 80 is 20*4 = total width of all cells. Works simialar for widths set via mxWidth - determines max sum of widths across all cloumns of mxWidth and adjusts cell widths proportionally to it. If cell widths are 0 (i.e. auto-adjust) tableWidth has no effect.
tableHeight (float) (Optional) Overrides table height if cell heights are non zero. E.g. if there are four rows and cell heights are 20 (either as set via cellH or via mxHeight) then if tableHeigh is set to e.g. 50 then cell heights will be 50 * (20 / 80), where 80 is 20*4 = total height of all cells. Works simialar for heights set via mxHeight - determines max sum of heights across all cloumns of mxHeight and adjusts cell heights proportionally to it. If cell heights are 0 (i.e. auto-adjust) tableHeight has no effect.
defaultTxtColor (color) (Optional) text_color to be used if mxTextColor is not supplied
text_size (string) (Optional) text_size to be used if mxTextSize is not supplied
font_family (string) (Optional) cell text_font_family value to be used if a value in mxFontFamily is no supplied
cellW (float) (Optional) cell width to be used if a value in mxWidth is no supplied
cellH (float) (Optional) cell height to be used if a value in mxHeight is no supplied
halign (string) (Optional) cell text_halign value to be used if a value in mxHalign is no supplied
valign (string) (Optional) cell text_valign value to be used if a value in mxValign is no supplied
Headers parameters:
arColTitles (array) (Optional) Array of column titles. If not na a header row is added.
arRowTitles (array) (Optional) Array of row titles. If not na a header column is added.
cornerTitle (string) (Optional) If both row and column titles are supplied allows to set the value of the corner cell.
colTitlesBgColor (color) (Optional) bgcolor for header row
colTitlesTxtColor (color) (Optional) text_color for header row
rowTitlesBgColor (color) (Optional) bgcolor for header column
rowTitlesTxtColor (color) (Optional) text_color for header column
cornerBgClr (color) (Optional) bgcolor for the corner cell
cornerTxtClr (color) (Optional) text_color for the corner cell
Cell merge parameters:
mxMerge (matrix) (Optional) A matrix determining how cells will be merged. "L" - cell merges to the left, "U" - upwards.
mergeAllColTitles (bool) (Optional) Allows to print a table title instead of column headers, merging all header row cells and leaving just the value of the first cell. For more flexible options use matrix arguments leaving header/row arguments na.
mergeAllRowTitles (bool) (Optional) Allows to print one text value merging all header row cells and leaving just the value of the first cell. For more flexible options use matrix arguments leaving header/row arguments na.
Format:
string_float_separator (string) (Optional) A string used to separate string and float parts of cell values (mxValS and mxValF). Default is " "
format (string) (Optional) format string like in str.format() used to format numerical values
nz (string) (Optional) Determines how na numerical values are displayed.
The only other available function is autotable(string,... ) with a string parameter instead of string and float matrices which draws a one cell table.
█ SAMPLE USE
E.g., CSVParser library demo uses Autotable's for generating complex tables with merged cells.
█ CREDITS
The library was inspired by @kaigouthro's matrixautotable . A true master. Many thanks to him for his creative, beautiful and very helpful libraries.

display_valueOVERVIEW
This script is a tinny library for creating and displaying formatted values in TradingView scripts. It provides a structured way to present key information like titles, percentages, currency values, decimals, and integers with clear formatting. This allows you to coordinate your strings in advance and hold one item to use for calling your string to a label, box, table.. Made for day to day use of most typical use cases, more advanced techniques should be used for complicated scenarios.
Building Blocks
User Defined Types (UDTs)
The script defines a UDT called `DisplayValue` to encapsulate the components of a display value:
* title : The title or label of the value.
* format_string : The string used to format the value (e.g., "{0} - 1,number,percent}").
* value : The actual value to be displayed.
* format : An enum value specifying the desired format (percent, currency, etc.).
Enums
The `DisplayFormat` enum provides predefined constants for various formatting options, making the code more readable and less prone to errors.
Functions
* create() : This function creates a new `DisplayValue` instance. It takes the title, value, and desired format as arguments and generates the appropriate format string.
* to_string() : This function converts a `DisplayValue` instance into a formatted string ready for display on the chart.
How to Use
1. Import the library:
import kaigouthro/display_value/1as dv
2. Create a DisplayValue instance:
myValue = dv.create("My Percentage", 0.5, dv.DisplayFormat.percent)
3. Convert it to a string:
formattedString = dv.to_string(myValue)
4. Display the formatted string:
label.new(bar_index, high, formattedString)
Example
//@version=5
import kaigouthro/display_value/1 as dv
myValue = dv.create("Profit", 0.15, dv.DisplayFormat.percent)
formattedString = dv.to_string(myValue)
label.new(bar_index, high, formattedString)
This will display a label on the chart with the text "Profit - 15%".
### Notes
* The library handles the formatting details, making it easier to display values consistently in your scripts.
* The use of enums and UDTs improves code organization and readability.
--------
Library "display_value"
create(display_name, display_value, display_format)
Gets the appropriate format string based on the display format.
Parameters:
display_name (string) : (string) The name of the display value. Default is na.
display_value (float)
display_format (series DisplayFormat)
Returns: (DisplayValue) A new DisplayValue instance with the formatted value.
to_string(item)
Converts the display value to a string with the specified format.
Parameters:
item (DisplayValue) : (DisplayValue) The display value to convert to a string.
Returns: (string) The string representation of the display value.
DisplayValue
Structure representing a display value.
Fields:
title (series string) : (string) The title of the display value.
format_string (series string) : (string) The format string to use for display.
value (series float) : (float) The value to display.
format (series DisplayFormat) : (DisplayFormat) The format to use.

analytics_tablesLibrary "analytics_tables"
📝 Description
This library provides the implementation of several performance-related statistics and metrics, presented in the form of tables.
The metrics shown in the afforementioned tables where developed during the past years of my in-depth analalysis of various strategies in an atempt to reason about the performance of each strategy.
The visualization and some statistics where inspired by the existing implementations of the "Seasonality" script, and the performance matrix implementations of @QuantNomad and @ZenAndTheArtOfTrading scripts.
While this library is meant to be used by my strategy framework "Template Trailing Strategy (Backtester)" script, I wrapped it in a library hoping this can be usefull for other community strategy scripts that will be released in the future.
🤔 How to Guide
To use the functionality this library provides in your script you have to import it first!
Copy the import statement of the latest release by pressing the copy button below and then paste it into your script. Give a short name to this library so you can refer to it later on. The import statement should look like this:
import jason5480/analytics_tables/1 as ant
There are three types of tables provided by this library in the initial release. The stats table the metrics table and the seasonality table.
Each one shows different kinds of performance statistics.
The table UDT shall be initialized once using the `init()` method.
They can be updated using the `update()` method where the updated data UDT object shall be passed.
The data UDT can also initialized and get updated on demend depending on the use case
A code example for the StatsTable is the following:
var ant.StatsData statsData = ant.StatsData.new()
statsData.update(SideStats.new(), SideStats.new(), 0)
if (barstate.islastconfirmedhistory or (barstate.isrealtime and barstate.isconfirmed))
var statsTable = ant.StatsTable.new().init(ant.getTablePos('TOP', 'RIGHT'))
statsTable.update(statsData)
A code example for the MetricsTable is the following:
var ant.StatsData statsData = ant.StatsData.new()
statsData.update(ant.SideStats.new(), ant.SideStats.new(), 0)
if (barstate.islastconfirmedhistory or (barstate.isrealtime and barstate.isconfirmed))
var metricsTable = ant.MetricsTable.new().init(ant.getTablePos('BOTTOM', 'RIGHT'))
metricsTable.update(statsData, 10)
A code example for the SeasonalityTable is the following:
var ant.SeasonalData seasonalData = ant.SeasonalData.new().init(Seasonality.monthOfYear)
seasonalData.update()
if (barstate.islastconfirmedhistory or (barstate.isrealtime and barstate.isconfirmed))
var seasonalTable = ant.SeasonalTable.new().init(seasonalData, ant.getTablePos('BOTTOM', 'LEFT'))
seasonalTable.update(seasonalData)
🏋️♂️ Please refer to the "EXAMPLE" regions of the script for more advanced and up to date code examples!
Special thanks to @Mrcrbw for the proposal to develop this library and @DCNeu for the constructive feedback 🏆.
getTablePos(ypos, xpos)
Get table position compatible string
Parameters:
ypos (simple string) : The position on y axise
xpos (simple string) : The position on x axise
Returns: The position to be passed to the table
method init(this, pos, height, width, positiveTxtColor, negativeTxtColor, neutralTxtColor, positiveBgColor, negativeBgColor, neutralBgColor)
Initialize the stats table object with the given colors in the given position
Namespace types: StatsTable
Parameters:
this (StatsTable) : The stats table object
pos (simple string) : The table position string
height (simple float) : The height of the table as a percentage of the charts height. By default, 0 auto-adjusts the height based on the text inside the cells
width (simple float) : The width of the table as a percentage of the charts height. By default, 0 auto-adjusts the width based on the text inside the cells
positiveTxtColor (simple color) : The text color when positive
negativeTxtColor (simple color) : The text color when negative
neutralTxtColor (simple color) : The text color when neutral
positiveBgColor (simple color) : The background color with transparency when positive
negativeBgColor (simple color) : The background color with transparency when negative
neutralBgColor (simple color) : The background color with transparency when neutral
method init(this, pos, height, width, neutralBgColor)
Initialize the metrics table object with the given colors in the given position
Namespace types: MetricsTable
Parameters:
this (MetricsTable) : The metrics table object
pos (simple string) : The table position string
height (simple float) : The height of the table as a percentage of the charts height. By default, 0 auto-adjusts the height based on the text inside the cells
width (simple float) : The width of the table as a percentage of the charts width. By default, 0 auto-adjusts the width based on the text inside the cells
neutralBgColor (simple color) : The background color with transparency when neutral
method init(this, seas)
Initialize the seasonal data
Namespace types: SeasonalData
Parameters:
this (SeasonalData) : The seasonal data object
seas (simple Seasonality) : The seasonality of the matrix data
method init(this, data, pos, maxNumOfYears, height, width, extended, neutralTxtColor, neutralBgColor)
Initialize the seasonal table object with the given colors in the given position
Namespace types: SeasonalTable
Parameters:
this (SeasonalTable) : The seasonal table object
data (SeasonalData) : The seasonality data of the table
pos (simple string) : The table position string
maxNumOfYears (simple int) : The maximum number of years that fit into the table
height (simple float) : The height of the table as a percentage of the charts height. By default, 0 auto-adjusts the height based on the text inside the cells
width (simple float) : The width of the table as a percentage of the charts width. By default, 0 auto-adjusts the width based on the text inside the cells
extended (simple bool) : The seasonal table with extended columns for performance
neutralTxtColor (simple color) : The text color when neutral
neutralBgColor (simple color) : The background color with transparency when neutral
method update(this, wins, losses, numOfInconclusiveExits)
Update the strategy info data of the strategy
Namespace types: StatsData
Parameters:
this (StatsData) : The strategy statistics object
wins (SideStats)
losses (SideStats)
numOfInconclusiveExits (int) : The number of inconclusive trades
method update(this, stats, positiveTxtColor, negativeTxtColor, negativeBgColor, neutralBgColor)
Update the stats table object with the given data
Namespace types: StatsTable
Parameters:
this (StatsTable) : The stats table object
stats (StatsData) : The stats data to update the table
positiveTxtColor (simple color) : The text color when positive
negativeTxtColor (simple color) : The text color when negative
negativeBgColor (simple color) : The background color with transparency when negative
neutralBgColor (simple color) : The background color with transparency when neutral
method update(this, stats, buyAndHoldPerc, positiveTxtColor, negativeTxtColor, positiveBgColor, negativeBgColor)
Update the metrics table object with the given data
Namespace types: MetricsTable
Parameters:
this (MetricsTable) : The metrics table object
stats (StatsData) : The stats data to update the table
buyAndHoldPerc (float) : The buy and hold percetage
positiveTxtColor (simple color) : The text color when positive
negativeTxtColor (simple color) : The text color when negative
positiveBgColor (simple color) : The background color with transparency when positive
negativeBgColor (simple color) : The background color with transparency when negative
method update(this)
Update the seasonal data based on the season and eon timeframe
Namespace types: SeasonalData
Parameters:
this (SeasonalData) : The seasonal data object
method update(this, data, positiveTxtColor, negativeTxtColor, neutralTxtColor, positiveBgColor, negativeBgColor, neutralBgColor, timeBgColor)
Update the seasonal table object with the given data
Namespace types: SeasonalTable
Parameters:
this (SeasonalTable) : The seasonal table object
data (SeasonalData) : The seasonal cell data to update the table
positiveTxtColor (simple color) : The text color when positive
negativeTxtColor (simple color) : The text color when negative
neutralTxtColor (simple color) : The text color when neutral
positiveBgColor (simple color) : The background color with transparency when positive
negativeBgColor (simple color) : The background color with transparency when negative
neutralBgColor (simple color) : The background color with transparency when neutral
timeBgColor (simple color) : The background color of the time gradient
SideStats
Object that represents the strategy statistics data of one side win or lose
Fields:
numOf (series int)
sumFreeProfit (series float)
freeProfitStDev (series float)
sumProfit (series float)
profitStDev (series float)
sumGain (series float)
gainStDev (series float)
avgQuantityPerc (series float)
avgCapitalRiskPerc (series float)
avgTPExecutedCount (series float)
avgRiskRewardRatio (series float)
maxStreak (series int)
StatsTable
Object that represents the stats table
Fields:
table (series table) : The actual table
rows (series int) : The number of rows of the table
columns (series int) : The number of columns of the table
StatsData
Object that represents the statistics data of the strategy
Fields:
wins (SideStats)
losses (SideStats)
numOfInconclusiveExits (series int)
avgFreeProfitStr (series string)
freeProfitStDevStr (series string)
lossFreeProfitStDevStr (series string)
avgProfitStr (series string)
profitStDevStr (series string)
lossProfitStDevStr (series string)
avgQuantityStr (series string)
MetricsTable
Object that represents the metrics table
Fields:
table (series table) : The actual table
rows (series int) : The number of rows of the table
columns (series int) : The number of columns of the table
SeasonalData
Object that represents the seasonal table dynamic data
Fields:
seasonality (series Seasonality)
eonToMatrixRow (map)
numOfEons (series int)
mostRecentMatrixRow (series int)
balances (matrix)
returnPercs (matrix)
maxDDs (matrix)
eonReturnPercs (array)
eonCAGRs (array)
eonMaxDDs (array)
SeasonalTable
Object that represents the seasonal table
Fields:
table (series table) : The actual table
headRows (series int) : The number of head rows of the table
headColumns (series int) : The number of head columns of the table
eonRows (series int) : The number of eon rows of the table
seasonColumns (series int) : The number of season columns of the table
statsRows (series int)
statsColumns (series int) : The number of stats columns of the table
rows (series int) : The number of rows of the table
columns (series int) : The number of columns of the table
extended (series bool) : Whether the table has additional performance statistics

StyleLibraryLibrary "StyleLibrary"
A small library of Pine Script functions that return built-in style variables.
method sizeStyle(size)
Takes a `string` that returns the corresponding built-in size style variable.
Namespace types: series string, simple string, input string, const string
Parameters:
size (string) : A `string` representing a built-in size style: `"Tiny"`, `"Small"`, `"Normal"`, `"Large"`,
`"Huge"`, `"Auto"`.
Returns: The respective built-in size style variable.
method sizeStyle(size)
Takes a `sizeStyle` that returns the corresponding built-in size style variable.
Namespace types: series sizeStyle
Parameters:
size (series sizeStyle) : A `sizeStyle` representing a built-in size style variable.
Returns: The respective built-in size style variable.
method lineStyle(style)
Takes a `string` that returns the corresponding built-in line style variable.
Namespace types: series string, simple string, input string, const string
Parameters:
style (string) : A `string` representing a built-in line style: `"Dashed"`, `"Dotted"`, `"Solid"`.
Returns: The respective built-in line style variable.
method lineStyle(style)
Takes a `lineStyle` that returns the corresponding built-in line style variable.
Namespace types: series lineStyle
Parameters:
style (series lineStyle) : A `lineStyle` representing a built-in line style variable.
Returns: The respective built-in line style variable.
method labelStyle(style)
Takes a `string` that returns the corresponding built-in label style variable.
Namespace types: series string, simple string, input string, const string
Parameters:
style (string) : A `string` representing a built-in label style:
`"Arrow Down"`, `"Arrow Up"`, `"Circle"`, `"Cross"`, `"Diamond"`, `"Flag"`,
`"Label Center"`, `"Label Down"`, `"Label Left"`, `"Label Lower Left"`,
`"Label Lower Right"`, `"Label Right"`, `"Label Up"`, `"Label Upper Left"`,
`"Label Upper Right"`, `"None"`, `"Square"`, `"Text Outline"`, `"Triangle Down"`,
`"Triangle Up"`, `"XCross"`.
Returns: The respective built-in label style variable.
method labelStyle(style)
Takes a `labelStyle` that returns the corresponding built-in label style variable.
Namespace types: series labelStyle
Parameters:
style (series labelStyle) : A `labelStyle` representing a built-in label style variable.
Returns: The respective built-in label style variable.
method fontStyle(font)
Takes a `string` that returns the corresponding built-in font style variable.
Namespace types: series string, simple string, input string, const string
Parameters:
font (string) : A `string` representing a built-in font style: `"Default"`, `"Monospace"`.
Returns: The respective built-in font style variable.
method positionStyle(position)
Takes a `string` that returns the corresponding built-in position style variable.
Namespace types: series string, simple string, input string, const string
Parameters:
position (string) : A `string` representing a built-in position style:
`"Bottom Center", `"Bottom Left", `"Bottom Right", `"Middle Center", `"Middle Left",
`"Middle Right", `"Top Center", `"Top Left", `"Top Right".
Returns: The respective built-in position style variable.
method displayStyle(display)
Takes a `simple string` that returns the corresponding built-in display style variable.
Namespace types: simple string, input string, const string
Parameters:
display (simple string) : A `simple string` representing a built-in display style: `"All"`, `"Data Window"`,
`"None"`, `"Pane"`, `"Price Scale"`, `"Status Line"`.
Returns: The respective built-in display style variable.

DrawingLibrary "Drawing"
User Defined types and methods for basic drawing structure. Consolidated from the earlier libraries - DrawingTypes and DrawingMethods
method get_price(this, bar)
get line price based on bar
Namespace types: Line
Parameters:
this (Line) : (series Line) Line object.
bar (int) : (series/int) bar at which line price need to be calculated
Returns: line price at given bar.
method init(this)
Namespace types: PolyLine
Parameters:
this (PolyLine)
method tostring(this, sortKeys, sortOrder, includeKeys)
Converts DrawingTypes/Point object to string representation
Namespace types: chart.point
Parameters:
this (chart.point) : DrawingTypes/Point object
sortKeys (bool) : If set to true, string output is sorted by keys.
sortOrder (int) : Applicable only if sortKeys is set to true. Positive number will sort them in ascending order whreas negative numer will sort them in descending order. Passing 0 will not sort the keys
includeKeys (array) : Array of string containing selective keys. Optional parmaeter. If not provided, all the keys are considered
Returns: string representation of DrawingTypes/Point
method tostring(this, sortKeys, sortOrder, includeKeys)
Converts DrawingTypes/LineProperties object to string representation
Namespace types: LineProperties
Parameters:
this (LineProperties) : DrawingTypes/LineProperties object
sortKeys (bool) : If set to true, string output is sorted by keys.
sortOrder (int) : Applicable only if sortKeys is set to true. Positive number will sort them in ascending order whreas negative numer will sort them in descending order. Passing 0 will not sort the keys
includeKeys (array) : Array of string containing selective keys. Optional parmaeter. If not provided, all the keys are considered
Returns: string representation of DrawingTypes/LineProperties
method tostring(this, sortKeys, sortOrder, includeKeys)
Converts DrawingTypes/Line object to string representation
Namespace types: Line
Parameters:
this (Line) : DrawingTypes/Line object
sortKeys (bool) : If set to true, string output is sorted by keys.
sortOrder (int) : Applicable only if sortKeys is set to true. Positive number will sort them in ascending order whreas negative numer will sort them in descending order. Passing 0 will not sort the keys
includeKeys (array) : Array of string containing selective keys. Optional parmaeter. If not provided, all the keys are considered
Returns: string representation of DrawingTypes/Line
method tostring(this, sortKeys, sortOrder, includeKeys)
Converts DrawingTypes/LabelProperties object to string representation
Namespace types: LabelProperties
Parameters:
this (LabelProperties) : DrawingTypes/LabelProperties object
sortKeys (bool) : If set to true, string output is sorted by keys.
sortOrder (int) : Applicable only if sortKeys is set to true. Positive number will sort them in ascending order whreas negative numer will sort them in descending order. Passing 0 will not sort the keys
includeKeys (array) : Array of string containing selective keys. Optional parmaeter. If not provided, all the keys are considered
Returns: string representation of DrawingTypes/LabelProperties
method tostring(this, sortKeys, sortOrder, includeKeys)
Converts DrawingTypes/Label object to string representation
Namespace types: Label
Parameters:
this (Label) : DrawingTypes/Label object
sortKeys (bool) : If set to true, string output is sorted by keys.
sortOrder (int) : Applicable only if sortKeys is set to true. Positive number will sort them in ascending order whreas negative numer will sort them in descending order. Passing 0 will not sort the keys
includeKeys (array) : Array of string containing selective keys. Optional parmaeter. If not provided, all the keys are considered
Returns: string representation of DrawingTypes/Label
method tostring(this, sortKeys, sortOrder, includeKeys)
Converts DrawingTypes/Linefill object to string representation
Namespace types: Linefill
Parameters:
this (Linefill) : DrawingTypes/Linefill object
sortKeys (bool) : If set to true, string output is sorted by keys.
sortOrder (int) : Applicable only if sortKeys is set to true. Positive number will sort them in ascending order whreas negative numer will sort them in descending order. Passing 0 will not sort the keys
includeKeys (array) : Array of string containing selective keys. Optional parmaeter. If not provided, all the keys are considered
Returns: string representation of DrawingTypes/Linefill
method tostring(this, sortKeys, sortOrder, includeKeys)
Converts DrawingTypes/BoxProperties object to string representation
Namespace types: BoxProperties
Parameters:
this (BoxProperties) : DrawingTypes/BoxProperties object
sortKeys (bool) : If set to true, string output is sorted by keys.
sortOrder (int) : Applicable only if sortKeys is set to true. Positive number will sort them in ascending order whreas negative numer will sort them in descending order. Passing 0 will not sort the keys
includeKeys (array) : Array of string containing selective keys. Optional parmaeter. If not provided, all the keys are considered
Returns: string representation of DrawingTypes/BoxProperties
method tostring(this, sortKeys, sortOrder, includeKeys)
Converts DrawingTypes/BoxText object to string representation
Namespace types: BoxText
Parameters:
this (BoxText) : DrawingTypes/BoxText object
sortKeys (bool) : If set to true, string output is sorted by keys.
sortOrder (int) : Applicable only if sortKeys is set to true. Positive number will sort them in ascending order whreas negative numer will sort them in descending order. Passing 0 will not sort the keys
includeKeys (array) : Array of string containing selective keys. Optional parmaeter. If not provided, all the keys are considered
Returns: string representation of DrawingTypes/BoxText
method tostring(this, sortKeys, sortOrder, includeKeys)
Converts DrawingTypes/Box object to string representation
Namespace types: Box
Parameters:
this (Box) : DrawingTypes/Box object
sortKeys (bool) : If set to true, string output is sorted by keys.
sortOrder (int) : Applicable only if sortKeys is set to true. Positive number will sort them in ascending order whreas negative numer will sort them in descending order. Passing 0 will not sort the keys
includeKeys (array) : Array of string containing selective keys. Optional parmaeter. If not provided, all the keys are considered
Returns: string representation of DrawingTypes/Box
method delete(this)
Deletes line from DrawingTypes/Line object
Namespace types: Line
Parameters:
this (Line) : DrawingTypes/Line object
Returns: Line object deleted
method delete(this)
Deletes label from DrawingTypes/Label object
Namespace types: Label
Parameters:
this (Label) : DrawingTypes/Label object
Returns: Label object deleted
method delete(this)
Deletes Linefill from DrawingTypes/Linefill object
Namespace types: Linefill
Parameters:
this (Linefill) : DrawingTypes/Linefill object
Returns: Linefill object deleted
method delete(this)
Deletes box from DrawingTypes/Box object
Namespace types: Box
Parameters:
this (Box) : DrawingTypes/Box object
Returns: DrawingTypes/Box object deleted
method delete(this)
Deletes lines from array of DrawingTypes/Line objects
Namespace types: array
Parameters:
this (array) : Array of DrawingTypes/Line objects
Returns: Array of DrawingTypes/Line objects
method delete(this)
Deletes labels from array of DrawingTypes/Label objects
Namespace types: array
Parameters:
this (array) : Array of DrawingTypes/Label objects
Returns: Array of DrawingTypes/Label objects
method delete(this)
Deletes linefill from array of DrawingTypes/Linefill objects
Namespace types: array
Parameters:
this (array) : Array of DrawingTypes/Linefill objects
Returns: Array of DrawingTypes/Linefill objects
method delete(this)
Deletes boxes from array of DrawingTypes/Box objects
Namespace types: array
Parameters:
this (array) : Array of DrawingTypes/Box objects
Returns: Array of DrawingTypes/Box objects
method clear(this)
clear items from array of DrawingTypes/Line while deleting underlying objects
Namespace types: array
Parameters:
this (array) : array
Returns: void
method clear(this)
clear items from array of DrawingTypes/Label while deleting underlying objects
Namespace types: array
Parameters:
this (array) : array
Returns: void
method clear(this)
clear items from array of DrawingTypes/Linefill while deleting underlying objects
Namespace types: array
Parameters:
this (array) : array
Returns: void
method clear(this)
clear items from array of DrawingTypes/Box while deleting underlying objects
Namespace types: array
Parameters:
this (array) : array
Returns: void
method draw(this)
Creates line from DrawingTypes/Line object
Namespace types: Line
Parameters:
this (Line) : DrawingTypes/Line object
Returns: line created from DrawingTypes/Line object
method draw(this)
Creates lines from array of DrawingTypes/Line objects
Namespace types: array
Parameters:
this (array) : Array of DrawingTypes/Line objects
Returns: Array of DrawingTypes/Line objects
method draw(this)
Creates label from DrawingTypes/Label object
Namespace types: Label
Parameters:
this (Label) : DrawingTypes/Label object
Returns: label created from DrawingTypes/Label object
method draw(this)
Creates labels from array of DrawingTypes/Label objects
Namespace types: array
Parameters:
this (array) : Array of DrawingTypes/Label objects
Returns: Array of DrawingTypes/Label objects
method draw(this)
Creates linefill object from DrawingTypes/Linefill
Namespace types: Linefill
Parameters:
this (Linefill) : DrawingTypes/Linefill objects
Returns: linefill object created
method draw(this)
Creates linefill objects from array of DrawingTypes/Linefill objects
Namespace types: array
Parameters:
this (array) : Array of DrawingTypes/Linefill objects
Returns: Array of DrawingTypes/Linefill used for creating linefills
method draw(this)
Creates box from DrawingTypes/Box object
Namespace types: Box
Parameters:
this (Box) : DrawingTypes/Box object
Returns: box created from DrawingTypes/Box object
method draw(this)
Creates labels from array of DrawingTypes/Label objects
Namespace types: array
Parameters:
this (array) : Array of DrawingTypes/Label objects
Returns: Array of DrawingTypes/Label objects
method createLabel(this, lblText, tooltip, properties)
Creates DrawingTypes/Label object from DrawingTypes/Point
Namespace types: chart.point
Parameters:
this (chart.point) : DrawingTypes/Point object
lblText (string) : Label text
tooltip (string) : Tooltip text. Default is na
properties (LabelProperties) : DrawingTypes/LabelProperties object. Default is na - meaning default values are used.
Returns: DrawingTypes/Label object
method createLine(this, other, properties)
Creates DrawingTypes/Line object from one DrawingTypes/Point to other
Namespace types: chart.point
Parameters:
this (chart.point) : First DrawingTypes/Point object
other (chart.point) : Second DrawingTypes/Point object
properties (LineProperties) : DrawingTypes/LineProperties object. Default set to na - meaning default values are used.
Returns: DrawingTypes/Line object
method createLinefill(this, other, fillColor, transparency)
Creates DrawingTypes/Linefill object from DrawingTypes/Line object to other DrawingTypes/Line object
Namespace types: Line
Parameters:
this (Line) : First DrawingTypes/Line object
other (Line) : Other DrawingTypes/Line object
fillColor (color) : fill color of linefill. Default is color.blue
transparency (int) : fill transparency for linefill. Default is 80
Returns: Array of DrawingTypes/Linefill object
method createBox(this, other, properties, textProperties)
Creates DrawingTypes/Box object from one DrawingTypes/Point to other
Namespace types: chart.point
Parameters:
this (chart.point) : First DrawingTypes/Point object
other (chart.point) : Second DrawingTypes/Point object
properties (BoxProperties) : DrawingTypes/BoxProperties object. Default set to na - meaning default values are used.
textProperties (BoxText) : DrawingTypes/BoxText object. Default is na - meaning no text will be drawn
Returns: DrawingTypes/Box object
method createBox(this, properties, textProperties)
Creates DrawingTypes/Box object from DrawingTypes/Line as diagonal line
Namespace types: Line
Parameters:
this (Line) : Diagonal DrawingTypes/PoLineint object
properties (BoxProperties) : DrawingTypes/BoxProperties object. Default set to na - meaning default values are used.
textProperties (BoxText) : DrawingTypes/BoxText object. Default is na - meaning no text will be drawn
Returns: DrawingTypes/Box object
LineProperties
Properties of line object
Fields:
xloc (series string) : X Reference - can be either xloc.bar_index or xloc.bar_time. Default is xloc.bar_index
extend (series string) : Property which sets line to extend towards either right or left or both. Valid values are extend.right, extend.left, extend.both, extend.none. Default is extend.none
color (series color) : Line color
style (series string) : Line style, valid values are line.style_solid, line.style_dashed, line.style_dotted, line.style_arrow_left, line.style_arrow_right, line.style_arrow_both. Default is line.style_solid
width (series int) : Line width. Default is 1
Line
Line object created from points
Fields:
start (chart.point) : Starting point of the line
end (chart.point) : Ending point of the line
properties (LineProperties) : LineProperties object which defines the style of line
object (series line) : Derived line object
LabelProperties
Properties of label object
Fields:
xloc (series string) : X Reference - can be either xloc.bar_index or xloc.bar_time. Default is xloc.bar_index
yloc (series string) : Y reference - can be yloc.price, yloc.abovebar, yloc.belowbar. Default is yloc.price
color (series color) : Label fill color
style (series string) : Label style as defined in Tradingview Documentation. Default is label.style_none
textcolor (series color) : text color. Default is color.black
size (series string) : Label text size. Default is size.normal. Other values are size.auto, size.tiny, size.small, size.normal, size.large, size.huge
textalign (series string) : Label text alignment. Default if text.align_center. Other allowed values - text.align_right, text.align_left, text.align_top, text.align_bottom
text_font_family (series string) : The font family of the text. Default value is font.family_default. Other available option is font.family_monospace
Label
Label object
Fields:
point (chart.point) : Point where label is drawn
lblText (series string) : label text
tooltip (series string) : Tooltip text. Default is na
properties (LabelProperties) : LabelProperties object
object (series label) : Pine label object
Linefill
Linefill object
Fields:
line1 (Line) : First line to create linefill
line2 (Line) : Second line to create linefill
fillColor (series color) : Fill color
transparency (series int) : Fill transparency range from 0 to 100
object (series linefill) : linefill object created from wrapper
BoxProperties
BoxProperties object
Fields:
border_color (series color) : Box border color. Default is color.blue
bgcolor (series color) : box background color
border_width (series int) : Box border width. Default is 1
border_style (series string) : Box border style. Default is line.style_solid
extend (series string) : Extend property of box. default is extend.none
xloc (series string) : defines if drawing needs to be done based on bar index or time. default is xloc.bar_index
BoxText
Box Text properties.
Fields:
boxText (series string) : Text to be printed on the box
text_size (series string) : Text size. Default is size.auto
text_color (series color) : Box text color. Default is color.yellow.
text_halign (series string) : horizontal align style - default is text.align_center
text_valign (series string) : vertical align style - default is text.align_center
text_wrap (series string) : text wrap style - default is text.wrap_auto
text_font_family (series string) : Text font. Default is
Box
Box object
Fields:
p1 (chart.point) : Diagonal point one
p2 (chart.point) : Diagonal point two
properties (BoxProperties) : Box properties
textProperties (BoxText) : Box text properties
object (series box) : Box object created
PolyLineProperties
Fields:
curved (series bool)
closed (series bool)
xloc (series string)
lineColor (series color)
fillColor (series color)
lineStyle (series string)
lineWidth (series int)
PolyLine
Fields:
points (array)
properties (PolyLineProperties)
object (series polyline)
Order Block Overlapping Drawing [TradingFinder]🔵 Introduction
Technical analysis is a fundamental tool in financial markets, helping traders identify key areas on price charts to make informed trading decisions. The ICT (Inner Circle Trader) style, developed by Michael Huddleston, is one of the most advanced methods in this field.
It enables traders to precisely identify and exploit critical zones such as Order Blocks, Breaker Blocks, Fair Value Gaps (FVGs), and Inversion Fair Value Gaps (IFVGs).
To streamline and simplify the use of these key areas, a library has been developed in Pine Script, the scripting language for the TradingView platform. This library allows you to automatically detect overlapping zones between Order Blocks and other similar areas, and visually display them on your chart.
This tool is particularly useful for creating indicators like Balanced Price Range (BPR) and ICT Unicorn Model.
🔵 How to Use
This section explains how to use the Pine Script library. This library assists you in easily identifying and analyzing overlapping areas between Order Blocks and other zones, such as Breaker Blocks and Fair Value Gaps.
To add "Order Block Overlapping Drawing", you must first add the following code to your script.
import TFlab/OrderBlockOverlappingDrawing/1
🟣 Inputs
The library includes the "OBOverlappingDrawing" function, which you can use to detect and display overlapping zones. This function identifies and draws overlapping zones based on the Order Block type, trigger conditions, previous and current prices, and other relevant parameters.
🟣 Parameters
OBOverlappingDrawing(OBType , TriggerConditionOrigin, distalPrice_Pre, proximalPrice_Pre , distalPrice_Curr, proximalPrice_Curr, Index_Curr , OBValidGlobal, OBValidDis, MitigationLvL, ShowAll, Show, ColorZone) =>
OBType (string)
TriggerConditionOrigin (bool)
distalPrice_Pre (float)
proximalPrice_Pre (float)
distalPrice_Curr (float)
proximalPrice_Curr (float)
Index_Curr (int)
OBValidGlobal (bool)
OBValidDis (int)
MitigationLvL (string)
ShowAll (bool)
Show (bool)
ColorZone (color)
In this example, various parameters are defined to detect overlapping zones and draw them on the chart. Based on these settings, the overlapping areas will be automatically drawn on the chart.
OBType : All order blocks are summarized into two types: "Supply" and "Demand." You should input your Current order block type in this parameter. Enter "Demand" for drawing demand zones and "Supply" for drawing supply zones.
TriggerConditionOrigin : Input the condition under which you want the Current order block to be drawn in this parameter.
distalPrice_Pre : Generally, if each zone is formed by two lines, the farthest line from the price is termed Pervious "Distal." This input receives the price of the "Distal" line.
proximalPrice_Pre : Generally, if each zone is formed by two lines, the nearest line to the price is termed Previous "Proximal" line.
distalPrice_Curr : Generally, if each zone is formed by two lines, the farthest line from the price is termed Current "Distal." This input receives the price of the "Distal" line.
proximalPrice_Curr : Generally, if each zone is formed by two lines, the nearest line to the price is termed Current "Proximal" line.
Index_Curr : This input receives the value of the "bar_index" at the beginning of the order block. You should store the "bar_index" value at the occurrence of the condition for the Current order block to be drawn and input it here.
OBValidGlobal : This parameter is a boolean in which you can enter the condition that you want to execute to stop drawing the block order. If you do not have a special condition, you should set it to True.
OBValidDis : Order blocks continue to be drawn until a new order block is drawn or the order block is "Mitigate." You can specify how many candles after their initiation order blocks should continue. If you want no limitation, enter the number 4998.
MitigationLvL : This parameter is a string. Its inputs are one of "Proximal", "Distal" or "50 % OB" modes, which you can enter according to your needs. The "50 % OB" line is the middle line between distal and proximal.
ShowAll : This is a boolean parameter, if it is "true" the entire order of blocks will be displayed, and if it is "false" only the last block order will be displayed.
Show : You may need to manage whether to display or hide order blocks. When this input is "On", order blocks are displayed, and when it's "Off", order blocks are not displayed.
ColorZone : You can input your preferred color for drawing order blocks.
🟣 Output
Mitigation Alerts : This library allows you to leverage Mitigation Alerts to detect specific conditions that could lead to trend reversals. These alerts help you react promptly in your trades, ensuring better management of market shifts.
🔵 Conclusion
The Pine Script library provided is a powerful tool for technical analysis, especially in the ICT style. It enables you to detect overlapping zones between Order Blocks and other significant areas like Breaker Blocks and Fair Value Gaps, improving your trading strategies. By utilizing this tool, you can perform more precise analysis and manage risks effectively in your trades.

PubLibUtilityLibrary "PubLibUtility"
utilities for indicator and strategy development
size(size)
size to string conversion
Parameters:
size (string)
Returns: const string
tab_pos(tab_pos)
table position to string conversion
Parameters:
tab_pos (string)
Returns: const string
time_string(time_in)
time to string conversion
Parameters:
time_in (int)
Returns: literal string
