Borjas Tarh TrenderBorjas Tarh Trender
This indicator has a Light ( Low TF ) and a Heavy ( High TF ) lines which are based on RSI Calculations.
Best used for Trending Moves .
Light > 80 => Purple Color
Light < 20 => Aqua Color
The Heavy can be Support or Resistance for the Light. Also, you could spot Divergences on both of them.
Besides, the EMA can be used for Support and Resistance as well but the Heavy has more weight than the EMA .
© mrhashem
© Borjas Tarh Company
Divergence

[fikira] Divergences (RSI)This script can be used with candlesticks, accompanied with " RSI + Divergences"
The calculation is different than my "Divergences (Pivots)"
Thank you!

RSI Divergence Plotter (2020)How do i use this script?
Firstly, be sure that you have done your research on what divergence is. The oscillator will automatically mark all types of divergence and has coloured 'over bought' and 'oversold' levels at 30 and 70, although reliable, be sure to use other Technical Analysis before entering trades.
Thank you.

Divergence of DecisionPoint Breadth Swenlin Trading [LazyBear]// This source code is subject to the terms of the Mozilla Public License 2.0 at mozilla.org
// © 03.freeman
//This is indicator from LazyBear is very accurate for stocks and indexes.
//I added some code snippets for spot and draw divergences automatically
//
// @author LazyBear
//
//
Best use with daily time frame.
Enter when a divergence is found (Bull or Bear label) and wait at least a couple of candles before exit.
Next improvement: alerts ready made for webhooks and screener for multiple tickers.
Please use comment section for any feedback.

RSI Divergence Histogram (Real Time)Simple and beautiful real time RSI Divergence Histogram.
Defined and highlighted "overbought" and "oversold" RSI-levels set in the input section of the indicator.
Tiny triangle marker shows pivot high and low.
Plotted Bearish and Bullish Divergence with a colored line in real time.
Yellow triangle shows overbought with bearish candlesticks and oversold with bullish candlesticks.
設定画面で定義した売られ過ぎ、買われ過ぎに達したヒストグラムをハイライトします。
小さい三角マークでダイバージェンス判定に使われるピボットハイ・ローを示します。
ダイバージェンス・ラインをリアルタイムに表示します。
売られすぎ時に陽線が出た場合、買われすぎ時に陰線が出たヒストグラムを黄色の三角で示します。

RSI Divergence Histogram
Simple and beautiful RSI Divergence Histogram.
Defined and highlighted "overbought" and "oversold" RSI-levels set in the input section of the indicator.
Tiny triangle marker shows pivot high and low.
Plotted Bearish and Bullish Divergence with a colored line.
Yellow triangle shows overbought with bearish candlesticks and oversold with bullish candlesticks.
Background color shows the switching buy or sell power.
No alert.
設定画面で定義した売られ過ぎ、買われ過ぎに達したヒストグラムをハイライトします。
小さい三角マークでダイバージェンス判定に使われるピボットハイ・ローを示します。
ダイバージェンス・ラインを表示します。
売られすぎ時に陽線が出た場合、買われすぎ時に陰線が出たヒストグラムを黄色の三角で示します。
買いと売りの勢力が反転した際に、背景色を着色します。
アラート機能はありません。

[fikira] MACD & RSI+Stoch + DivergencesThis is a new version of my "Divergences"
Compared to my "Divergences (Pivots)", this is calculated totally different
There are 3 options:
- MACD
- RSI
- Stoch RSI
Since this script is very heavy in calculation it is limited in time (= inspired from a script of "Che_Trader")
Also it uses "max_bars_back" (=1000)
For MACD and Stoch RSI there is a "custom Divergences Period", which compares more then 7 Pivot Points,
the higher the number, the less reliable, it is not necessary to use this, but it is there,
also you can change the "leftbars" and "rightbars", again, it is not necessary to change, but you can...
Linewidth and style of the Divergences lines can be changed
Thank you!

Divergence Detector v1This indicator looks for divergences between price (close) and the indicator of your choice. You can see which indicators are supported further down. I discovered that there are 2 slight variations on how to calculate divergences in Pinescript, so I used both in this script.
Benefit : The accuracy of divergence detection becomes much higher.
Tradeoff : Some of the labels will overlap each other, not looking too pretty. I know how to fix this, but I didn't prioritize it with this version.
Supported indicators:
RSI (Relative Strength Index) - www.investopedia.com
ROC (Rate of Change) - www.investopedia.com
CCI (Commodity Channel Index) - www.investopedia.com
OBV (On Balance Volume) - www.investopedia.com
You can switch between them in the settings display of the indicator. Default is set to RSI.

Mk 47 (Width)This is a good divergence indicator, in very short timeframes for the intraday trader who wants to get that bounty.
Ladies and Gentlemen, This is Mark 47.

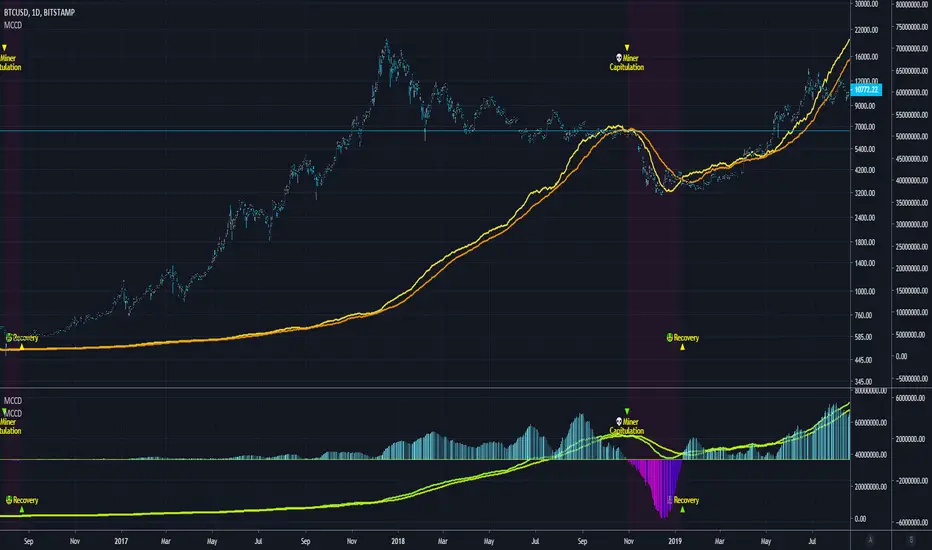
Blockchain Fundamentals - MCCD - Miner Capitulation Conv/Div🔗Blockchain Fundamentals - MCCD - Miner Capitulation & Convergence Divergence
(a.k.a. Hash Ribbons)
Intro
Miner Capitulation has been talked about alot recently in the news and on twitter. I wanted to join the in fun and add my own spin on things.
Description
This shows the 30 (yellow) and 60 (orange) day moving average of the hash rate of bitcoin. I added an option to show the convergence/divergence of the two moving averages in a visual manner similar to the MACD.
I also added the ability to select both the length and type of MA used in the calculation of the capitulation so you can experiment.
Other additions include bar coloration by trade state, and background highlighting of capitulation periods.
Editable Capitulation/Recovery plots will show clearly when the crosses happen.
The way to replicate my display is to add the indicator twice below the chart and combine in the same pane. First indicator displays the averages by default. The second one you enable convergence/divergence display option and uncheck the rest.
Last I add the indicator one more time and dragged it on chart. Do not combine the scales into one, of else it will ruin the scale (you want them separate scales). Its just showing you possibilities, use whatever works for you!
👍 We hope you enjoyed this indicator and find it useful! We post free crypto analysis, strategies and indicators regularly. This is our 73rd script on Tradingview!
💬Check my Signature for other information
(JS) Ultimate RSISo my goal here was to combine all of my RSI ideas into a single indicator in order to make kind of a "Swiss Army Knife" version of the Relative Strength Index ...
------------------------------------------------------------------------------------------------------------------------------------------------------------------------------------------------------------------------------------------------------------------
So, let's begin with the first RSI indicator I made, which is the RSIDVW (Divergence/Volume Weighted);
To rephrase my original post, the "divergence/volume weighted" portion is meant to expand upon the current RSI format by adding more variables into the equation.
The standard RSI is based off one value that you select (open, close, OHLC4, HLC3, etc.) while this version takes three variables into account.
The default setting is to have RSI normal without anything added to it (Divergence Weight = 0)
1st - it takes the standard variable that RSI normally uses.
2nd - it factors RSI divergence by taking the RSI change % and price change % to form a ratio. Using this ratio, I duplicated the RSI formula and created a divergence RS to be factored in with the standard price RS .
3rd - it takes Relative Volume and amplifies/weakens the move based upon volume confirmation. (So if Relative Volume for a price bar is 1.0, the RSI plot would be the same as it normally would)
So to explain the parameters
- Relative Volume Length: This uses the RV length you specify to determine spikes in volume (or lack of volume ), which then is added into the formula to influence the strength of the RSI move
- RV x Divergence: This is how I calculated the original formula, but you can leave this unchecked to turn Relative Volume off, or apply elsewhere.
- RV x RS: There's two sides, Divergence RS and Standard RS - these check marks allow you to select which part you prefer to be multiplied by Relative Volume .
Checking neither turns off Relative Volume , while checking both amplifies its effects by placing it on both sides of the equation.
-Divergence Weight: This controls how much the DVW portion of the formula influences the RSI plot. As I referred to earlier, default is 0 making RSI normal. The Scale is 0-2, so 1.0 would be the same as 50%.
When I do have DVW on, I generally set it to 0.5
-SMA Divergence: To smooth, or not to smooth, that is the question. UJsing an SMA here is much smoother in my opinon, but leaving it unchecked runs it through an RMA the same way standard RSI is calculated.
-Show Fractal Channel: This allows you to see the whole fractal channel around the RSI (This portion of the code, compliments of the original Ricardo Santos fractal script)
------------------------------------------------------------------------------------------------------------------------------------------------------------------------------------------------------------------------------------------------------------------
The next portion of the script is adding a "Slow RSI"...
This is rather simple really, it allows you to add a second RSI plot so that you can watch for crossovers between fast and slow lines.
-Slow RSI: This turns on the second RSI Plot.
-Slow RSI Length: This determines the length of the second RSI Plot.
------------------------------------------------------------------------------------------------------------------------------------------------------------------------------------------------------------------------------------------------------------------
Pivot Point RSI was something a friend of mine requested I make which turned out pretty cool, I thought... It is also available in this indicator.
-Pivot Points: Selecting this enables the rest of the pivot point related parts of the script
If Pivot Points isn't selected, none of the following things will work
-Plot Pivot: Plots the pivot point .
-Plot S1/R1: Plots S1/R1.
-Plot S2/R2: Plots S2/R2.
-Plot S3/R3: Plots S3/R3.
-Plot S4/R4: Plots S4/R4.
-Plot S5/R5: Plots S5/R5.
-Plot Halfway Points: Plots a line between each pivot .
-Show Pivot Labels: Shows the proper label for each pivot .
When using intraday charts, from a 15 minute interval or less the pivots are calculated based on a single days worth of price action, above that the distance expands.
Here are the current resolutions Pivot Points will work with:
Minutes - 1 , 2, 3, 5, 10, 13, 15, 20, 30, 39, 78, 130, 195
Hours - 1, 2, 3, 4, 5, 6
Daily
Weekly
Currently not available on seconds or monthly
------------------------------------------------------------------------------------------------------------------------------------------------------------------------------------------------------------------------------------------------------------------
Background Colors
Background Colors: I have six color schemes I created for this which can be toggled here (they can be edited).
Gray Background for Dark Mode: Having this on looks much better when using dark mode on your charts.
------------------------------------------------------------------------------------------------------------------------------------------------------------------------------------------------------------------------------------------------------------------
Now finally the last portion, Fibonacci Levels
-Fibonacci Levels: This is off, by default, which then uses the standard levels on RSI (30-50-70). When turned on, it removes these and marks fib levels from 0.146 through 0.886.
------------------------------------------------------------------------------------------------------------------------------------------------------------------------------------------------------------------------------------------------------------------
So the quick rundown:
Ultimate RSI contains "divergence/volume weighted" modifications, a slow RSI plot, pivot points , and Fibonacci levels all while auto-plotting divergence and having the trend illustrated in the background colors.
RSI has always been my "go to" indicator, so I hope you all enjoy this as much as I do!

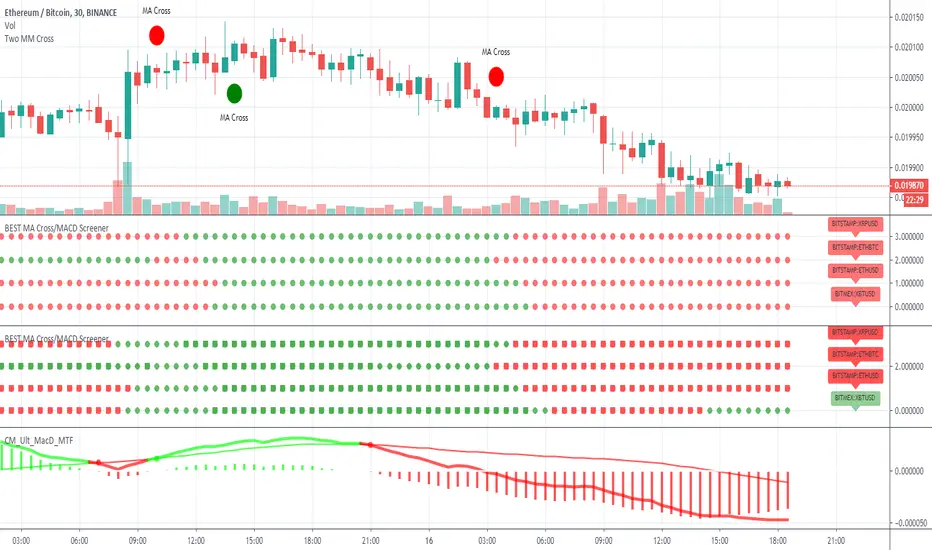
BEST MA Cross/MACD ScreenerHello traders
Continuing deeper and stronger with the screeners' educational serie one more time
I - Concept
This is the first flexible screener I'm releasing. Screener detecting a convergence whenever the MACD and MM cross are giving a signal in the same direction.
Those who know me from TradingView ... are aware that I'm big on convergences. I totally think that 1 indicator isn't enough - whatever the timeframe.
But building my own convergence detection systems has been fruitful for me
II - How did I set the screener
The visual signals are as follow:
- square: MACD + MA cross convergence.
- diamond: Only MACD is selected
- circle: Only MA cross is selected
Then the colors are:
- green when bullish
- red when bearish
Example
Below, I highlighted why we see diamonds on the top screener panel. This is because I only selected the MACD filter
Cool Hacks
Don't forget that you can add the same indicator multiple times on your chart :)
Wishing you all the BEST trading
Dave
[astropark] Bullish Bearish Divergences for all OscillatorsDear Followers,
today a new great Scalper Tool , which works excellent on all timeframes and charts , both FOREX and Cryptocurrencies!
It alerts you when a new divergence has been spotted on the chart based on your preferred oscillator or set of oscillators ( yes, you can combine them! )
Here the list of currently supported oscillators (more in the future):
RSI (Relative Strength Index)
MACD
MACD Histogram
Stochastic
Stochastic RSI
CCI (Commodity Channel Index)
Momentum
Volume Oscillator
OBV (On Balance Volume)
VWmacd
Bollinger Bands %B
William %R
Chaikin Money Flow
Chaikin Oscillator
AO (Awesome Oscillator)
DPO (Detrended Price Oscillator)
Ultimate Oscillator
RVI (Relative Volatility Index)
Klinger Oscillator
This script will let you set all notifications you may need in order to be alerted on each triggered divergence (both regular and hidden).
This script:
works on all timeframes , starting from 1 minute: so you can enjoy high-frequency trading by using a 24/7 running bot and a proper money and risk management strategy if you like
shows you both bullish and bearish divergences, both regular and hidden , with a triangle up or down respectively
lets you activate more than one oscillator at the same time
lets you choose to be alerted only if all active oscillators agree on spotted divergence , so you will get only stronger and more secure ones (you can set both all or at least a configurable number of enabled oscillators)
lets you edit basic configuration settings of each oscillator
lets you disable or enable hidden divergences on chart
This is a premium indicator , so send me a private message in order to get access to this script.

[astropark] Renko RSI divergencesDear Followers,
today a new great Scalper Tool , which works excellent from 1 minute timeframe Renko chart , which is the best and more secure timeframe to use on a Renko chart. But of course it works great on all timeframes (included the 1D timeframe)!
This tool has some cool features:
it works on all timeframes , starting from 1 minute: so you can enjoy high-frequency trading by using a 24/7 running bot and a proper money and risk management strategy;
it shows you both bullish and bearish divergences with a triangle up or down respectively
when it finds a strong bullish/bearish divergence , a flag will be displayed instead of a triangle
This script will let you set all notifications you may need in order to be alerted on each triggered divergence.
You may like to use it together with my Renko Scalper V2
On Bitmex/ByBit/Binance Bitcoin/USD chart best settings is Traditional Renko chart with 10$ box size, while 0.5$ box size is suggested on Ethereum/USD pair.
This is a premium indicator , so send me a private message in order to get access to this script.

Periodic Volume by Atilla YurtsevenPeriodic volume oscillator helps you to track volume of the selected period. Let's say you are analysing in 1H chart and your periodic volume is set to Daily. You can easily see what's the volume of the daily chart. You can select period from 1 minute to 1 month.
Disclaimer: This is not financial or investment advice
I often share ideas and scripts. Remember to follow me on TradingView to get notified.
Trade safe,
Atilla Yurtseven

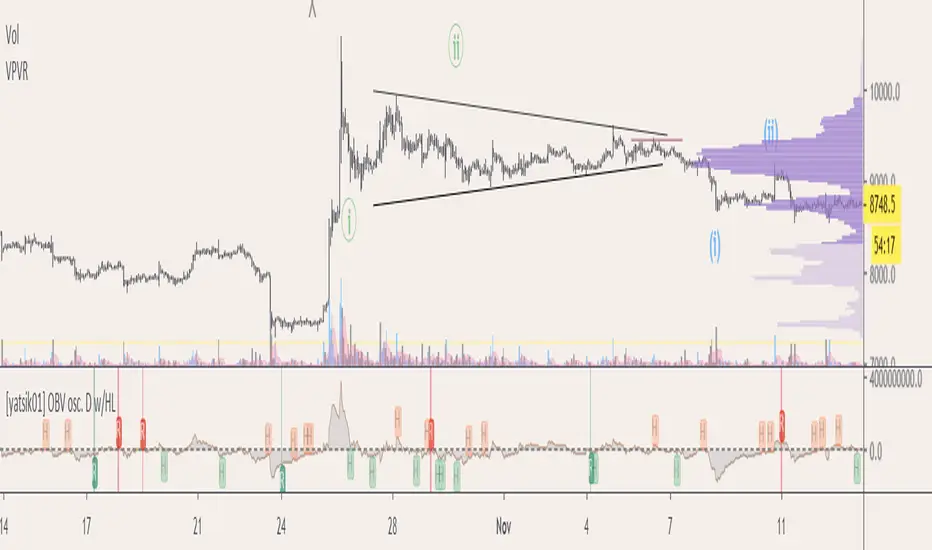
[yatsik01] OBV osc. D w/HLIndicator shows divergences between price and volume behavior. It has three options of showing divs in OBV osc. behavior, and OBV (Highs and Lows or Closes - are the sources). U can also turn on/off option of using premium index as additional criterion.
[SignalFI] Ox IndexWelcome. We're pleased to release 0x Index. This indicator is based on 7 separate indicators, which combine to make a weighted index of momentum. In addition, the signal is filtered with Ehlers constant with a super-smoother.
Said simply, this indicator is made to help spot STRONG divergences in price momentum in accordance with 7 separate indicators in one chart pane.
Source Indicators:
1) Time Correlation Ratio
2) Commodity Channel Index Ratio
3) RSI Ratio
4) Klinger Volume Oscillator Ratio
5) Money Flow Index Ratio
6) Fisher Transform Efficiency Ratio
7) Standard Deviation Ratio
Features:
1) Primary Trend line -- weighted index line of statistically relevant cross levels for each above indicator.
2) Trend Line Signal line -- lagging Primary Trend line average to denote strength of trend, and provide crossover signals
3) Trend Line / Signal line MACD -- similar to MACD in that this histogram tracks the delta between the Trend line and the signal line. Indicating strength of the trend relative to the lagging nature of the signal line.
4) Background Color 1 -- Provides secondary momentum coloring for trend to provide visual confluence with trend behavior.
5) Background Color 2 -- Provides additional momentum coloring for trend to provide enhanced visual confluence with trend behavior.
USAGE:
1) This indicator is primarily used as a divergence detector. When price top or price bottom is observed with a non-conforming top/bottom presented by the indicator a divergence can be assumed which indicates a change in trend.
2) This indicator can also be used as a pure momentum indicator, where pulses up or pulses down will denote price change. As an added benefit when trend are topping/bottoming out, the indicator will present a straight line (indicated by the color "white") which is a good time to take profit.
3) Divergences can be spotted on any time frame, and (currently) require manual drawing. Feature support to add auto divergence painting if possible given backtesting results.
EXAMPLE Divergences are provided on the chart included with this post.
SignalFI was created to help traders and investors to effectively analyze the market based on the Golden Mean Ratio (Fibonacci numbers), plan a trade and ultimately execute it. To help inform and educate market decisions we developed a set of Trading Indicators which are available on TradingView.
SignalFI indicators are just that, indicators. Our indicators are generally configured to use completely historical data (negating repaint), and we advise all alerts created with SignalFI indicators to be fired upon "close" of the current candle. Our indicators can provide valuable context and visualization support when performing market analysis and executing buy and sell decisions. However. we are not financial experts, and all information presented on this site or our other media outlets are for educational purposes only.

Ori Visual MACDMACD is about a relationship between two Moving Averages. Visual Macd draws these two moving averages and shows MACD with color on them. It is helpful for understanding MACD.

Divergence DetectorThis indicator is meant to trigger your attention to possible regular divergences.
As soon as the indicator prints a red or green background, a bearish or bullish regular divergence could have formed.
The divergence is determined between the close values of price and the corresponding values of the underlying plotted baseline indicator.
As baseline, you can use RSI, CCI, MACD, RVI, and OBV.
For each of them, you can tune their classical parameters.
They are initially set to the default periods:
RSI(14), CCI(14), MACD(12,26), RVI(10). OBV has no params.
The detection algorithm uses a tunable window length at a default optimal value of 21.
I would classify this indicator as advanced, and I suggest its use by experienced traders only.
Divergences can be extremely profitable but can destroy your account if you are not cautious. When the indicator detects a possible divergence be sure to check with your eyes. In fact, sometimes a spurious divergence is signalled because of the finite window size.
The algorithm I use in this indicator is brand new and based on a simple but tricky concept. I'm still working to refine it such to detect hidden divergences as well.
This indicator can be used on any TF, *BUT* be sure to use a volume filter for TF under H1, such to avoid low volume periods (e.g., during the Asian range).
You could find my "Volume Volatility Spectrum" or "ATR volatility spectrum" well suited for that purpose.
I've seen a multitude of paid indicators for detecting divergences, some of them not cheap at all. This one is free and it works fairly well! Enjoy it, and use it at your own risk.

Double Smoothed Stochastic RSI [ChuckBanger]This is a double smoothed stochastic RSI . Stoch RSI is a very good indicator but it can sometimes give the trader false indications because of its jagged (noisy) motion. There is a lot of filters out there that can give a good result but it very often it also adds unacceptable lag. And lag is delaying your decision-making.
This filter is ideal to clean up common technical indicators like stoch RSI , Willams %R or whatever your favorite oscillator you have. The chart here is just an example for demonstrating purposes. But it gives the user a visual representation of how it can look like. And it works on all time frames and markets you can think of...

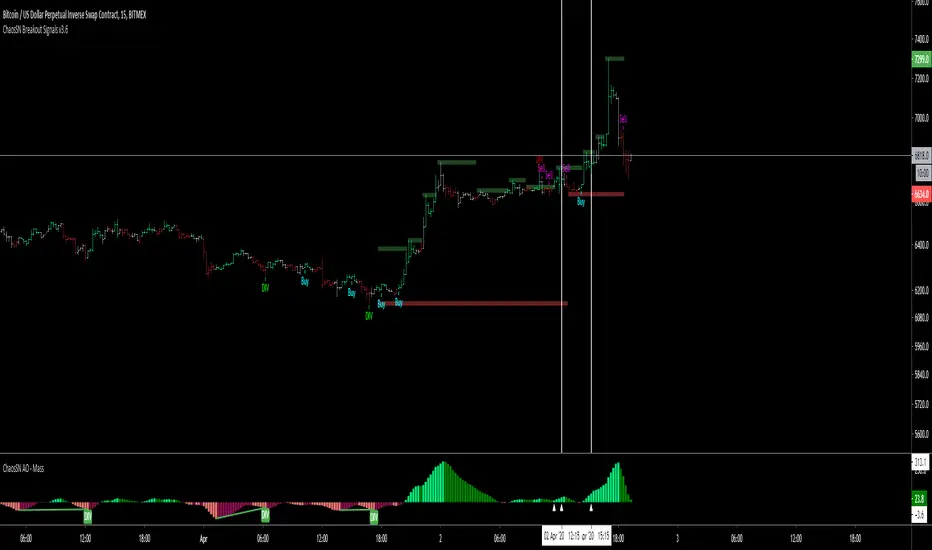
ChaosSN-AOAwesome Oscillator (AO) determines market momentum at a given time on the last 5 bars, comparing them to the momentum on the last 34 bars. There are many ways it can be used but in a nutshell, it quickly shows the current bearish/bullish trend (green = bull, red = bear).
The background is highlight red/green to highlight bars matching the "Saucer" criteria (1 of the many ways it can be used)
Awesome Oscillator Saucer buy signal:
Generated when the histogram which is above the zero line changes its direction from falling to rising. Once the signal has been generated, place a Buy Stop one tick above the high of the price bar that's highlighted. The most recent saucer signal cancels all previous ones (do not forget to delete pending orders after the signal is cancelled).
Opposite is true for an AO "Saucer" sell signal.
MAC-Z VWAP with divs & MACD Leader [ChuckBanger]This script is VWAP version of my MAC-Z indicator:
Right now it is my personal favorite. You can use it to spot divergences in both histogram and on the MAZ-Z line. You can also trade the MAC-Z line and its signal line crossovers. It also has MACD Leader crossover built in. MACD leader crossovers is indicated with a vertical line. Green for bullish and red for bearish.
Other signals
Green + = Bullish Divergence (Strong signal)
Red - = Bearish Divergence (Strong signal)
Green + = Hidden Bullish Divergence (Weak signal)
Red - = Hidden Bearish Divergence (Weak signal)
Green dot = Histgram crosses over zero line (Bullish signal)
Red dot = Histgram crosses below zero line (Bearish signal)

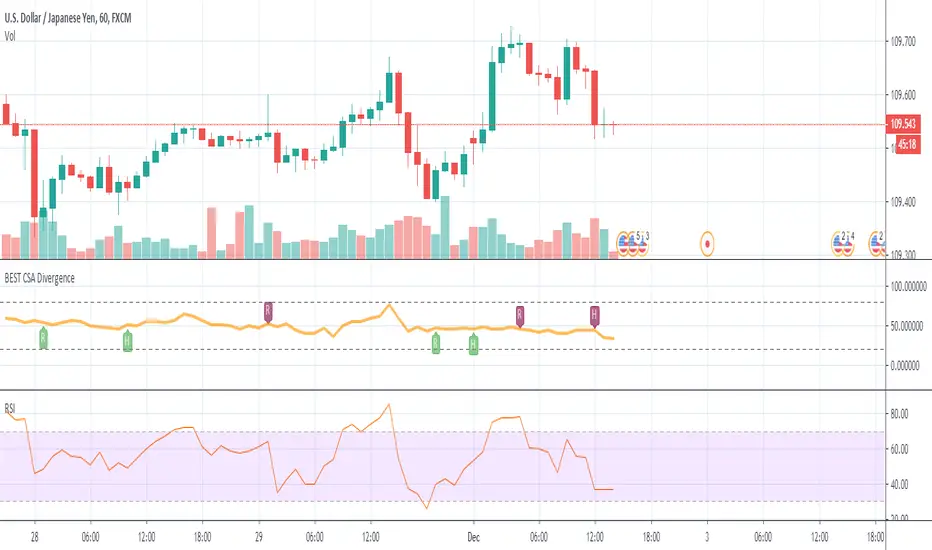
BEST Currency Strength Indicator DivergenceHello traders
Hope you had a great Thanksgiving
Now it's my turn to give and all I ask in return is you to be thankful (did I get the "Thanksgiving" thing right?)
The Currency Strength Indicator plots an average of the selected FX pairs in the indicator.
Someone asked me if I could develop an alternative of that script adding a divergence component.
The script evaluates the divergences between the average of the selected RSI(FOREX pairs) and the RSI(FOREX pair) displayed on the chart.
This version includes new features such as:
- the RSI length can now be selected
- we can select the 6 pairs used for the divergence calculations
All the BEST my aspiring traders and quants
See you tomorrow for another script
Dave