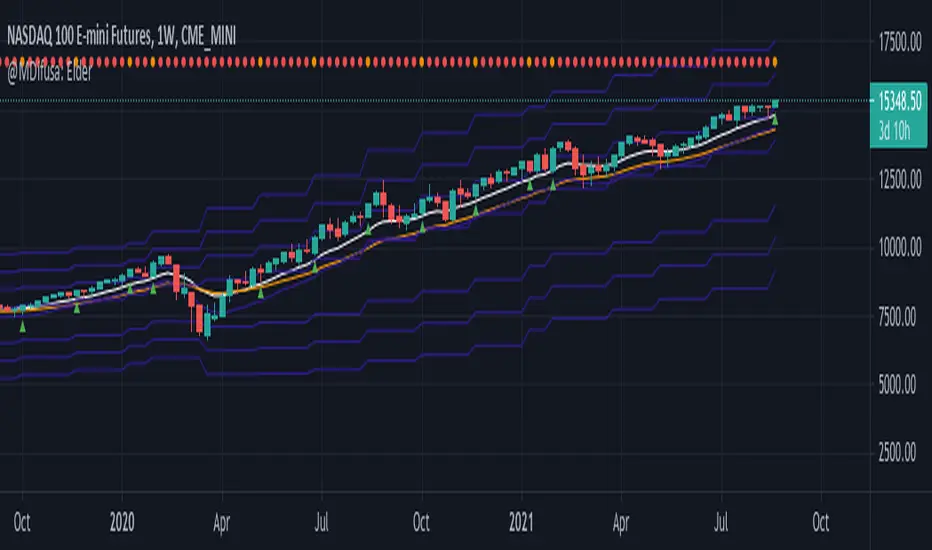
Elder EMA, ATR & MACD Indicator, 5X Time Frame & Divergences.This indicator is elaborated following the 3 window strategy described by Elder.
The fast, slow averages and MACD histogram are taken from a time frame 5 times higher than the active time frame and indicate bullish / bearish trends as well as divergences (bottom) of the hostogram with the price.
Divergences
Divergence Histogram for Many IndicatorHello Traders,
This script analyses divergences for 11 predefined indicators and then draws column on the graph. Red columns for negatif divergence (means prices may go down or trend reversal), Lime columns for positive divergences (means prices may go up or trend reversal)
The script uses Pivot Points and on each bar it checks divergence between last Pivot Point and current High/Low and if it finds any divergence then immediately draws column. There is no Latency/Lag.
There are predefined 11 indicators in the script, which are RSI , MACD , MACD Histogram, Stochastic , CCI , Momentum, OBV, Diosc, VWMACD, CMF and MFI.
Smaller Pivot Point Period check smaller areas and if you use smaller numbers it would be more sensitive and may give alerts very often. So you should set it accordingly.
There is "Check Cut-Through in indicators" option, I recomment you to enable it. it checks that there is cut-through in indicators or not, if no cut-through then it's shown as valid divergence.
You should see following one as well if you haven't yet:
Enjoy!

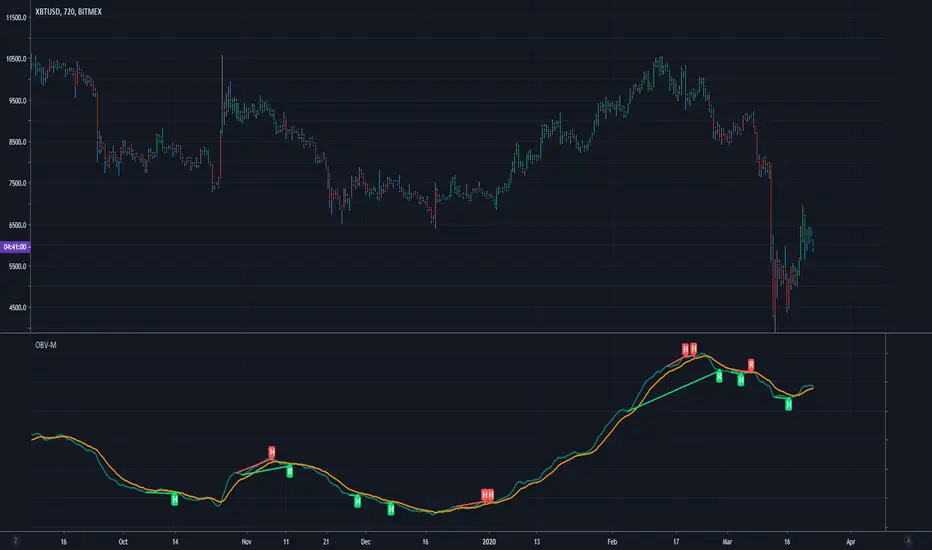
Modified OBV w/ Divergence Detection by CryptorhythmsApirine OBV-M Modified OBV w/ MA Selection by Cryptorhythms
Intro
Released in the April 2020 issue of TASC, and created by Vitali Apirine.
Description
OBV-M is of course based on the classic indicator on balance volume originally developed by Joe Granville. Apirine then smooths the calculation and adds a signal line to help denote entry and exit points.
As the author points out uts also great at showing divergences!
Extras
As usual when porting indicators to the library here on tradingview, I like to add some extra flare!
💠MA selection to allow you to experiment with alternate settings
💠Bar coloration based on trade state for easy visual at a glance chart checking
💠Divergence Detection and plotting thanks for Ricardo Santos' script
Enjoy!
👍 We hope you enjoyed this indicator and find it useful! We post free crypto analysis, strategies and indicators regularly. This is our 78th script on Tradingview!
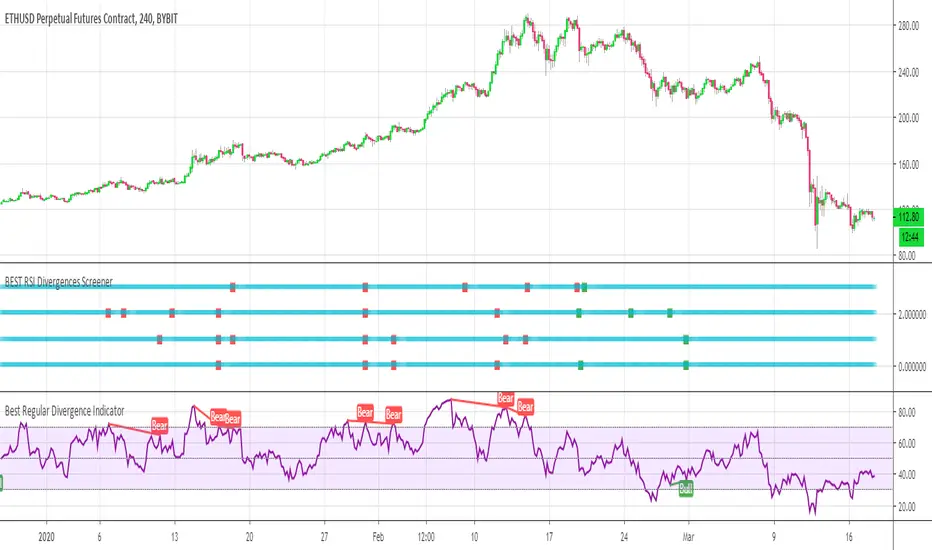
BEST RSI Divergences ScreenerHello traders
I hope you're all hanging on at home with what's going on these days...
The good news is.... it gives us more time to trade ^^.... #positive #attitude
I - Concept
This screener detects whether the regular RSI divergences based on the TradingView Divergence built-in indicator (made by the gentleman @everget I believe)
With this screener, you can see in 1 view which of your favorite cryptos/stocks/forex pairs/etc. showing strong divergences
The gentlemen (and demoiselles) traders can play with the lookback/ranges inputs to adjust the divergences based on what they think is best of their trading/timeframe/instrument/life
On that script screenshot, I'm showing the BYBIT:BTCUSD part of the screener matching with the divergences on the chart
II - How did I set the screener
The visual signals are as follow:
- square: whenever a divergence is detected
Then the colors are:
- green when there is bullish regular divergence
- red when there is bearish regular divergence
Best regards
Dave
RSI + DivergencesHi Guys,
This indicator gives you the trend changes (Designed with the basics of Vash's RSI advanced and the Fikira divergence indicator)
This indicator will only give you regular divergences.
Please keep in mind that a trading plan is not only built with momentum but also with location and structure.
Good trading,

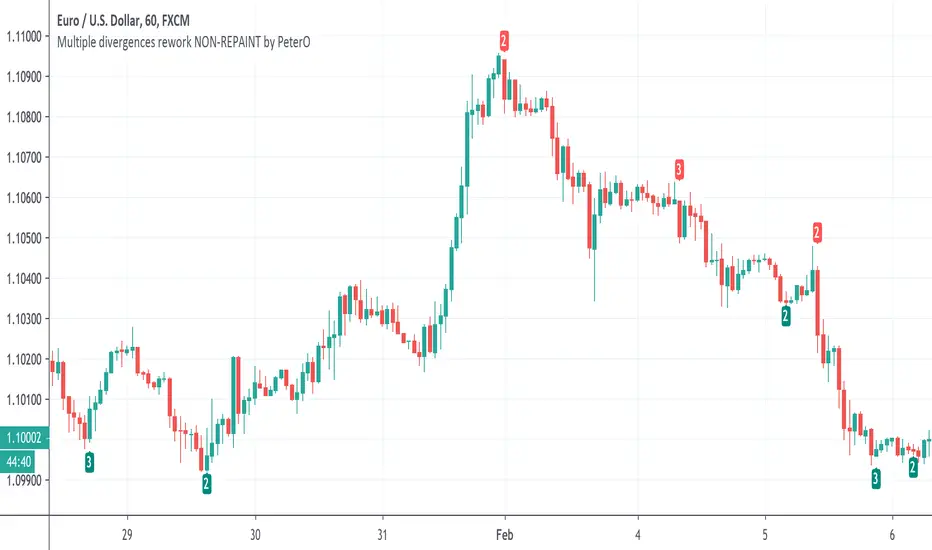
Multiple divergences NON-REPAINT by PeterODivergences are well-known tool for finding trend reversals. Powerful, yet... unreliable. Sometimes they show up, sometimes they don't. Sometimes they really mean trend end, sometimes the trend continues. I've witnessed countless discussions about which indicator to hunt for divergences on. All pointless.
Earlier today I found a very inspirational script by Lonesometheblue, combining multiple divergences together. Actually - summing them up and showing hunted divergences count in a label. Because if a divergence shows up on a single indicator like RSI, it can indeed mean trend reversal, but... yeah, check previous pargraph. But if this divergence shows up on 8 different indicators at the same time, then chances increase, don't they?
I decided to do my own version of Lonesome's indicator, because that one is using Label.New, which doesn't allow analysing entire script, only latest 50 occurences or so. I'm not going to hide it - I copy-pasted a lot from Lonesome's code. And from Everget's built-in divergences script, which you can find in PineScript/New. I didn't even bother to modify variable names or cover tracks in any other way, pretending it is my work from scratch. All with these two gentlemen consent and blessing. I added labels from myself, plus bit of rework and here it is:)
I hope you'll find it useful.
P.S. While analyzing divergences today, I discovered one thing. Hidden divergences are not useless, as many people think. But they should be used at trend dips to join the trend, not at trend ends, as reversals. Experiment yourself.
P.S.2 Still, never use only divergences. They need confirmation, they are not self-fulfilling prophecy.
[fikira] Divergences (RSI)This script can be used with candlesticks, accompanied with " RSI + Divergences"
The calculation is different than my "Divergences (Pivots)"
Thank you!

[fikira] MACD & RSI+Stoch + DivergencesThis is a new version of my "Divergences"
Compared to my "Divergences (Pivots)", this is calculated totally different
There are 3 options:
- MACD
- RSI
- Stoch RSI
Since this script is very heavy in calculation it is limited in time (= inspired from a script of "Che_Trader")
Also it uses "max_bars_back" (=1000)
For MACD and Stoch RSI there is a "custom Divergences Period", which compares more then 7 Pivot Points,
the higher the number, the less reliable, it is not necessary to use this, but it is there,
also you can change the "leftbars" and "rightbars", again, it is not necessary to change, but you can...
Linewidth and style of the Divergences lines can be changed
Thank you!

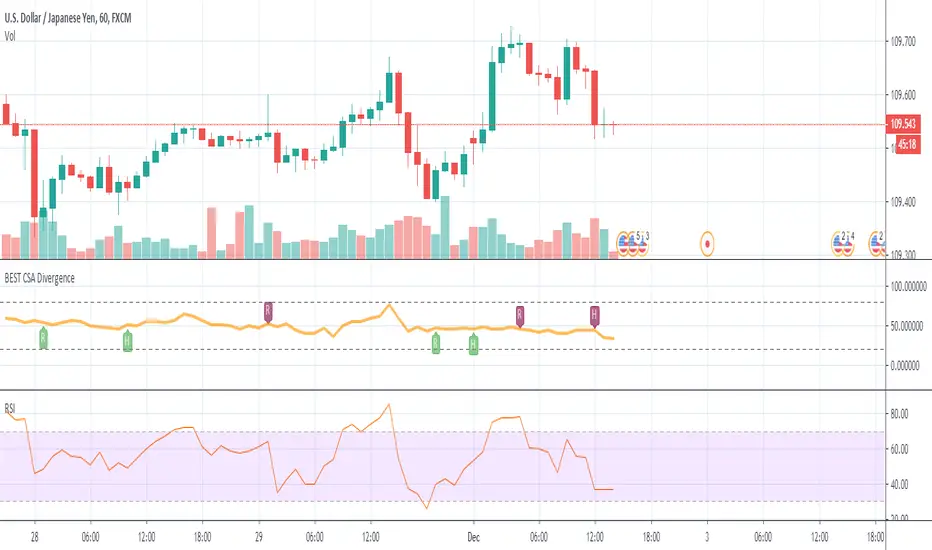
BEST Currency Strength Indicator DivergenceHello traders
Hope you had a great Thanksgiving
Now it's my turn to give and all I ask in return is you to be thankful (did I get the "Thanksgiving" thing right?)
The Currency Strength Indicator plots an average of the selected FX pairs in the indicator.
Someone asked me if I could develop an alternative of that script adding a divergence component.
The script evaluates the divergences between the average of the selected RSI(FOREX pairs) and the RSI(FOREX pair) displayed on the chart.
This version includes new features such as:
- the RSI length can now be selected
- we can select the 6 pairs used for the divergence calculations
All the BEST my aspiring traders and quants
See you tomorrow for another script
Dave
OBV Divergence +This study Plots Divergences for OBV along with 2 MA's
Choose between standard type of OBV and OBV Accumulation / Distribution thanks to spacetrader which seems to be a truer reading
Divergence Alerts are provided so that you dont have to stare at your screen all day

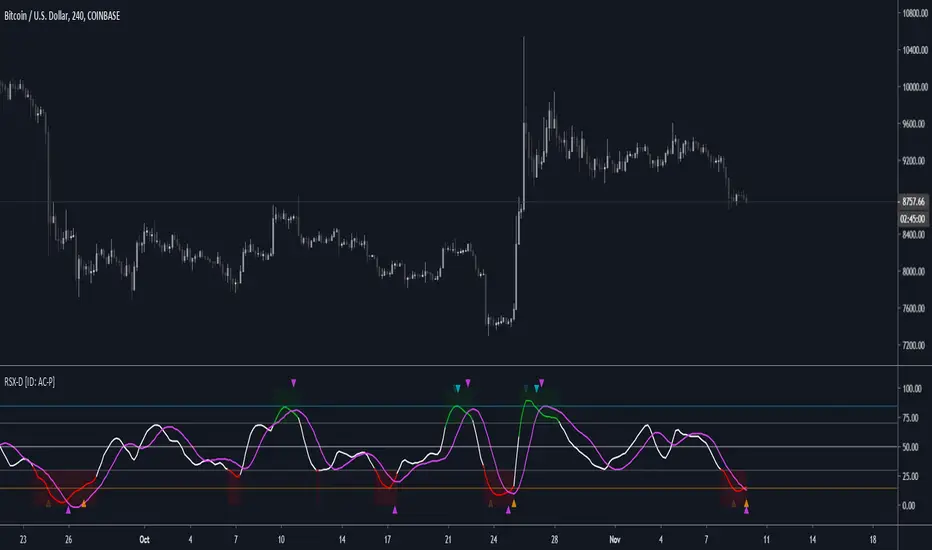
RSX-D [ID: AC-P]The "AC-P" version of Jaggedsoft's RSX Divergence and Everget's RSX script is my personal customized version of RSX with the following additions and modifications:
LSMA-D line that averages in three LSMA components to form a composite, the LSMA-D line. Offset for the LSMA-D line is set to -2 to offset latency from averaging togther the LSMA components to form a composite - recommended to adjust to your timeframe and asset/pair accordingly.
Divergence component from JustUncle, RicardoSantos, and Neobutane divergence scripts
Crossover indication and alerts for Midline, and custom M1 and M2 levels for both RSX and the LSMA-D line from Daveatt's CCI Stochastic Script
EMA21/55 zone cross highlighting option
SMA9/EMA45 MA option from my RSI sma/ema Cu script
Libertus Divergences and Pivot labels from Jaggedsoft's RSX Divergence script are hidden/off by default
Designed for darkmode by default. Minor visual changes from Jaggedsoft's and Everget's script(s) for darkmode and visual aesthetic.
Please Note:
Divergences that use fractal-based detection logic, offset, or a combination of both generally have a 1-2 bar/candle lag. This is an INHERENT limitation of divergence detection with fractals and offsets. Divergences generally will have a higher strikerate on HTF than LTF due to the 1-2 bar lag. While I'm not going to rule out a programming solution or math construct/formula that attempts to alleivates the 1-2 bar lag for divergences, this script is not it - please keep that in mind when using divergence components with a fractal base and offset.
LSMA-D is a composite of three LSMA lines, all with offset options. Different lengths and Offset values can compensate/adjust for the smoothing/latency from RSX, but only up to a certain point. For each LSMA, the least square regression line is calculated for the previous time periods, so the idea is that with finely tuned adjustments, you can get crossover/crossunder signals from the RSX with the LSMA-D line that you simply can't get with the SMA9/EMA45 due to the already smoothed RSX.
The defaults for the RSX and various components for the LSMA-D here will MOSTLY LIKELY NOT WORK OR BE APPLICABLE to every timeframe and asset that you trade - adjust, backtest, and test accordingly. The defaults are here are MEANT to be adjusted to the asset class and timeframe that you are trading.
If you're not familiar with the LSMA, tradingview author Alexgrover has a few great scripts that go into detail how the LSMA works, in addition to different interpretations and implementations of the LSMA.
References/Acknowledgements:
//@version=4
// Copyright (c) 2019-present, Alex Orekhov (everget)
// Jurik RSX script may be freely distributed under the MIT license.
//
//-------------------------------------------------------------------
// Acknowledgements:
//---- Base script:
// RSX Divergence — SharkCIA by Jaggedsoft
//
// Jurik Moving Average by Everget
//
//---- Divergences/Signals:
// Libertus RSI Divergences
//
// Price Divergence Dectector V3 by JustUncle
//
// Price Divergence Detector V2 by RicardoSantos
//
// Stochastic RSI with Divergences by Neobutane
//
// CCI Stochastic by Daveatt
//
//---- Misc. Reference:
// RSI SMA/EMA Cu by Auroagwei
//
// CBCI Cu by Auroagwei
//
// Chop and explode by fhenry0331
//
// T-Step LSMA by RafaelZioni
//
// Scripts by Jaggedsoft for structure and formatting
// Scripts by Everget for structure and formatting
//-------------------------------------------------------------------
// RSX-D v08
// Author: Auroagwei
// www.tradingview.com
//-------------------------------------------------------------------
Divergences multi timeframeMT div monitor, add your own input for divs under expressions. Add them to the original bulldivs or beardivs with +. Set div_threshold in inputs.

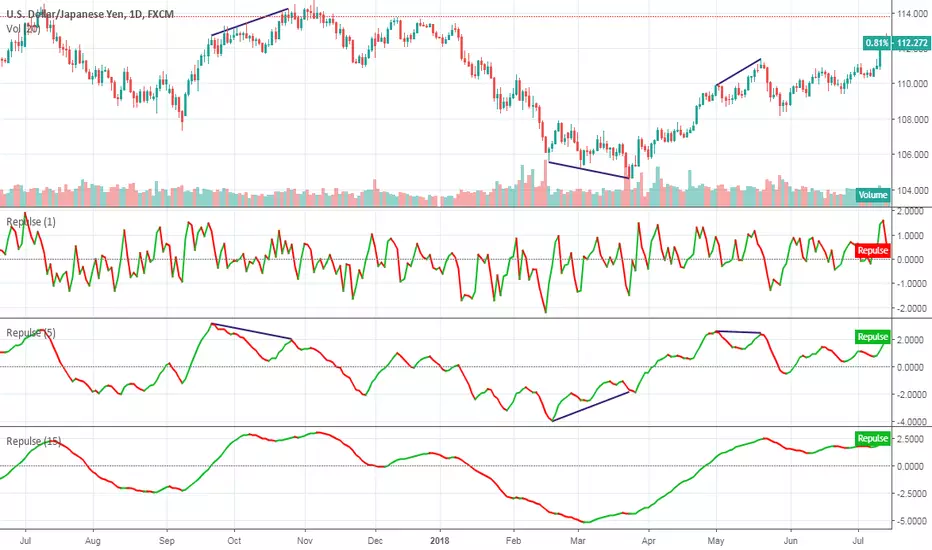
RepulseThis indicator was originally developed by Eric Lefort, a professional trader and author from France.
It gauges and displays the bullish or bearish pressure.
Like and follow for more open source indicators!
Happy Trading!
Relative Strength Index - Divergences - LibertusHello all,
To ease everyone's trading experience I made this script which colors RSI overbought and oversold conditions and as a bonus displays bullish or bearish divergences in last 50 candles (by default, you can change it).
Script is open source, part of code is from Trading View examples. If you have suggestions or you already made some improvements, please report in comment.
Happy trading and good luck!

Stochastic RSI with DivergencesTook my other Log RSI script and plugged in Stochastic RSI to see how divergences play on an oscillator with two lines. Turns out divergences are good at predicting changes in the oscillator but that doesn't mean that the oscillator will always mimic price action.
Log vs. no log is virtually the same.
Credits to
@fskrypt for introducing geometric mean
Divergences by @RicardoSantos (@JustUncleL's edit)

Fisher Transform Ribbons Indicator V1.0Utilizing the Fisher Transform by Ehlers with different lengths based on multipliers will allow you to notice movements in price and understand whether the shift was a correctional wave, or part of the overall trend.
To learn about Fisher Transform , check out the Fisher Transform documentation: www.mesasoftware.com
Fisher has plenty of functionalities. Ribbons provides you with a view of consistency in price action. If all ribbons flip, generally this is a strong signal that the trend is changing. Fisher is extremely punctual (minimum input lag) and robust (doesn't miss movement). Look for everything, including divergences, trends, and Oversold, Overbought points.
Changing length will further provide you more sensitivity in overselling and buying, while numbing chop.
Enjoy!
And for a single Fisher, check out HPotter's Fisher Transform or LazyBear's implementation of the inverse of the Fisher, which has many other interesting properties

Bats Bearish Divergence Detector (BRED-)After the release of BUBD+ here comes BRED- for calling the tops.
6 indicators are tested for the presence of any bearish Divergences and are plotted on chart as soon as they are.
Note - Price can move up after bearish divergence as well so its not foolproof. However multiple bearish divergences signify that bulls are losing power and price might reverse downwards.
Instead of blindly trusting the divergence on this indicator I suggest that you use this as a tracking mechanism instead. Once you spot a bearish divergence here, go to the oscillator that was called by the indicator and see the strength of the divergence involved.
This way you dont have to look at the indicators for divergence all the time, just only when the indicator calls for it. (Note that different timeframes will have different divergences so make sure you watch most of them. Higher timeframes indicate larger potential reversals)
Colour -
MACD- Aqua blue
RSI - Red
Stoch RSI - pink
CCI - Orange
MFI - Teal (Blue)
RVI - Silver
If you want to change the number of indicators you can do so from the bottom and remove the indicators you dont want to see by commenting them out.

Stefan Krecher: Jeddingen Divergence v2This is an update to my script:
Stefan-Krecher-Jeddingen-Divergence/
The behaviour is exactly the same, I just added the option to create alerts based on this indicator

