Volume Divergence by MMIt's a simply volume indicator. You should watch for breaks on both volume uptrend and volume downtrend. It uses fibonacci numbers to build smoothed moving average of volume.
Also you can check divergences for trend reversal and momentum loss.
Downtrend

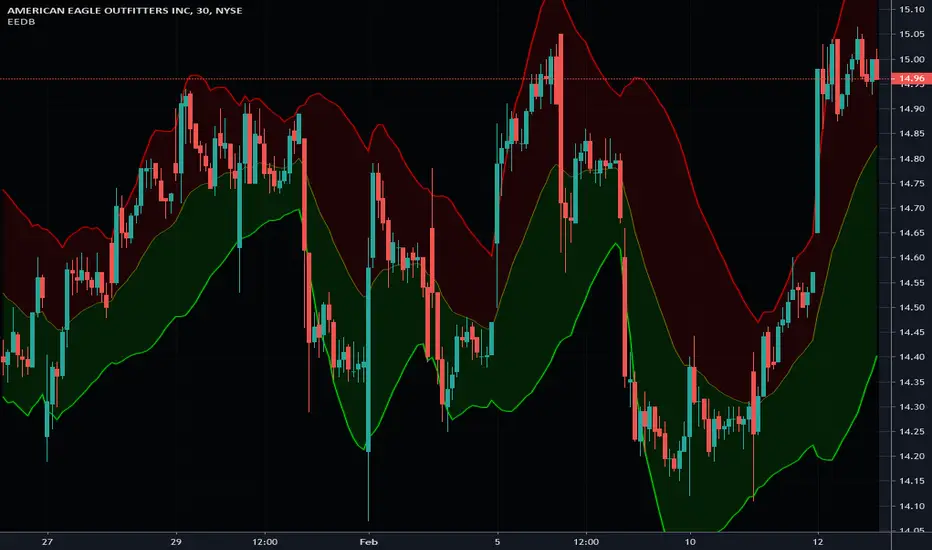
Enhanced Exponential Deviation Bands - Vitali ApirineEverybody has heard of Bollinger banding right? Well, if you are looking for those, you have come to the wrong place. This is something very similar though! These are "Enhanced Exponential Deviation Bands" in the overlay panel employing PSv4.0, originally devised by Vitali Apirine for an article in TASC - July of 2019 Traders Tips. This indicator is freely available for all members to use.
The comments section below is solely just for commenting and other remarks, ideas, compliments, etc... regarding only this indicator, not others. When available time provides itself, I will consider your inquiries, thoughts, and concepts presented below in the comments section if you do have any questions or comments regarding this indicator. When my indicators achieve more prevalent use by TV members, I may implement more ideas when they present themselves as worthy additions. As always, "Like" it if you simply just like it with a proper thumbs up, and also return to my scripts list occasionally for additional postings. Have a profitable future everyone!
BOSS Smooth Stochastic Bull/Bear Oscillator With Alerts THE BEST FOREX, BINARY OPTIONS, AND CRYPTO INDICATORS FOR TRADINGVIEW.COM
Short Entry
During a price downtrend and you get a sell signal (red dot) enter short when the "K" line (green line) drops below 65 (mid upper band).
Long Entry
During an uptrend, buy when you get a long signal (green dot) and "D" line (red line) rises above 35 (mid lower band) .
Bull/Bear
Green background indicates bullish price action (uptrend)
Red background indicates bearish price action (downtrend)
Available At bosscripts.com
Website bosscripts.com

Pin Bar-Trading RoadMapPin bar- Trading RoadMap
Simple Script to show
Up Pin Bar = Yellow
Down Pin Bar = Black
The Pin Bar Criteria:
- The Shadow ≥ 2 X Body
- Open And Close In The Top 33%
Have a peaceful and profitable trading day 😊
Khaled Maziad

Helios v1.0 - by @cryptomrdavis -1.0
This is another indicator for you guys. From different indicators its get the signals and combines them into one.
Green marks an uptrend and red an downtrend.
Happy trading
+++ use this tool on your own risk. i'm not responsible for your loses. DYOR +++
____________________________________________________________________________
BTC: 1GVRDK3HHr9CKM5SF2CGpCNXFuavB3L4j9
ETH: 0x7b825fa752b9926D3E8397cDb1d9E5473D074646
XMR: 41zL2SQS7zyZmwXKng2TeUWsMi5vMmkgSdDCjULUTvM6ichwm1E2ZDEYGt56zk9ghoM9bekhjycSwa8amtTcB2JiUet5jtg
NEO: AXja5xPDhczfm2ujHyBfpkQAAnMsXsazmb
TRX: THi1L1v2wHJxmQg6Wk9TgkKLcP6x2oMAwf
ZEC: zcZzFkRx95cp7MtuW8wLhC5zz5RYF9QkT2uPPmhZZHc6ppXepHGgCSeAS1rtD6WFdqsM5p1gZm2gfirnrnviucsdP4aCpqU
XLM: GAXUQJSW55C7MAC4GI26NZUGIKSHFDVFRFKZCXPLMPY4HCADSDT55XK6
WAVES: 3PCMkNpMHxSraTCkwV1ENcBKa9sXbVCGjQX
BCH: qz57n04ud6mn42u00aymqkku8tfh0lk4jv9c28mjvv
tippin.me
____________________________________________________________________________

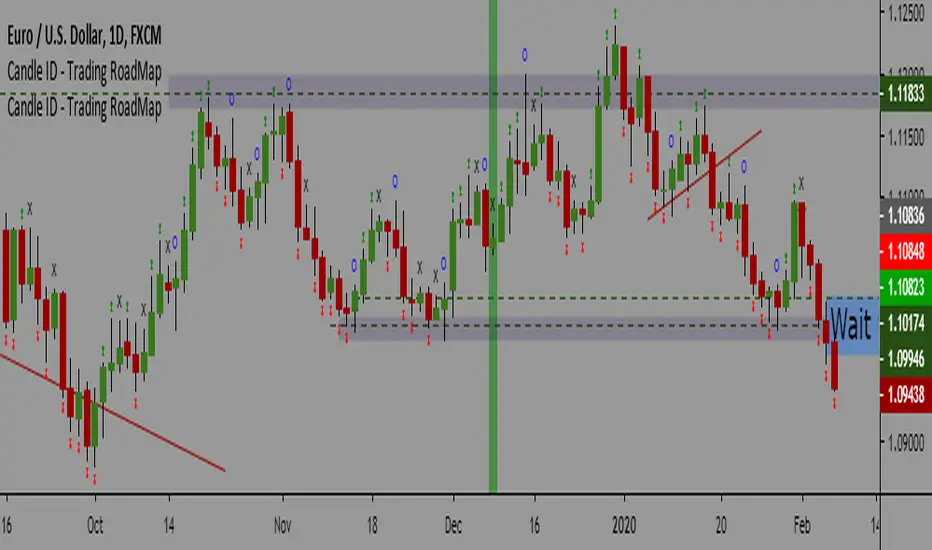
Candle ID - Trading RoadMapCandle ID- Trading RoadMap
Simple Script to show
- Inside Bar
- Outside Bar
- Up Bar: Bar with a Higher Hi in comparison to the previous bar
- Down Bar: Bar with a Lower Low in comparison to the previous bar
Have a peaceful and profitable trading day 😊
Khaled Maziad
Pullback Trading [Fhenry0331]The indicator is taken from Alexander Elders "Triple Screen System," minus using the Weekly MACD as a filter/trend. I believe waiting for the force index and the weekly MACD histogram to line-up is uber conservative and a trader will miss too many signals (In my opinion).
The indicator is for a pullback trader. A trader that waits for a trend to develop then enters on a pullback.
The indicator defines an uptrend start: as the 13 ema crossing above the 26 ema. It defines a downtrend start: as the 13 ema crossing below the 26 ema.
The pullback in an uptrend: 13 ema is above the 26 ema. Elders-Force-Index is below the zero line. Price low has crossed below the 13 ema (one can also say price closes below the 13 ema if they so wish).
The pullback in a downtrend: 13 ema is below the 26 ema. Elders-Force-Index is above the zero line. Price high has also crossed above the 13 ema.
Please note that the pullback signals do not necessitate an automatic buy or sell (the instrument can be still pulling back deeper and not ready to resume it's trend.) One should place orders above (long) or below (short) bars with the pullback signals. Do so on signals until orders are filled.
Although the indicator is meant for pullbacks one can make an aggressive entry at the onset of a crossover of ema's.
For clarity background colors has been added to the indicator.
works well on daily time frame. Also look at intraday (5) minute time frame on trending stocks (news, earnings, volume, etc.)
Keep It Simple.
Enjoy!

Bitfinex dominion V2With this indicator you can check the current tendency of a crypto pair from Bitfinex.
It will tell if the market is in bullish or bearish mode.
That can be an extra layer of analysis to make your decision.
You will see it will swap from red, dark red to green or dark green. The more bright the color is, the more you will see the tendency is strong.
PS: Take in consideration this indicator doesn't follow the price shown by tradingview. So it's not useful at all to decide to go LONG or SHORT based on what this indicator shows and what tradingview price ( candlestick ) shows. It's more a market direction indicator...

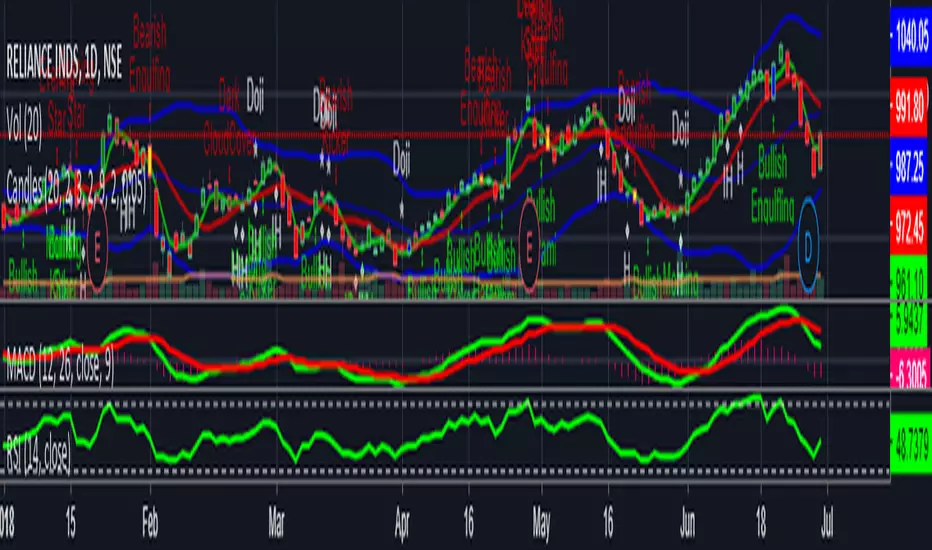
CandlesThe default script has: Bolinger Bands, Moving Average and Doji , Bearish Harami, Bullish Harami, Bearish Engulfing , Bullish Engulfing , Piercing Line, Bullish Belt, Bullish Kicker, and Bearish Kicker. The Piercing Line, Bullish Belt, and the Kickers will usually show up better in the daily charts.
Please note if moving average SMA (green line) crosses above SMA (red line) is uptrend , stock price will move up gradually. If suppose moving average SMA (green line) crosses below SMA(red line) is downtrend, stock price will move down. Also please validate with MACD & RSI for reference will get more clarity.
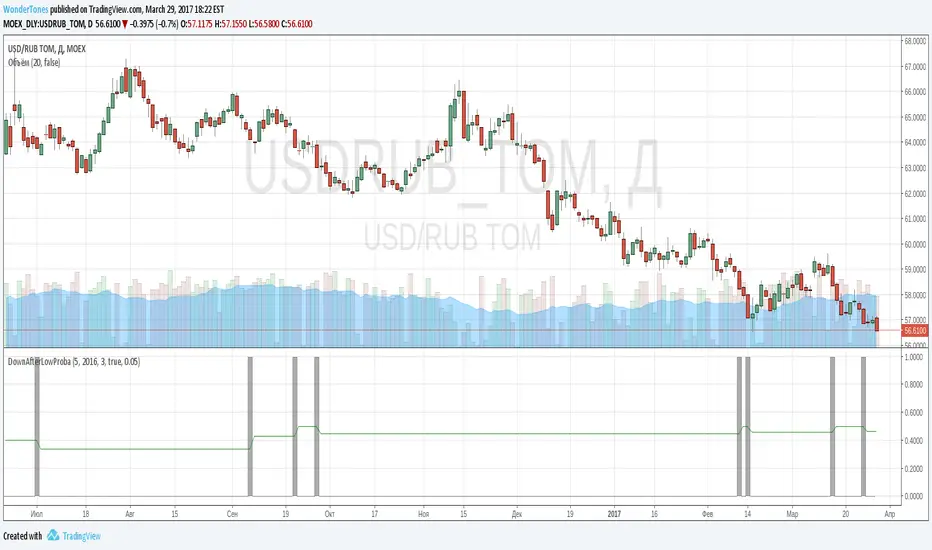
DownAfterLowProba// The script is useful to inspect probability:
// If previous day closed at lowest price for several days
// how often next day would be red bar
// As one can see gray lines indicate bars with lowest close. If next bar is green, increment diff_hi, overwise increment diff_lo
// Probability is counted as diff_lo / (diff_hi+diff_lo)
// One can copy script and change conditions to count other interesting probabilities
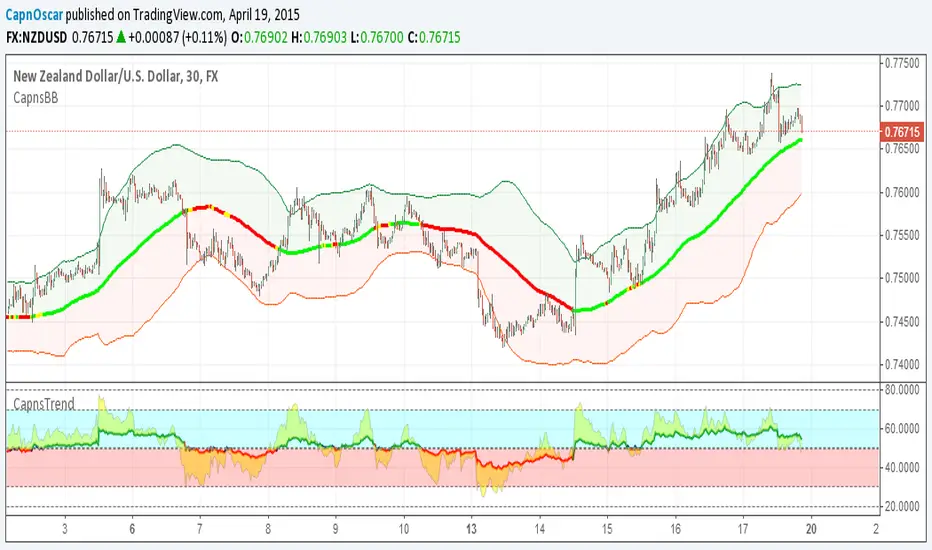
Stock Market Trend Analysis Trading System 101 (by ChartArt)This is a very simple trading system which is measuring the core of uptrends and downtrends using three basic elements: Close price, HL2 price, Pivot price.
Depending if the uptrend or downtrend is strong, the buy/sell signals are shown in different colors. The stronger trends are in brighter colors (lime and fuchsia). If the trend just fully changed direction from uptrend to downtrend (or vice versa), there is a background color highlight in the color of the new trend direction.
The trend detection should work best on monthly charts. I have created this in under an hour. My goal was to use the least amount of rules possible, therefore there are many false signals and the code is quite lazy.
You can lose all your money if you rely on these buy/sell signals!

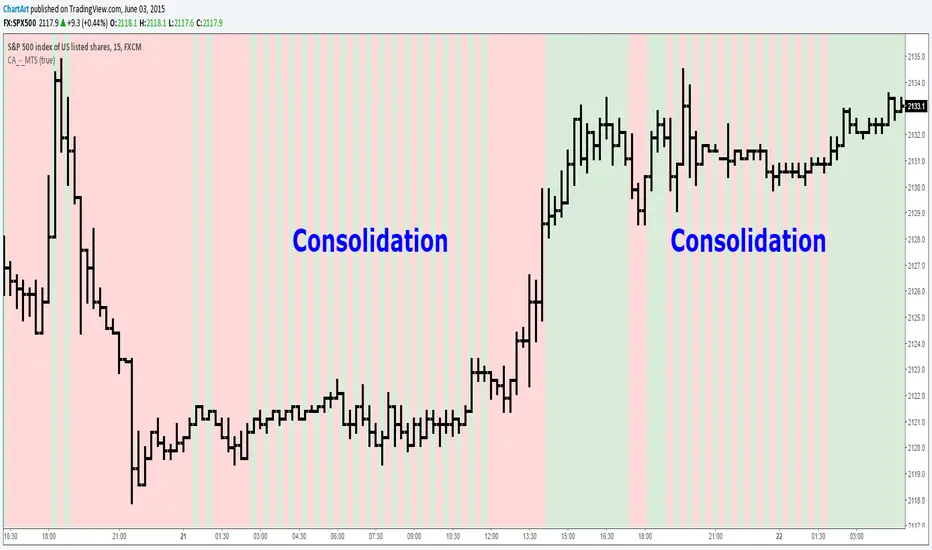
Market Trend Strength (MTS) (by ChartArt)See the current trend strength of the market. An additional filter makes trend consolidation areas visible. The color changes there each bar back and forth between green and red.
This area was interesting. Would have been a better example:
If the filter is deactivated the indicator shows the last measured price trend (green for up and down for red).