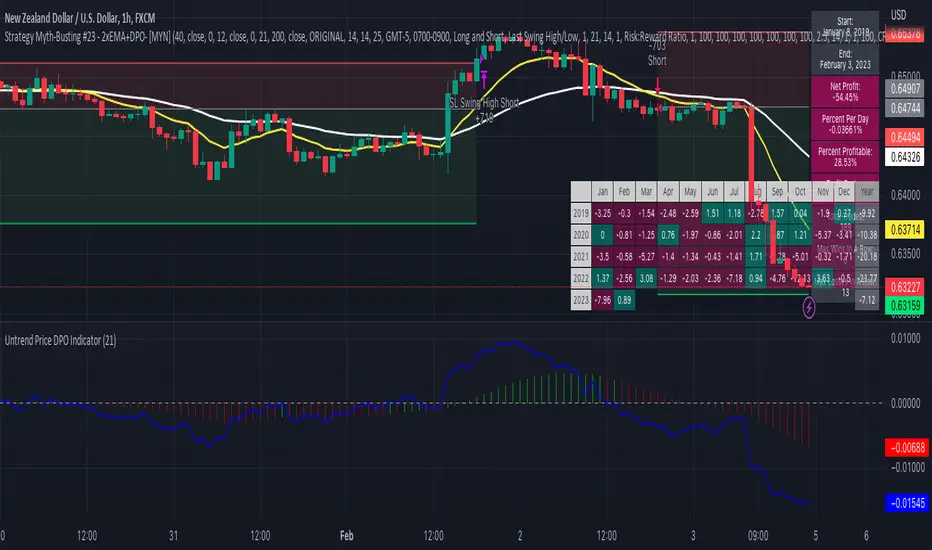
Strategy Myth-Busting #23 - 2xEMA+DPO- [MYN]#23 on the Myth-Busting bench, we are automating the "Best Funded Account Trading Strategy (Pass EVERY Challenge!)" strategy from "Trade with Pat" who claims this strategy will pass every trading challenge out there.
This strategy uses 3 open source indicators. 2 EMA's. The first one (Slow) is set to a length of 40 and a fast EMA which is set to 12. This strategy uses the crossover of the fast( 12) EMA over the Slow EMA ( 40 ) as the primary means to enter a long position. The opposite when the fast EMA crosses under the slow EMA as a means to indicate a short position. This strategy uses the DPO (Detrended Price Oscillaor) from the Uptrend Price DPO indicator in the same way we would traditionally use a stochastic or moving average convergence/divergence indicator like the MACD . Basically, the DPO helps evaluate and estimate the length of the price cycle from peak to peek or through to trough and in this strategy confirms entry of a long / short condition complimenting the EMA crossover/crossunders.
And as always, If you know of or have a strategy you want to see myth-busted or just have an idea for one, please feel free to message me.
This strategy uses a combination of 2 open-source public indicators:
EMA x2 ( 40 and 12)
Untrend Price DPO indicator by jTradeuh
Trading Rules
1 or 4 hour candles
Stop loss at previous highest-high (Short) and lowest-low (Long).
Take Profit 2 - 2.5 the risk
Strategy Template includes open source code from the following:
Performance Summary Dashboard by @VertMT
Time Of Day Window by @ddctv
Monthly Table Performance Dashboard by @QuantNomad
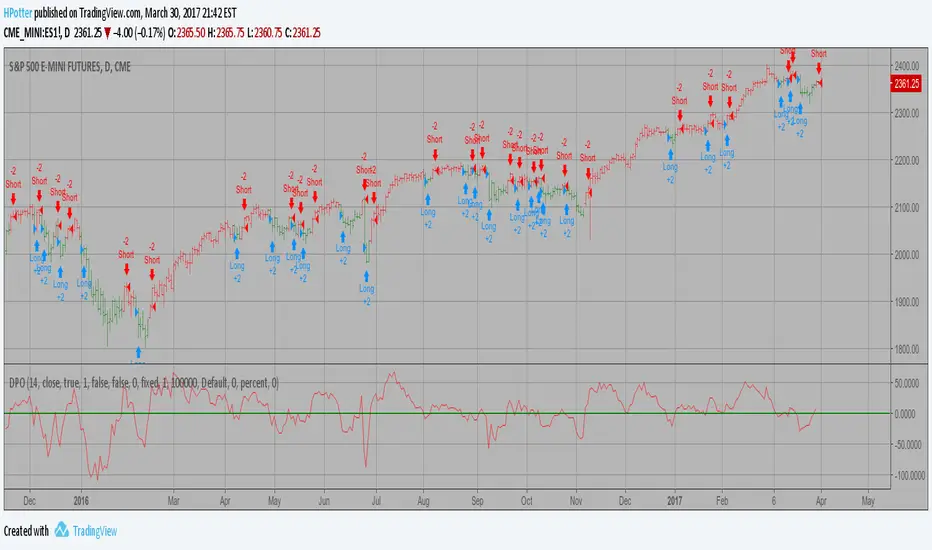
Dpo
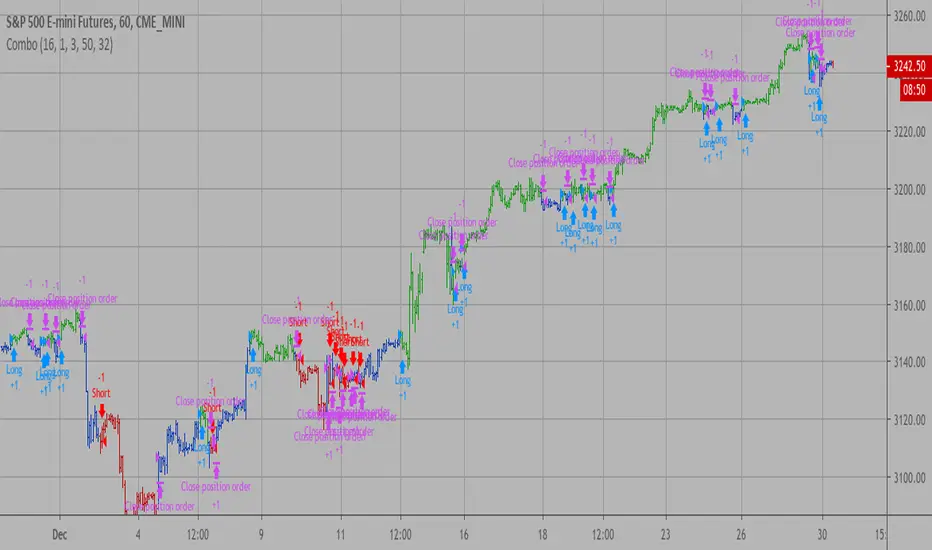
Combo Backtest 123 Detrended Price Oscillator This is combo strategies for get a cumulative signal.
First strategy
This System was created from the Book "How I Tripled My Money In The
Futures Market" by Ulf Jensen, Page 183. This is reverse type of strategies.
The strategy buys at market, if close price is higher than the previous close
during 2 days and the meaning of 9-days Stochastic Slow Oscillator is lower than 50.
The strategy sells at market, if close price is lower than the previous close price
during 2 days and the meaning of 9-days Stochastic Fast Oscillator is higher than 50.
Second strategy
The Detrend Price Osc indicator is similar to a moving average,
in that it filters out trends in prices to more easily identify
cycles. The indicator is an attempt to define cycles in a trend
by drawing a moving average as a horizontal straight line and
placing prices along the line according to their relation to a
moving average. It provides a means of identifying underlying
cycles not apparent when the moving average is viewed within a
price chart. Cycles of a longer duration than the Length (number
of bars used to calculate the Detrend Price Osc) are effectively
filtered or removed by the oscillator.
WARNING:
- For purpose educate only
- This script to change bars colors.
Detrended Price Oscillator Strategy Backtest The Detrend Price Osc indicator is similar to a moving average,
in that it filters out trends in prices to more easily identify
cycles. The indicator is an attempt to define cycles in a trend
by drawing a moving average as a horizontal straight line and
placing prices along the line according to their relation to a
moving average. It provides a means of identifying underlying
cycles not apparent when the moving average is viewed within a
price chart. Cycles of a longer duration than the Length (number
of bars used to calculate the Detrend Price Osc) are effectively
filtered or removed by the oscillator.
You can change long to short in the Input Settings
Please, use it only for learning or paper trading. Do not for real trading.