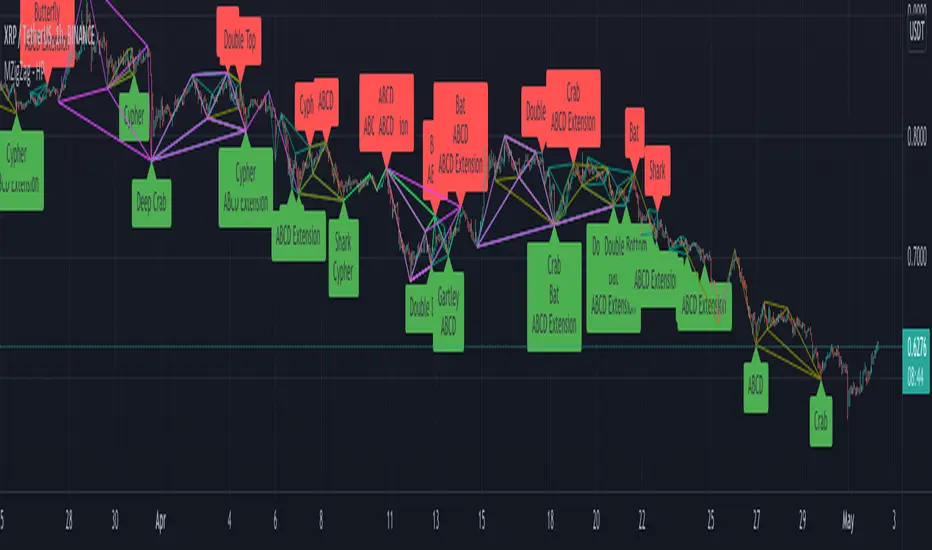
Multi ZigZag Harmonic PatternsCombining Multizigzag with harmonic patterns - this script generates harmonic patterns based on multiple deapth zigzags.
Input parameter allows to chose which Zigzag to be included in pattern identification and set different length, line color, width and style for each Zigzag combinations.
Pattern rules are as below:
Gartley
xab = 0.618
0.382 <= abc <= 0.886
1.272 <= bcd <= 1.618 OR xad = 0.786
Crab
0.382 <= xab <= 0.618
0.382 <= abc <= 0.886
2.24 <= bcd <= 3.618 OR xad = 1.618
Deep Crab
xab = 0.886
0.382 <= abc <= 0.886
2.0 <= bcd <= 3.618 OR xad = 1.618
Bat
0.382 <= xab <= 0.50
0.382 <= abc <= 0.886
1.618 <= bcd <= 2.618 OR xad = 0.886
Butterfly
xab = 0.786
0.382 <= abc <= 0.886
1.618 <= bcd <= 2.618 OR 1.272 <= xad <= 2.618
Shark
xab = 0.786
1.13 <= abc <= 1.618
1.618 <= bcd <= 2.24 OR 0.886 <= xad <= 1.13
Cypher
0.382 <= xab <= 0.618
1.13 <= abc <= 1.414
1.272 <= bcd <= 2.0 OR xad = 0.786
Three Drives
oxa = 0.618
1.27 <= xab <= 1.618
abc = 0.618
1.27 <= bcd <= 1.618
5-0
1.13 <= xab <= 1.618
1.618 <= abc <= 2.24
bcd = 0.5
Related scripts are present here:
Penunjuk dan strategi
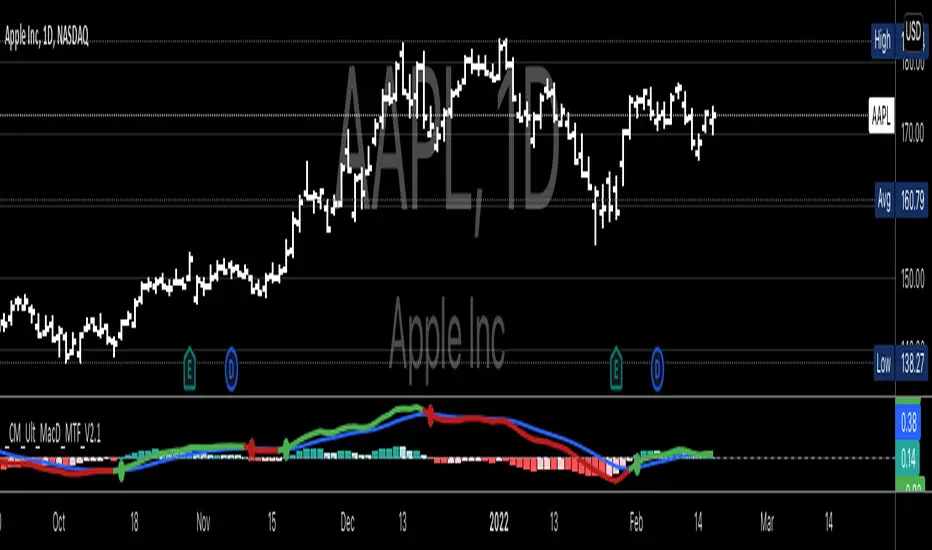
CM MACD Custom Indicator - Multiple Time Frame - V2***For a Detailed Video Overview Showing all of the Settings...
Click HERE to View Video
New _CM_MacD_Ult_MTF _V2 Update 07-28-2021
Thanks to @SKTennis for help in Updating code to V2
Added Groups to Settings Pane.
Added Color Plots to Settings Pane
Switched MTF Logic to turn ON/OFF automatically w/ TradingView's Built in Feature
Updated Color Transparency plots to work in future update
Added Ability to Turn ON/OFF Show MacD & Signal Line
Added Ability to Turn ON/OFF Show Histogram
Added Ability to Change MACD Line Colors Based on Trend
Added Ability to Highlight Price Bars Based on Trend
Added Alerts to Settings Pane.
Customized how Alerts work. Must keep Checked in Settings Pane, and When you go to Alerts Panel, Change Symbol to Indicator (CM_Ult_MacD_MTF_V2)
Customized Alerts to Show Symbol, TimeFrame, Closing Price, MACD Crosses Up & MACD Crosses Down Signals in Alert
Alerts are Pre-Set to only Alert on Bar Close
See Video for Detailed Overview
New Updates Coming Soon!!!
***Please Post Feedback and Any Feature Requests in the Comments Section Below***
Equivolume Overlay - Volume BarsThis is an addon for displaying volume bars along with Equivolume bars which can be found here

KINSKI Volume Regression TrendRegression trends are typically used to determine when a price is unusually far from its baseline. The script calculates the linear regression of volume and price to determine the trend direction and strength. This can be used to determine the volume support for upward/downward trends.
As a special feature, this indicator allows you to choose from three (as of 07/20/2021) templates with special presets.
The following templates are available:
"Precise" (Period: 4, Smoothing Factor Type: "DISABLED", Smoothing Factor Length = 1).
"Smooth" (Period: 4, Smoothing Factor Type: "RMA", Smoothing Factor Length = 2)
"Long Term (Period: 20, Smoothing Factor Type: "DISABLED", Smoothing Factor Length = 1)
In the selection for templates, the option "DISABLED" can also be selected. Then the user-defined settings selectable under it take effect. There are the following setting options.
"Length": Adjustable period
"Smoothing Factor: Type": Type of moving average
"Smoothing Factor: Length": Adjustable period
Other setting options are:
Color codes: The color codes are explained in the settings
Display types: "Columns", "Histogram", "Area", "Line", "Stepline"

Probability Distribution HistogramProbability Distribution Histogram
During data exploration it is often useful to plot the distribution of the data one is exploring. This indicator plots the distribution of data between different bins.
Essentially, what we do is we look at the min and max of the entire data set to determine its range. When we have the range of the data, we decide how many bins we want to divide this range into, so that the more bins we get, the smaller the range (a.k.a. width) for each bin becomes. We then place each data point in its corresponding bin, to see how many of the data points end up in each bin. For instance, if we have a data set where the smallest number is 5 and the biggest number is 105, we get a range of 100. If we then decide on 20 bins, each bin will have a width of 5. So the left-most bin would therefore correspond to values between 5 and 10, and the bin to the right would correspond to values between 10 and 15, and so on.
Once we have distributed all the data points into their corresponding bins, we compare the count in each bin to the total number of data points, to get a percentage of the total for each bin. So if we have 100 data points, and the left-most bin has 2 data points in it, that would equal 2%. This is also known as probability mass (or well, an approximation of it at least, since we're dealing with a bin, and not an exact number).
Usage
This is not an indicator that will give you any trading signals. This indicator is made to help you examine data. It can take any input you give it and plot how that data is distributed.
The indicator can transform the data in a few ways to help you get the most out of your data exploration. For instance, it is usually more accurate to use logarithmic data than raw data, so there is an option to transform the data using the natural logarithmic function. There is also an option to transform the data into %-Change form or by using data differencing.
Another option that the indicator has is the ability to trim data from the data set before plotting the distribution. This can help if you know there are outliers that are made up of corrupted data or data that is not relevant to your research.
I also included the option to plot the normal distribution as well, for comparison. This can be useful when the data is made up of residuals from a prediction model, to see if the residuals seem to be normally distributed or not.

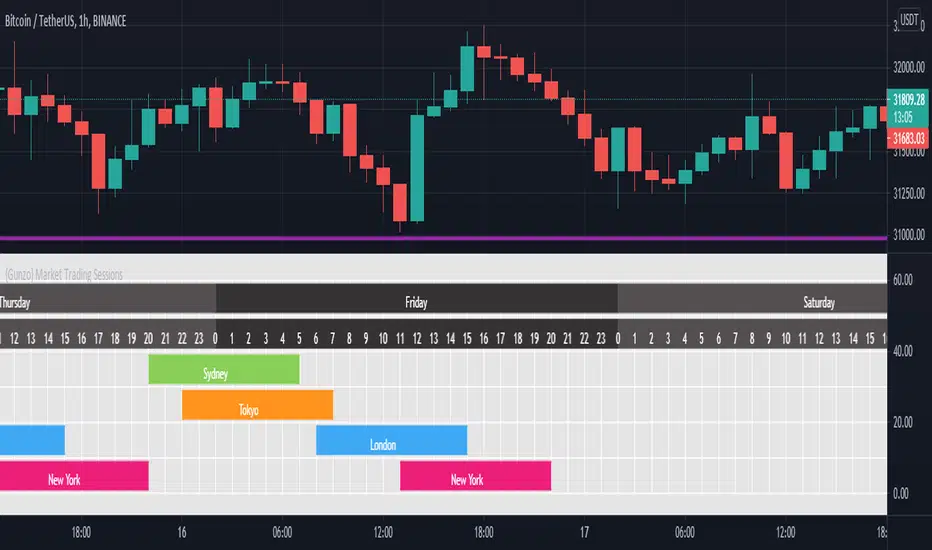
{Gunzo} Market Trading Sessions (Tokyo, London, New York)Market Trading Sessions is a tool designed to help traders to find the best times of the day for price action trading. It displays non-overlapping visuals for the major trading sessions : Oceania, Asia, Europe, and USA.
OVERVIEW :
This tool has been designed to match all the following requirements that I needed for optimal usage :
Display opening and closing of main markets
See clearly market sessions (non-overlapping colors)
Display Sydney session if wanted
Display GMT hours and days
Visually pleasing design and colors
Highly configurable
As I had trouble finding a script matching all these criteria, I created this tool and I'm sharing it with the TradingView community, hoping you will find it useful too.
SETTINGS :
Display market sessions on weekends : Display theoretical market sessions times on the weekend which can be useful for non forex markets.
Display session for Oceania\Sydney : Display "Oceania\Sydney" trading session
Display session for Asia\Tokyo : Display "Asia\Tokyo" trading session
Display session for Europe\London : Display "Europe\London" trading session
Display session for USA\New York : Display "USA\New York" trading session
Display session names : Display names of the session on the visual
Oceania color : Configurable color for the "Oceania\Sydney" sessions
Asia color : Configurable color for the "Asia\Tokyo" sessions
Europe color : Configurable color for the "Europe\London" sessions
USA color : Configurable color for the "USA\New York" sessions
Background color : Configurable color for the table background
Border color : Configurable color for the table borders
Text color : Configurable color for the table text
Header color : Configurable color for the table header (even days)
Header color (alternate) : Configurable color for the table header (odd days)
Volume Profile / Fixed RangeHello All,
This script calculates and shows Volume Profile for the fixed range . Recently we have box.new() feature in Pine Language and it's used in this script as an example. Thanks to Pine Team and Tradingview!..
Sell/Buy volumes are calculated approximately!.
Options:
"Number of Bars" : Number of the bars that volume profile will be calculated/shown
"Row Size" : Number of the Rows
"Value Area Volume % " : the percent for Value Area
and there are other options for coloring and POC line style
Enjoy!

Portfolio Backtester Engine█ OVERVIEW
Portfolio Backtester Engine (PBTE). This tool will allow you to backtest strategies across multiple securities at once. Allowing you to easier understand if your strategy is robust. If you are familiar with the PineCoders backtesting engine , then you will find this indicator pleasant to work with as it is an adaptation based on that work. Much of the functionality has been kept the same, or enhanced, with some minor adjustments I made on the account of creating a more subjectively intuitive tool.
█ HISTORY
The original purpose of the backtesting engine (`BTE`) was to bridge the gap between strategies and studies . Previously, strategies did not contain the ability to send alerts, but were necessary for backtesting. Studies on the other hand were necessary for sending alerts, but could not provide backtesting results . Often, traders would have to manage two separate Pine scripts to take advantage of each feature, this was less than ideal.
The `BTE` published by PineCoders offered a solution to this issue by generating backtesting results under the context of a study(). This allowed traders to backtest their strategy and simultaneously generate alerts for automated trading, thus eliminating the need for a separate strategy() script (though, even converting the engine to a strategy was made simple by the PineCoders!).
Fast forward a couple years and PineScript evolved beyond these issues and alerts were introduced into strategies. The BTE was not quite as necessary anymore, but is still extremely useful as it contains extra features and data not found under the strategy() context. Below is an excerpt of features contained by the BTE:
"""
More than `40` built-in strategies,
Customizable components,
Coupling with your own external indicator,
Simple conversion from Study to Strategy modes,
Post-Exit analysis to search for alternate trade outcomes,
Use of the Data Window to show detailed bar by bar trade information and global statistics, including some not provided by TV backtesting,
Plotting of reminders and generation of alerts on in-trade events.
"""
Before I go any further, I want to be clear that the BTE is STILL a good tool and it is STILL very useful. The Portfolio Backtesting Engine I am introducing is only a tangental advancement and not to be confused as a replacement, this tool would not have been possible without the `BTE`.
█ THE PROBLEM
Most strategies built in Pine are limited by one thing. Data. Backtesting should be a rigorous process and researchers should examine the performance of their strategy across all market regimes; that includes, bullish and bearish markets, ranging markets, low volatility and high volatility. Depending on your TV subscription The Pine Engine is limited to 5k-20k historical bars available for backtesting, which can often leave the strategy results wanting. As a general rule of thumb, strategies should be tested across a quantity of historical bars which will allow for at least 100 trades. In many cases, the lack of historical bars available for backtesting and frequency of the strategy signals produces less than 100 trades, rendering your strategy results inconclusive.
█ THE SOLUTION
In order to be confident that we have a robust strategy we must test it across all market regimes and we must have over 100 trades. To do this effectively, researchers can use the Portfolio Backtesting Engine (PBTE).
By testing a strategy across a carefully selected portfolio of securities, researchers can now gather 5k-20k historical bars per security! Currently, the PTBE allows up to 5 securities, which amounts to 25k-100k historical bars.
█ HOW TO USE
1 — Add the indicator to your chart.
• Confirm inputs. These will be the most important initial values which you can change later by clicking the gear icon ⚙ and opening up the settings of the indicator.
2 — Select a portfolio.
• You will want to spend some time carefully selecting a portfolio of securities.
• Each security should be uncorrelated.
• The entire portfolio should contain a mix of different market regimes.
You should understand that strategies generally take advantage of one particular type of market regime. (trending, ranging, low/high volatility)
For example, the default RSI strategy is typically advantageous during ranging markets, whereas a typical moving average crossover strategy is advantageous in trending markets.
If you were to use the standard RSI strategy during a trending market, you might be selling when you should be buying.
Similarily, if you use an SMA crossover during a ranging market, you will find that the MA's may produce many false signals.
Even if you build a strategy that is designed to be used only in a trending market, it is still best to select a portfolio of all market regimes
as you will be able to test how your strategy will perform when the market does something unexpected.
3 — Test a built-in strategy or add your own.
• Navigate to gear icon ⚙ (settings) of strategy.
• Choose your options.
• Select a Main Entry Strat and Alternate Entry Strat .
• If you want to add your own strategy, you will need to modify the source code and follow the built-in example.
• You will only need to generate (buy 1 / sell -1/ neutral 0) signals.
• Select a Filter , by default these are all off.
• Select an Entry Stop - This will be your stop loss placed at the trade entry.
• Select Pyamiding - This will allow you to stack positions. By default this is off.
• Select Hard Exits - You can also think of these as Take Profits.
• Let the strategy run and take note of the display tables results.
• Portfolio - Shows each security.
• The strategy runs on each asset in your portfolio.
• The initial capital is equally distributed across each security.
So if you have 5 securities and a starting capital of 100,000$ then each security will run the strategy starting with 20,000$
The total row will aggregate the results on a bar by bar basis showing the total results of your initial capital.
• Net Profit (NP) - Shows profitability.
• Number of Trades (#T) - Shows # of trades taken during backtesting period.
• Typically will want to see this number greater than 100 on the "Total" row.
• Average Trade Length (ATL) - Shows average # of days in a trade.
• Maximum Drawdown (MD ) - Max peak-to-valley equity drawdown during backtesting period.
• This number defines the minimum amount of capital required to trade the system.
• Typically, this shouldn’t be lower than 34% and we will want to allow for at least 50% beyond this number.
• Maximum Loss (ML) - Shows largest loss experienced on a per-trade basis.
• Normally, don’t want to exceed more than 1-2 % of equity.
• Maximum Drawdown Duration (MDD) - The longest duration of a drawdown in equity prior to a new equity peak.
• This number is important to help us psychologically understand how long we can expect to wait for a new peak in account equity.
• Maximum Consecutive Losses (MCL) - The max consecutive losses endured throughout the backtesting period.
• Another important metric for trader psychology, this will help you understand how many losses you should be prepared to handle.
• Profit to Maximum Drawdown (P:MD) - A ratio for the average profit to the maximum drawdown.
• The higher the ratio is, the better. Large profits and small losses contribute to a good PMD.
• This metric allows us to examine the profit with respect to risk.
• Profit Loss Ratio (P:L) - Average profit over the average loss.
• Typically this number should be higher in trend following systems.
• Mean reversion systems show lower values, but compensate with a better win %.
• Percent Winners (% W) - The percentage of winning trades.
• Trend systems will usually have lower win percentages, since statistically the market is only trending roughly 30% of the time.
• Mean reversion systems typically should have a high % W.
• Time Percentage (Time %) - The amount of time that the system has an open position.
• The more time you are in the market, the more you are exposed to market risk, not to mention you could be using that money for something else right?
• Return on Investment (ROI) - Your Net Profit over your initial investment, represented as a percentage.
• You want this number to be positive and high.
• Open Profit (OP) - If the strategy has any open positions, the floating value will be represented here.
• Trading Days (TD) - An important metric showing how many days the strategy was active.
• This is good to know and will be valuable in understanding how long you will need to run this strategy in order to achieve results.
█ FEATURES
These are additional features that extend the original `BTE` features.
- Portfolio backtesting.
- Color coded performance results.
- Circuit Breakers that will stop trading.
- Position reversals on exit. (Simulating the function of always in the market. Similar to strategy.entry functionality)
- Whipsaw Filter
- Moving Average Filter
- Minimum Change Filter
- % Gain Equity Exit
- Popular strategies, (MACD, MA cross, supertrend)
Below are features that were excluded from the original `BTE`
- 2 stage in-trade stops with kick-in rules (This was a subjective decision to remove. I found it to be complex and thwarted my use of the `BTE` for some time.)
- Simple conversion from Study to Strategy modes. (Not possible with multiple securities)
- Coupling with your own external indicator (Not really practical to use with multiple securities, but could be used if signals were generated based on some indicator which was not based on the current chart)
- Use of the Data Window to show detailed bar by bar trade information and global statistics.
- Post Exit Analysis.
- Plotting of reminders and generation of alerts on in-trade events.
- Alerts (These may be added in the future by request when I find the time.)
█ THANKS
The whole PineCoders team for all their shared knowledge and original publication of the BTE and Richard Weismann for his ideas on building robust strategies.
═════════════════════════════════════════════════════════════════════════

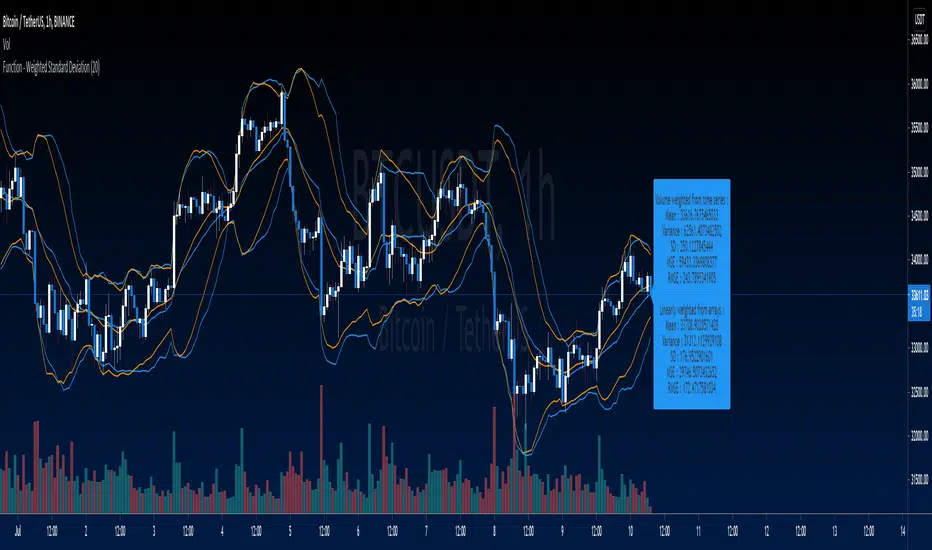
Function - Weighted Standard DeviationCalculates weighted mean, variance, standard deviation, MSE and RMSE from time series variables or arrays.
When calculating from arrays, the function expects index 0 to be the most recent sample and weight values.
RedK Portfolio Tracker [Table Version]RedK Portfolio Tracker is a simple tool that enables a trader to monitor and track a portfolio of up to 10 holdings (+ free cash) in real time - directly on the chart
Now that we have tables in Pine, this is a table version of my previously published Portfolio Tracker
- The table works better in visualizing the various table elements (title row, column labels..etc), and is more flexible in allowing color coding of gain/loss. for many traders, myself included, these simple visual signals are valuable in helping timely trading decisions.
I'll come back and improve this script as i'm really enjoying the ability to track things this way - if you liked this and want to receive the updates, please flag / favorite it below and you'll get notified when i publish new versions.
Some new features for the table version:
- ability to change default color of various table elements (text, default background, title background, gain/loss color, border..etc)
- ability to change the text size to suit your monitor and visual preference
- ability to change table position
The "portfolio-specific" inputs are similar to the previous version - we get the ability to enter up to 10 positions, entry price and qty, then also add the free cash
- also a change from prior version, this table will plot by default on the price chart, but will have no scale - the portfolio ploy itself will also show (blue/orange stepping line) but the PnL plot will be hidden by default -- how we plot the portfolio & P/L is possibly one of the areas for improvements for next versions - also thinking of other adding valuable data i track in my own trading, like the quarterly dividends for the held positions .. we'll see - this is just a start
hope some will find this useful. feel free to comment.

How to use Leverage and Margin in PineScriptEn route to being absolutely the best and most complete trading platform out there, TradingView has just closed 2 gaps in their PineScript language.
It is now possible to create and backtest a strategy for trading with leverage.
Backtester now produces Margin Calls - so recognizes mid-trade drawdown and if it is too big for the broker to maintain your trade, some part of if will be instantly closed.
New additions were announced in official blogpost , but it lacked code examples, so I have decided to publish this script. Having said that - this is purely educational stuff.
█ LEVERAGE
Let's start with the Leverage. I will discuss this assuming we are always entering trades with some percentage of our equity balance (default_qty_type = strategy.percent_of_equity), not fixed order quantity.
If you want to trade with 1:1 leverage (so no leverage) and enter a trade with all money in your trading account, then first line of your strategy script must include this parameter:
default_qty_value = 100 // which stands for 100%
Now, if you want to trade with 30:1 leverage, you need to multipy the quantity by 30x, so you'd get 30 x 100 = 3000:
default_qty_value = 3000 // which stands for 3000%
And you can play around with this value as you wish, so if you want to enter each trade with 10% equity on 15:1 leverage you'd get default_qty_value = 150.
That's easy. Of course you can modify this quantity value not only in the script, but also afterwards in Script Settings popup, "Properties" tab.
█ MARGIN
Second newly released feature is Margin calculation together with Margin Calls. If the market goes against your trades and your trading account cannot maintain mid-trade drawdown - those trades will be closed in full or partly. Also, if your trading account cannot afford to open more trades (pyramiding those trades), Margin mechanism will prevent them from being entered.
I will not go into details about how Margin calculation works, it was all explainged in above mentioned blogpost and documentation .
All you need to do is to add two parameters to the opening line of your script:
margin_long = 1./30*50, margin_short = 1./30*50
Whereas "30" is a leverage scale as in 30:1, and "50" stands for 50% of Margin required by your broker. Personally the Required Margin number I've met most often is 50%, so I'm using value 50 here, but there are literally 1000+ brokers in this world and this is individual decision by each of them, so you'd better ask yourself.
--------------------
Please note, that if you ever encounter a strategy which triggers Margin Call at least once, then it is probably a very bad strategy. Margin Call is a last resort, last security measure - all the risks should be calculated by the strategy algorithm before it is ever hit. So if you see a Margin Call being triggred, then something is wrong with risk management of the strategy. Therefore - don't use it!

Normalized Oscillators Spider Chart [LuxAlgo]This indicator displays a spider chart overlaid on the user’s current chart allowing the visualization of information given by various normalized oscillators. It is possible to customize the spider chart by hiding certain oscillators from within the settings which removes their corresponding spokes from the chart.
Users can control the length settings of each oscillator individually or use a global length setting that applies to every oscillator. An additional meter element is displayed and aims to give the overall sentiment returned by the oscillators. This can also be used to gauge whether the market is trending or ranging.
This is a relatively simple application of a spider chart but can prove to be useful to some users.
1. Settings
RSI: Displays the Relative Strength Index spoke on the spider chart, includes the length setting on the right of the toggle.
%K: Displays the Stochastic Oscillator "%K" spoke on the spider chart, includes the length setting on the right of the toggle.
COR: Displays the Correlation Oscillator spoke on the spider chart, includes the length setting on the right of the toggle.
MFI: Displays the Money Flow Index oscillator spoke on the spider chart, includes the length setting on the right of the toggle.
WPR: Displays the Williams Percent Rank oscillator spoke on the spider chart, includes the length setting on the right of the toggle.
%UP: Displays the percentage of upward variations spoke on the spider chart, includes the length setting on the right of the toggle.
CMO: Displays the Chande Momentum Oscillator spoke on the spider chart, includes the length setting on the right of the toggle.
AOS: Displays the Aroon oscillator spoke on the spider chart, includes the length setting on the right of the toggle.
Global Oscillators Length: Determines whether all oscillators should use the same length settings, determined by the setting on the right of the toggle.
1.1 Style Settings
Spider Chart Length: Determines the horizontal width of the spider chart.
Spider Chart Offset: Offset between the most recent bar and the left extremity of the spider chart.
2. Usage
A spider chart can be a very useful visualization tool when it comes to seeing the individual characteristics of various variables at the same time.
Here, the tool can give a general sentiment on the direction of the trend without adding each indicator to your chart. It is also possible to determine when an oscillator is considered overbought or oversold with this indicator.
The dashed line represents the central value for each oscillator.
Disabling any of the oscillators from the settings will return a spider chart using fewer spokes.
The script also displays a meter that can be used to determine the overall sentiment given by all oscillators. This metric is based on the average value between each oscillator. An overall sentiment closer to 50 would indicate a ranging market.

Weighted Harrell-Davis Quantile Estimator with AbsoluteDeviation
QUANTILE ESTIMATORS
Weighted Harrell-Davis Quantile Estimator with Absolute Deviation Fences.
DISCLAIMER:
The Following indicator/code IS NOT intended to be a formal investment advice or recommendation by the author, nor should be construed as such. Users will be fully responsible by their use regarding their own trading vehicles/assets.
The following indicator was made for NON LUCRATIVE ACTIVITIES and must remain as is, following TradingView's regulations. Use of indicator and their code are published for work and knowledge sharing. All access granted over it, their use, copy or re-use should mention authorship(s) and origin(s).
WARNING NOTICE!
THE INCLUDED FUNCTION MUST BE CONSIDERED FOR TESTING. The models included in the indicator have been taken from open sources on the web and some of them has been modified by the author, problems could occur at diverse data sceneries, compiler version, or any other externality.
Purpose:
Weighted Quantiles or <> are quite difficult to find on must systems, also it's non-weighted approach are rarely used to estimate the location parameter of price distribution WICH IS NOT NORMAL, all this in favour of it's non-robust counterpart, the Arithmetic rolling Mean or <> and it's weighted variants like the WMA, VWAP, etc.
Also, a big drawback from this is that must statistics derived from Normal-Distribution parameter location (the Mean) definitely will not fit for an efficient, nor robust estimation for price distributions, so their moments like the standard deviation, kurtosis, skewness, etc. will not be the better tools to build derived algorithms or technical indicators among price/volume.
In an effort searching better statistical tools for price distributions, I found the excellent work of Andrey Akinshin that took me to port some of their Math research contributions for the compute benchmarking field , and bring it here at the TradingView ecosystem to take a shot at the price distribution crazy fields. For a better detail of what the weighted Harrell-Davis Quantile Estimator can do, who better than drink directly from the source at References:
References:
Weighted Quantile Estimators.
DoubleMAD outlier detector based on the Harrell-Davis quantile estimator.
Unbiased median absolute deviation based on the Harrell-Davis quantile estimator.
Quantile confidence intervals for weighted samples.
Licensing:
This work is licensed under a Attribution-NonCommercial-ShareAlike 4.0 International Copyright (c) 2021 (CC BY-NC-SA 4.0)
Copyright's & Mentions:
The Gamma Functions & Beta Probability Density Functions C# implementations by the Math.NET Numerics, part of the Math.NET Project.
The Regularized Incomplete (Left) Beta Function C# implementation by the SAMTools, htslib project.
The Weighted Harrell-Davis Quantile estimator ; C# & R implementations by Andrey Akinshin.
External PineScript code, methods, support & consultancy by @PineCoders staff with special mention for:
+ "ma sorter ('sort by array' example)- JD" by @Duyck.
+ Porting, mods, compilation and debugging for this script by @XeL_Arjona for the TradingView's @PineCoders community.

Dominance tagcloud [experimental] This script is mainly about 2 techniques:
- rectangles that don't overlap with the use of random() -> f_overlap(x1_a, y1_a, x2_a, y2_a, x1_b, y1_b, x2_b, y2_b)
- using a "while loop" (inspired by @ricardosantos)
The loop:
for x = 0 to 999999
if ...
do ...
continue
else ...
break
resembles a "while loop"
There are 2 settings :
"Moving Boxes?"
- enabled: the boxes are made and move randomly
- disabled: the boxes are randomly made, without moving
"Label at the side"
- enabled: labels at the side
- disabled: labels at the rectangles, note while rectangles won't overlap, the text can overlap
Cheers!

RedK Slow_Smooth Average (RSS_WMA)RedK Slow Smooth Average (RSS_WMA) is based on simple, multi-WMA passes to generate a moving average that sacrifices low-lag and fast responsiveness for the sake of smoothness.
This smoothness enables an increased trader ability to visualize and track longer-term trends and removes the noise of smaller, relatively insignificant price fluctuations.
Notes:
=========
* RSS_WMA is deliberately built to be a "lazy line" - and it works in a different way to other common moving averages that attempt to achieve less lag and quicker responsiveness - the idea and the use scenario is to act as a "smooth base" when used against a faster moving average like the v_Wave of the Co_Ra Wave
* Note that the settings of this line is "Smoothness' and not "length" - the initial length used for the first WMA pass calculation is 1/3 of that smoothness value selected in the settings
* Increments in the combined smoothness value will be allocated first to 1st WMA pass, then 2nd WMA pass, then 3rd pass consecutively then back to 1st pass.
* because we utilize 3 WMA passes, a settings below 3 will have no effect on the line and it will just track the "source" price.
Suggested Use:
===============
- Use RSS_WMA when you're looking for a smooth moving average that can help you analyze you chart at a broader / macro level, visualize the broader price action patterns and filter out the noise from short-term moves. you can also use this line to help set your position exits since only major and persistent moves will cause this line, as lay as it is, to swing from one direction to the other.
How does RSS_WMA compare?
============================
here's a quick view of how the RSS_WMA compared to other commonly used Moving Averages, including my recently published CoRa_Wave
Code is commented - please feel free to use and customize further - please share a comment if you found this useful in your chart analysis or trading.

Financials on Chart█ OVERVIEW
This indicator displays your choice of up to 9 fundamentals on your chart.
█ FEATURES
You can configure the following attributes of the display:
• Its position on your chart.
• Automatic or custom height and width of rows.
• The size and color of text.
• The default background color (you can override it with a custom color for individual values).
• Conversion of values expressed in USD to one of the major currencies. Financials are normally expressed in quote currency.
Conversion to other currencies is only done when the symbol's quote currency is USD.
• Choose if the currency used for the financials is displayed. Note that some financials are calculated values that are not expressed in currency units.
No currency will be displayed for these values.
• Abbreviate large values.
For each value, you may:
• Pick one of the 222 financials available in Pine, or one of five values calculated from the financials (Market Cap, Earnings Yield, P/B Ratio, P/E Ratio and Price-To-Sales Ratio).
• Choose a period (see the "i" icon near the first value's fields in the script's inputs for a list of exceptions).
• Specify the value's precision.
• Change the legend displayed with the value.
• Adjust the text's size.
• Use a custom background.
█ LIMITATIONS
When changing the indicator's inputs, allow a few seconds for the change to be reflected in the display.
If your chart displays a symbol for which the configured financials cannot be fetched, an error will occur.
Not all periods are available for all fundamentals or for all markets. What financial data is available in Pine? will give you an overview of the available periods for each value. The page also contains the formulas used for the five values we calculate from the financials. This page shows the typical reporting frequency for different countries .
█ FINANCIALS
See What is Financial Data? and Why does Financial Data differ from other sources? for more information on the data used by this indicator.
This lists all the financials. Clicking on one will bring up more information about it:
CALCULATED
Market Capitalization
Earnings Yield
Price Book Ratio
Price Earnings Ratio
Price-To-Sales Ratio
INCOME STATEMENTS
After tax other income/expense
Average basic shares outstanding
Other COGS
Cost of goods
Deprecation and amortization
Diluted net income available to common stockholders
Diluted shares outstanding
Dilution adjustment
Discontinued operations
Basic EPS
Diluted EPS
EBIT
EBITDA
Equity in earnings
Gross profit
Taxes
Interest capitalized
Interest expense on debt
Non-controlling/minority interest
Net income before discontinued operations
Net income
Non-operating income, excl. interest expenses
Interest expense, net of interest capitalized
Non-operating interest income
Operating income
Operating expenses (excl. COGS)
Miscellaneous non-operating expense
Other operating expenses, total
Preferred dividends
Pretax equity in earnings
Pretax income
Research & development
Selling/general/admin expenses, other
Selling/general/admin expenses, total
Non-operating income, total
Total operating expenses
Total revenue
Unusual income/expense
BALANCE SHEET
Accounts payable
Accounts receivable - trade, net
Accrued payroll
Accumulated depreciation, total
Additional paid-in capital/Capital surplus
Tangible book value per share
Book value per share
Capitalized lease obligations
Capital and operating lease obligations
Cash & equivalents
Cash and short term investments
Common equity, total
Common stock par/Carrying value
Current portion of LT debt and capital leases
Deferred income, current
Deferred income, non-current
Deferred tax assets
Deferred tax liabilities
Dividends payable
Goodwill, net
Income tax payable
Net intangible assets
Inventories - finished goods
Inventories - progress payments & other
Inventories - raw materials
Inventories - work in progress
Investments in unconsolidated subsidiaries
Long term debt excl. lease liabilities
Long term debt
Long term investments
Note receivable - long term
Other long term assets, total
Minority interest
Notes payable
Operating lease liabilities
Other common equity
Other current assets, total
Other current liabilities
Other intangibles, net
Other investments
Other liabilities, total
Other receivables
Other short term debt
Paid in capital
Gross property/plant/equipment
Net property/plant/equipment
Preferred stock, carrying value
Prepaid expenses
Provision for risks & charge
Retained earnings
Short term debt excl. current portion of LT debt
Short term debt
Short term investments
Shareholders' equity
Total assets
Total current assets
Total current liabilities
Total debt
Total equity
Total inventory
Total liabilities
Total liabilities & shareholders' equities
Total non-current assets
Total non-current liabilities
Total receivables, net
Treasury stock - common
CASHFLOW
Amortization
Capital expenditures - fixed assets
Capital expenditures
Capital expenditures - other assets
Cash from financing activities
Cash from investing activities
Cash from operating activities
Deferred taxes (cash flow)
Depreciation & amortization (cash flow)
Change in accounts payable
Change in accounts receivable
Change in accrued expenses
Change in inventories
Change in other assets/liabilities
Change in taxes payable
Changes in working capital
Common dividends paid
Depreciation/depletion
Free cash flow
Funds from operations
Issuance/retirement of debt, net
Issuance/retirement of long term debt
Issuance/retirement of other debt
Issuance/retirement of short term debt
Issuance/retirement of stock, net
Net income (cash flow)
Non-cash items
Other financing cash flow items, total
Financing activities - other sources
Financing activities - other uses
Other investing cash flow items, total
Investing activities - other sources
Investing activities - other uses
Preferred dividends paid
Purchase/acquisition of business
Purchase of investments
Repurchase of common & preferred stock
Purchase/sale of business, net
Purchase/sale of investments, net
Reduction of long term debt
Sale of common & preferred stock
Sale of fixed assets & businesses
Sale/maturity of investments
Issuance of long term debt
Total cash dividends paid
STATISTICS
Accruals
Altman Z-score
Asset turnover
Beneish M-score
Buyback yield %
Cash conversion cycle
Cash to debt ratio
COGS to revenue ratio
Current ratio
Days sales outstanding
Days inventory
Days payable
Debt to assets ratio
Debt to EBITDA ratio
Debt to equity ratio
Debt to revenue ratio
Dividend payout ratio %
Dividend yield %
Dividends per share - common stock primary issue
EPS estimates
EPS basic one year growth
EPS diluted one year growth
EBITDA margin %
Effective interest rate on debt %
Enterprise value to EBITDA ratio
Enterprise value
Equity to assets ratio
Enterprise value to EBIT ratio
Enterprise value to revenue ratio
Float shares outstanding
Free cash flow margin %
Fulmer H factor
Goodwill to assets ratio
Graham's number
Gross margin %
Gross profit to assets ratio
Interest coverage
Inventory to revenue ratio
Inventory turnover
KZ index
Long term debt to total assets ratio
Net current asset value per share
Net income per employee
Net margin %
Number of employees
Operating earnings yield %
Operating margin %
PEG ratio
Piotroski F-score
Price earnings ratio forward
Price sales ratio forward
Price to free cash flow ratio
Price to tangible book ratio
Quality ratio
Quick ratio
Research & development to revenue ratio
Return on assets %
Return on equity adjusted to book value %
Return on equity %
Return on invested capital %
Return on tangible assets %
Return on tangible equity %
Revenue one year growth
Revenue per employee
Revenue estimates
Shares buyback ratio %
Sloan ratio %
Springate score
Sustainable growth rate
Tangible common equity ratio
Tobin's Q (approximate)
Total common shares outstanding
Zmijewski score
█ NOTES
This script uses the Pine financial() function to fetch the values it displays.
Look first. Then leap.

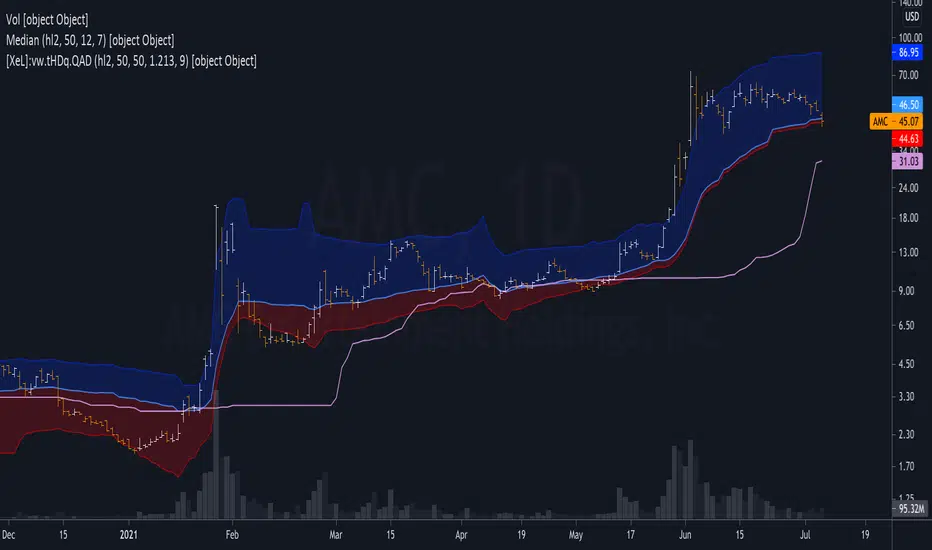
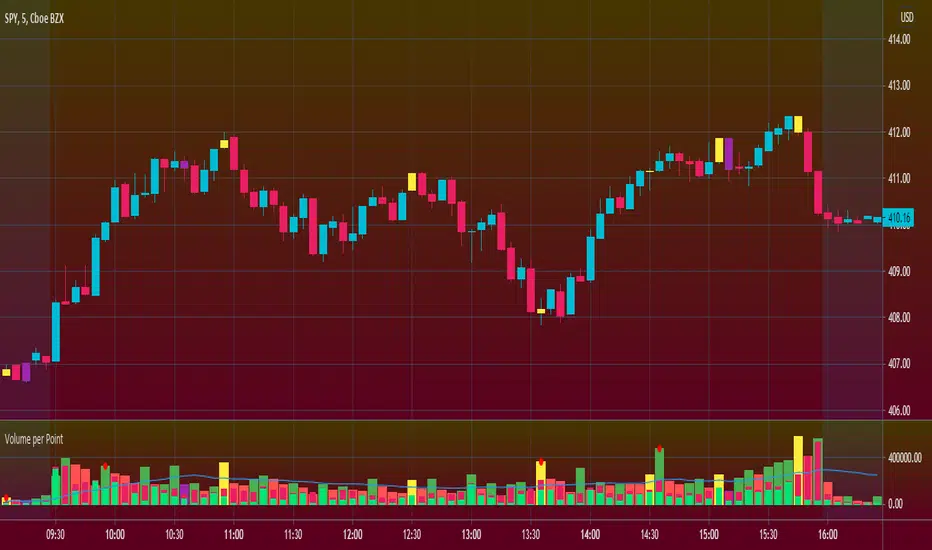
Volume per PointHello everyone <3
I present to you guys my new indicator Volume per Point (VP)
As suggested by the title, this script gives you the volume for every point.
Here's a run down on specific features:
SUBCHART COLUMNS:
The columns can be the following four colors:
Green - There was an increase in VP
Red - There was a decrease in VP
Yellow - There was divergence between volume and candle range
Purple - There are signs of exhaustion compared to the previous candlestick
SUBCHART HISTOGRAM:
The histogram can be the following two colors:
Lime - Buying volume
Red - Selling volume
I left you guys the ability to change the multiplier on the volume in settings just incase it's too small or too big compared to the VP. Decimals are allowed!
CANDLESTICK CHART:
The candlesticks can the following two colors:
Yellow - There was a divergence between volume and candle range
Purple - There are signs of exhaustion compared to the previous candlestick
FILTERS
In the settings, you're able to add the following two filters:
RSI Filters - RSI must be below or above the specified value for the divergence or exhaustion to trigger
Percent Filters - The candlestick range or volume must be higher or lower than the specified value depending whether it's divergence or exhaustion.
This is a very helpful tool if you're interesting in reading volume. It also facilitates finding market maker activity depending on the size of the VP. Sudden abnormal spikes in VP usually do signal something and that's up for you to figure out :)
Thank you for your time to read this
~July <3
Cup FinderHello All,
This script finds the Cups and you can use it while analysing the symbols. it creates circle and channel for the potential Cups and checks the number of bars included by the channel, if included bars is equal or greater than the value you set then it shows the cup.
The Options:
"Number for Bars to search" : Maximum length of a Cup
"Channel Width of the Cup" : Tate by the channel width of highest/lowest levels in last 300 bars, by default it's 5%
"Check for Breakout" : if there is Cup then it checks Close or High/Low is used a source for breaokuts, usuful while cheking historical bars
"Contained Bar Rate %" : after channel is created the script checks number of bars included by the channel of the Cup, you can set rate of included bars by this option
"S how Channels of Cups ": if you enable this option then you can see the channels around the Cups and set it as you wish
and there are some other options for labeling/removing old Cups and for coloring
Here you can see how channel looks like:
Cup with different colors:
P.S. This is an experimental work and sorry for no explanation in the script.
in the future if I have time I will try to write a script for Cup&Handle
This script is also an example to calculate and draw circles :)
Enjoy!

Outlier Detector with N-Sigma Confidence IntervalsA detrended series that oscilates around zero is obtained after first differencing a time series (i.e. subtracting the closing price for a candle from the one immediately before, for example). Hypothetically, assuming that every detrended closing price is independent of each other (what might not be true!), these values will follow a normal distribution with mean zero and unknown variance sigma squared (assuming equal variance, what is also probably not true as volatility changes over time for different pairs). After studentizing, they follow a Student's t-distribution, but as the sample size increases (back periods > 30, at least), they follow a standard normal distribution.
This script was developed for personal use and the idea is spotting candles that are at least 99% bigger than average (using N = 3) as they will cross the upper and lower confidence interval limits. N = 2 would roughly provide a 95% confidence interval.

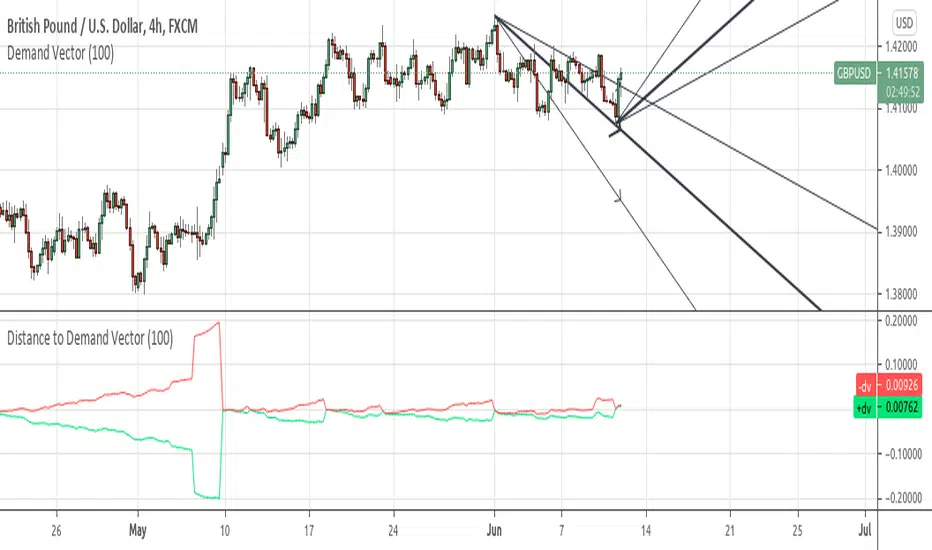
Distance to Demand Vectorshows the distance to its relevant demand vector.
demand vector is based on the demand for long/short, extracted from price range..
RedK Compound Ratio Moving Average (CoRa_Wave)
Compound Ratio Weighted Average (CoRa_Wave) is a moving average where the weights increase in a "logarithmically linear" way - from the furthest point in the data to the current point - the formula to calculate these weights work in a similar way to how "compound ratio" works - you start with an initial amount, then add a consistent "ratio of the cumulative prior sum" each period until you reach the end amount. The result is, the "step ratio" between the weights is consistent - This is not the case with linear-weights moving average (WMA), or EMA
- for example, if you consider a Weighted Moving Average (WMA) of length 5, the weights will be (from the furthest point towards the most current) 1, 2, 3, 4, 5 -- we can see that the ratio between these weights are inconsistent. in fact, the ratio between the 2 furthest points is 2:1, but the ratio between the most recent points is 5:4 -- the ratio is inconsistent, and in fact, more recent points are not getting the best weights they should/can get to counter-act the lag effect. Using the Compound ratio approach addresses that point.
a key advantage here is that we can significantly reduce the "tail weight" - which is "relatively" large in other MAs and would be main cause for lag - giving more weights to the most recent data points - and in a way that is consistent, reliable and easy to "code"
- the outcome is, a moving average line that suffers very little lag regardless of the length, and that can be relied on to track the price movements and swings closely.
other features:
===============
- An accelerator, or multiplier, has been added to further increase the "aggressiveness" of the moving average line, giving even more weights to the more recent points - the multiplier will have more effect between 1 and 5, then will have a diminishing effect after that - note that a multiplier of 0 (which effectively causes a comp. ratio of 0 to be applied) will produce a Simple Moving Average line :)
- We also added the ability to use an "automatic smoothing" mechanism, that user can over-ride by manually choosing how much smoothing is used. This gives more flexibility to how we can leverage this Moving Average in our charting.
- User can also select the Resolution and Source price for the CoRa_Wave. by default, they will be set to "same as chart" and hlc3
here are the formulas for our Compound Ratio moving average:
Compound Weight ratio r = (A/P)^1/t - 1
Weight at time t A = P(1 + r)^t
= Start_val * (1 + r) ^ index
index in the above formula is 0 for the furthest point out
Here's how CoRa_Wave compares to other common moving averages all set to the same length (20)
Proposed Usage
- CoRa_Wave can be used for any scenarios where we need a moving average that closely tracks the price, trend, swings with high responsiveness and little lag
- MA Cross-over scenarios - against another CoRa_Wave or any other MA
- below is a quick example scenario for how to utilize 2 CoRa_Wave lines of same length (one for open and one for closing price) to track swings and trends
- get as creative as you need :)
Code is commented - please feel free to leverage or customize further as you need.
👉 if you are interested in other moving averages i posted before, please check out the FiMA and the v_Wave ...

Detrended Rhythm Oscillator (DRO)How to detect the current "market beat" or market cycle?
A common way to capture the current dominant cycle length is to detrend the price and look for common rhythms in the detrended series. A common approach is to use a Detrended Price Oscillator (DPO). This is done in order to identify and isolate short-term cycles.
A basic DPO description can be found here:
www.tradingview.com
Improvements to the standard DPO
The main purpose of the standard DPO is to analyze historical data in order to observe cycle's in a market's movement. DPO can give the technical analyst a better sense of a cycle's typical high/low range as well as its duration. However, you need to manually try to "see" tops and bottoms on the detrended price and measure manually the distance from low-low or high-high in order to derive a possible cycle length.
Therefore, I added the following improvements:
1) Using a DPO to detrend the price
2) Indicate the turns of the detrended price with a ZigZag lines to better see the tops/bottoms
3) Detrend the ZigZag to remove price amplitude between turns to even better see the cyclic turns ("rhythm")
4) Measure the distance from last detrended zigzag pivot (high-high / low-low) and plot the distance in bars above/below the turn
Now, you can clearly see the rhythm of the dataset indicated by the Detrended Rhythm Oscillator including the exact length between the turns. This makes the procedure to "spot" turns and "measure" distance more simple for the trader.
How to use this information
The purpose is to check if there is a common rhythm or beat in the underlying dataset. To check that, look for recurring pattern in the numbers. E.g. if you often see the same measured distance, you can conclude that there is a major dominant cycle in this market. Also watch for harmonic relations between the numbers. So in the example above you see the highlighted cluster of detected length of around 40,80 and 120. There three numbers all have a harmonic relation to 40.
Once you have this cyclic information, you can use this number to optimize or tune technical indicators based on the current dominant cycle length. E.g. set the length parameter of a technical indicator to the detected harmonic length with the DRO indicator.
Example Use-Case
You can use this information to set the input for the following free public open-source script:
Disclaimer
This is not meant to be a technical indicator on its own and the derived cyclic length should not be used to forecast the next turn per se. The indicator should give you an indication of the current market beat or dominant beats which can be use to further optimize other oscillator or trading related settings.
Options & settings
The indicator allows to plot different versions. It allows to plot the original DPO, the DRO with ZigZag lines, the DRO with detrended ZigZag lines and length labels on/off. You can turn on or off these version in the indicator settings. So you can tweak it visually to your own needs.
