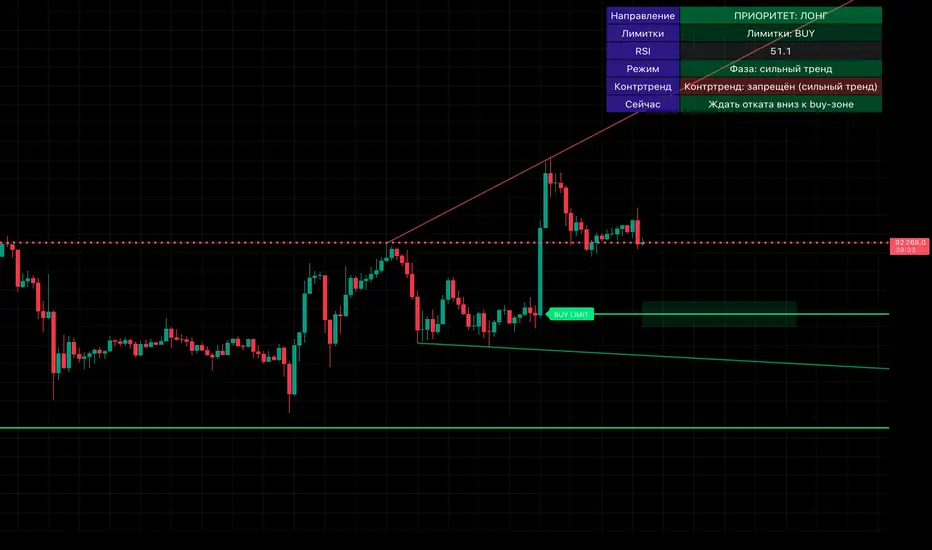
Smart Money OB + Limit Orders + PriorityDetects breaks of structure (BOS) using swing highs/lows and an ATR-filtered impulse bar.
Builds simple order-block based levels and plots theoretical limit orders:
Buy limits are always placed below current price.
Sell limits are always placed above current price.
Shows a higher-timeframe bias using EMAs on two selectable timeframes (for example H4 + H1).
Draws “HTF-style” trendlines on the current timeframe using wider swing points.
Calculates RSI and highlights overbought/oversold regions for context.
Draws an optional “accumulation zone” box around the nearest limit level.
Optional counter-trend status: when trend is not extremely strong and price/RSI are stretched, the script can visually suggest a possible counter-trend move towards the zone (dotted arrow).
Info panel in the top-right corner summarises:
Direction priority (long / short / none)
Limit side (BUY / SELL / none)
RSI value
Trend regime (no trend / weak / strong)
Counter-trend status
“Now” line – a short text description of the current situation.
Usage notes
This script is designed to make chart reading easier: it organises structure, bias and potential areas on the chart, so you can build your own trading plans.
It does not guarantee results and should not be considered financial advice.
Always confirm ideas with your own analysis and risk management before taking any trades.
Educational
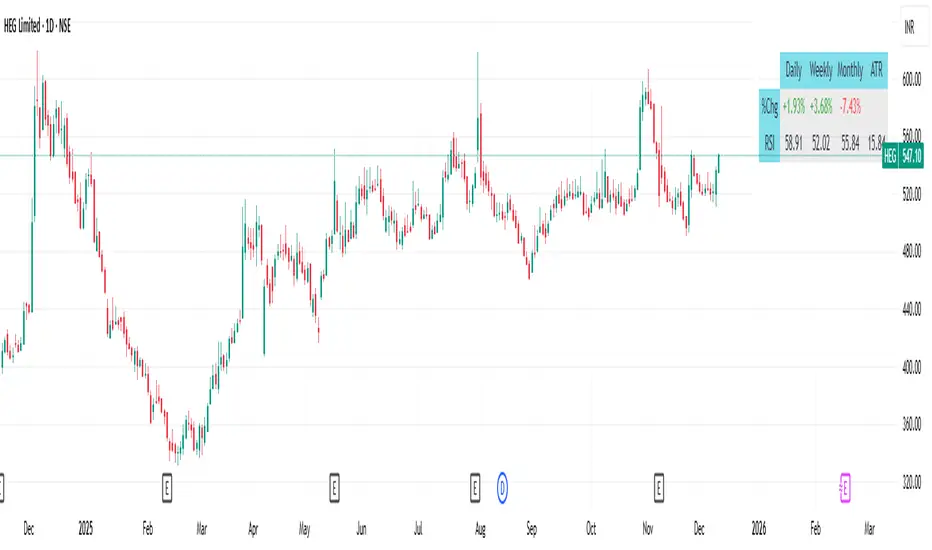
D/W/M RSI & %CHNG + ATRThis indicator provides a comprehensive, at-a-glance dashboard displaying key technical metrics across multiple timeframes: Daily, Weekly, and Monthly. It tracks Price Change Percentage, Relative Strength Index (RSI), and Average True Range (ATR) for each timeframe, helping traders quickly assess market trends, momentum, and volatility in one view.
Key Features:
Price Change % (Daily/Weekly/Monthly):
Displays the percentage change in price over the selected timeframes, giving traders insight into short-term, medium-term, and long-term price movement trends.
Relative Strength Index (RSI):
Shows the RSI value on Daily, Weekly, and Monthly timeframes. The RSI measures momentum, indicating overbought or oversold conditions:
Average True Range (ATR):
Tracks the ATR across multiple timeframes to assess market volatility. Higher ATR values signify more significant price movement (higher volatility), while lower values suggest quieter markets.
This indicator helps traders make informed decisions by quickly visualizing price momentum, market volatility, and possible trend reversals. It's ideal for swing traders, day traders, and long-term investors who need a bird's-eye view of the market across different timeframes.
How to Use:
Add the indicator to your TradingView chart.
Review the Price Change % to see how the market is trending across the selected timeframes.
Use the RSI to identify overbought or oversold conditions.
Check the ATR to assess current market volatility and adjust position sizes accordingly.
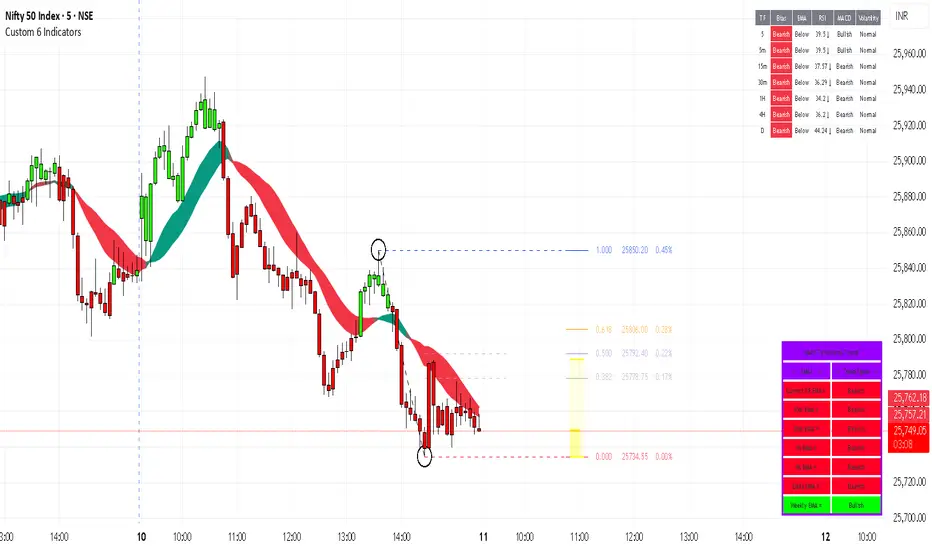
Custom 6 IndicatorsMulti-Timeframe Bias Dashboard
→ EMA (13, 21, 34), RSI (14), MACD (12,26,9), ATR Volatility
→ 7 टाइमफ्रेम्स पर एक साथ दिखाता है (Current, 5m,15m,30m,1H,4H,Daily)
SuperTrend (ATR-based Trailing Stop)
→ क्लासिक SuperTrend (ATR Period + Multiplier)
→ ट्रेंड डायरेक्शन और स्टॉप-लॉस लेवल देता है
Automatic Fibonacci Retracement (Swing-based)
→ पिछले स्विंग हाई/लो को डिटेक्ट करके
→ 0.0, 0.236, 0.382, 0.5, 0.618, 0.786, 1.0, 1.618, 2.618 लेवल्स ड्रॉ करता है
→ एक्सटेंशन और रिट्रेसमेंट दोनों दिखाता है
WaveTrend (LazyBear Style)
→ HEMA + SMA का कस्टम ऑसिलेटर
→ ग्रेडिएंट कलर के साथ प्लॉट होता है (नीचे pane में नहीं, चार्ट पर ही)
Engulfing + Doji + Candle Highlighting + RSI Filter
→ Bullish/Bearish Engulfing पैटर्न
→ Doji डिटेक्शन
→ RSI ओवरबॉट/ओवरसोल्ड फिल्टर के साथ सिग्नल
→ Candle highlighting (हर बार कलर चेंज)
Multi-Timeframe EMA Trend Table (दूसरी टेबल)
→ अलग से 13-period EMA को 7 टाइमफ्रेम्स पर चेक करके
→ नीचे दाहिनी तरफ दूसरी टेबल बनाता है (Current, 15m, 30m, 1H, 4H, D, W)
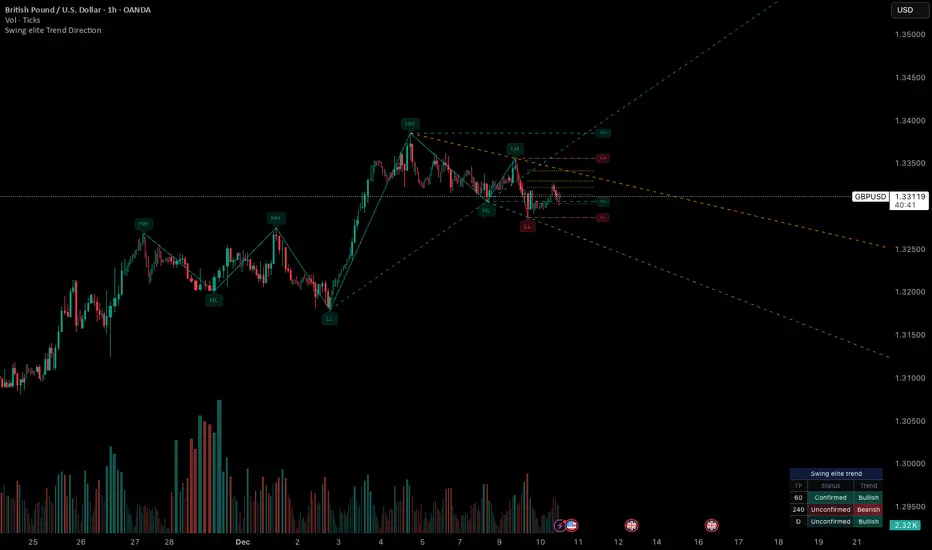
Swing elite Trend directionSwing elite Trend direction
A comprehensive market structure indicator that identifies swing highs/lows, labels them with HH/HL/LH/LL structure, draws dynamic trendlines, and provides multi-timeframe trend analysis.
🔹 FEATURES
Market Structure Analysis
Automatically detects swing highs and swing lows
Labels each pivot with its structure type: HH (Higher High), HL (Higher Low), LH (Lower High), LL (Lower Low)
Color-coded zigzag lines based on confirmed trend direction
Structure Trendlines
Downtrend Line: Connects HH to LH (resistance in bearish structure)
Uptrend Line: Connects LL to HL (support in bullish structure)
Extended projection for potential future price interaction
Swing Trendlines
Connects the last 2 swing highs (resistance trendline)
Connects the last 2 swing lows (support trendline)
Optional extension to project future levels
Break Levels
Horizontal lines at key structure points (HH, HL, LL, LH)
Visual reference for potential breakout/breakdown levels
Customizable colors for bullish and bearish breaks
Fibonacci Retracement
Auto-drawn between the last two pivots
Customizable levels: 0, 0.236, 0.382, 0.5, 0.618, 0.786, 1.0
Individual toggle and color settings for each level
Multi-Timeframe Dashboard
Displays trend status across 3 customizable timeframes
Shows trend direction: Bullish / Bearish / Neutral
Shows confirmation status: Confirmed / Unconfirmed
Color-coded for quick visual analysis
Trend Confirmation Logic (ICT/SMC Concepts)
Bullish Confirmed: HL followed by HH (Higher Low → Higher High pattern)
Bearish Confirmed: LH followed by LL (Lower High → Lower Low pattern)
Unconfirmed: Counter-structure appears (potential reversal signal)
🔹 SETTINGS
Swing Settings
Depth: Lookback period for pivot detection
Display
Toggle zigzag lines, labels, price on labels
Adjust label size and number of visible swings
Zigzag Settings
Line style: Solid, Dashed, Dotted
Thickness and colors for bullish/bearish trends
Swing Trendlines
Toggle high/low trendlines independently
Customizable colors, style, thickness
Option to extend trendlines
Structure Trendlines
Toggle HH→LH and LL→HL lines independently
Customizable colors, style, thickness
Option to extend trendlines
Break Levels
Toggle HH, HL, LL, LH break levels independently
Customizable colors for each level
Fibonacci
Toggle individual fib levels
Customizable colors and line style
Dashboard
Position: Top Left, Top Right, Bottom Left, Bottom Right
Size: Tiny, Small, Normal, Large
3 customizable timeframes
🔹 ALERTS
HH Broken: Price breaks above recent Higher High
HL Broken: Price breaks below recent Higher Low
LL Broken: Price breaks below recent Lower Low
LH Broken: Price breaks above recent Lower High
🔹 USE CASES
✅ Identify market structure and trend direction
✅ Spot potential trend reversals (unconfirmed status)
✅ Find key support/resistance levels
✅ Multi-timeframe trend alignment for trade confirmation
✅ Breakout/breakdown trading with break levels
✅ Fibonacci retracement entries
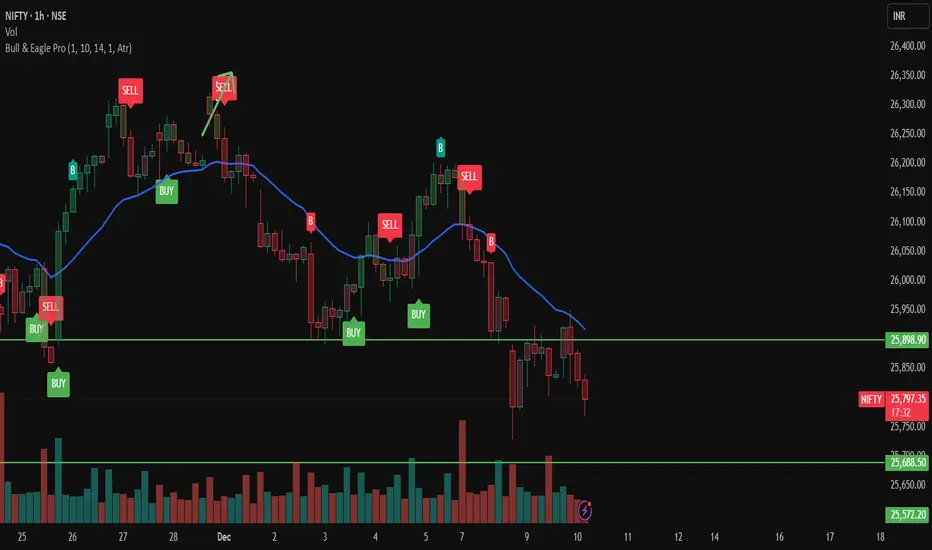
Sachin Bull & Eagle Pro (Invite-Only)Bull & Eagle Pro is a multi-confirmation trend & breakout framework designed for traders who prefer clean, actionable market structure signals.
It combines directional bias, momentum alignment, and trend structure monitoring into one visual system.
🔹 What this script does
✔ Detects directional shift using an ATR-based trailing structure
✔ Marks BUY and SELL signal events when momentum flips
✔ Colors price bars based on trend bias
✔ Tracks trend continuation using a 20-period EMA filter
✔ Draws dynamic adaptive trendlines based on pivots
✔ Highlights breakout events when price breaches a structural swing line
The tool helps traders see:
• Trend continuation
• Trend exhaustion
• Momentum reversals
• Structural breakouts
It is intended as a visual decision-support tool — not a guarantee of future price movement.
🔹 What makes it useful
Instead of acting as a standalone strategy, Bull & Eagle Pro acts as a confluence engine, helping traders:
• Validate breakout strength
• Identify bias shift points
• Spot momentum reversal zones
• Monitor clean price structure
Signals can be used to:
• Time entries
• Trail stops
• Confirm breakouts
• Manage position direction bias
🔹 Key Components
1️⃣ Trend Direction Engine
Based on a dynamic ATR trailing reference point identifying BUY/SELL flips.
2️⃣ 20 EMA Filter
A classic trend tool for acceleration vs. pullback phases.
3️⃣ Adaptive Trendlines
Automatically generated and extended into future bars to project structure.
4️⃣ Breakout Markers & Alerts
Plots “B” tags when price breaches structural trendlines.
🔹 Alerts Included
• Long Signal Trigger
• Short Signal Trigger
• Bullish Breakout
• Bearish Breakout
These allow automation or push notifications when structural shifts occur.
🔹 Intended Usage
This tool is best suited for:
• Trend traders
• Breakout traders
• Positional traders
• Swing traders
Works on:
• Index futures
• Stocks
• Cryptocurrency
• FX
• Options charts
It can be applied across intraday and higher-timeframe environments.
⚠ Important Disclaimer
This script is for educational and research purposes only.
It does not provide financial advice and does not guarantee results.
Trading involves risk — always perform independent analysis before acting on any tool.
Expert 3-EMA MTF SuiteCurrent 20 period EMA timeframe.
Other 2 20 period EMA timeframes (Options) can plot on current timeframe.

Alpha Simple Supply/Demand
Alpha Simple Supply/Demand
This indicator's primary function is to plot potential Supply (Resistance) and Demand (Support) zones on the chart by referencing the High and Low price points.
How It Functions
Supply Zones (Red): These are drawn around the Daily Highs and represent areas where selling pressure (resistance) is anticipated.
Demand Zones (Green): These are drawn around the Daily Lows and represent areas where buying pressure (support) is anticipated.
Application on a 30-Minute Chart
This setup helps you see how the current intra-day price action is interacting with the significant daily structural levels established over the past few sessions.


Vib ORB Range (Free)Vib ORB Range (Free) plots the Opening Range High and Low for the session based on a user-defined start time and duration.
This tool is designed for traders who want a clean, no-noise display of the ORB zone without extra indicators or automation.
Features:
Customizable Opening Range start time
Customizable Opening Range duration
Automatically resets daily
Plots ORB High, ORB Low, and optional ORB Midline
Shaded range zone for improved clarity
Works on all timeframes and markets
How to Use:
Set the ORB start time (default 9:30 New York)
Set the ORB duration (default 15 minutes)
The indicator will draw the ORB zone once the range completes
Use the outlines or shaded zone to visually identify potential breakout areas
This free tool is intended as a simple, reliable ORB visualizer without alerts, filters, or strategy logic.

Aroon High R02 - With RR Exit + TP Toggle + VWAPWhat this indicator is for
This is a trend-continuation breakout trading indicator designed to:
Catch strong upside momentum
Enter only after confirmation
Manage risk using fixed SL, RR-based trailing SL, and optional TP
Filter bad trades using VWAP
It’s meant for intraday & positional trading on indices and stocks.


YSD RSIYSD RSI
This indicator is an enhanced version of the traditional Relative Strength Index (RSI), designed to provide deeper insight into market momentum and trend quality. While the classic RSI focuses primarily on the ratio of recent gains to losses, this strengthened variant incorporates additional layers of analysis to capture subtler shifts in price behavior. By applying refined smoothing techniques, integrating volatility awareness, and emphasizing the consistency of directional movement, the indicator aims to reduce noise and highlight more reliable momentum signals. As a result, it not only identifies overbought and oversold conditions with greater precision but also reacts more intelligently to changing market environments. Traders can use this improved RSI to detect early trend reversals, filter out false signals, and gain a more comprehensive understanding of underlying price dynamics compared to the standard RSI.

SBMS RSIThis is everyones favourite RSI with small modification as it has 60 as breaout level and 40 as breakdown level, 80 as Overbrought zone and 20 as oversold zone. An EMA helps to stay in the trend.

30-Minute High and Low30-Minute High and Low Levels
This indicator plots the previous 30-minute candle’s high and low on any intraday chart.
These levels are widely used by intraday traders to identify key breakout zones, liquidity pools, micro-range boundaries, and early trend direction.
Features:
• Automatically pulls the previous 30-minute candle using higher-timeframe HTF requests
• Displays the HTF High (blue) and HTF Low (red) on lower-timeframe charts
• Works on all intraday timeframes (1m, 3m, 5m, 10m, etc.)
• Levels stay fixed until the next 30-minute bar completes
• Ideal for ORB strategies, scalping, liquidity sweeps, and reversal traps
Use Cases:
• Watch for breakouts above the 30-minute high
• Monitor for liquidity sweeps and fakeouts around the high/low
• Treat the mid-range as a magnet during consolidation
• Combine with VWAP or EMA trend structure for high-precision intraday setups
This indicator is simple, fast, and designed for traders who rely on HTF micro-structure to guide intraday execution.

🐋 MACRO POSITION TRADER - Quarterly Alignment 💎Disclaimer: This tool is an alignment filter and educational resource, not financial advice. Backtest and use proper risk management. Past performance does not guarantee future returns.
so the idea behind this one came from an experience i had when i first started learning how to trade. dont laugh at me but i was the guy to buy into those stupid AI get rich quick schemes or the first person to buy the "golden indicator" just to find out that it was a scam. Its also to help traders place trades they can hold for months with high confidence and not have to sit in front of charts all day, and to also scale up quickly with small accounts confidently. and basically what it does is gives an alert once the 3 mo the 6 mo and the 12 mo tfs all align with eachother and gives the option to toggle on or off the 1 mo tf as well for extra confidence. Enter on the 5M–15M after a sweep + CHOCH in the direction of the aligned 1M–12M bias. that simple just continue to keep watching key levels mabey take profit 1-2 weeks and jump back in scaling up if desired..easy way to combine any small account size.
Perfect balance of:
low risk
high R:R
optimal precision
minimal chop
best sweep/CHOCH clarity
hope you guys enjoy this one.

ShooterViz Lazy Trader EMA SystemShooterViz Lazy Trader EMA System - Complete User Guide
What This Script Does
This is a position scaling indicator that tells you exactly when to enter, add to, and exit trades using a simplified 5-EMA system. It removes the guesswork and decision fatigue from trading by giving you clear visual signals.
The Core Concept
3 entry signals that build your position from 20% → 50% → 100%
2 exit signals that scale you out at 50% → 50% (complete exit)
1 higher timeframe filter that keeps you on the right side of the trend
No Fibonacci calculations, no RSI divergence, no multi-indicator confusion. Just EMAs and price action.
What You'll See On Your Chart
1. Colored EMA Lines
Blue Lines (Entry Zone):
3 EMA (lightest blue) - Early reversal detector
5 EMA (darker blue) - Confirmation line
Green Lines (Add Zone):
21 EMA (bright green) - First add location
34 EMA (lighter green) - Final add location
Red Lines (Exit Zone):
89 EMA (lighter red) - First exit trigger
144 EMA (darker red) - Final exit trigger
Orange Lines (Hyper Frame - optional):
Hyper 21 EMA (from higher timeframe) - Trend direction
Hyper 34 EMA (from higher timeframe) - Bias confirmation
2. Triangle Signals
Green Triangles (Below Price) = BUY/ADD:
Lime triangle with "20%" = Entry 1: Price reclaimed 3→5 EMA (starter position)
Green triangle with "30%" = Entry 2: Price bounced off 21 EMA (first add)
Teal triangle with "50%" = Entry 3: Price broke out from 34 EMA compression (final add)
Red Triangles (Above Price) = SELL:
Orange triangle with "50% OFF" = Exit 1: Price broke below 89 EMA (take half off)
Red triangle with "EXIT ALL" = Exit 2: Price broke below 144 EMA (close remaining position)
3. Background Color (Trend Bias)
Light green background = Hyper frame EMAs trending up (bias LONG)
Light red background = Hyper frame EMAs trending down (bias SHORT)
Gray background = Neutral/choppy (be cautious)
4. Info Table (Top Right Corner)
A live status dashboard showing:
Which entry signals are currently active (✓ or —)
Which exit signals are currently active (⚠ or ⛔)
Current hyper frame bias (🟢 LONG / 🔴 SHORT / ⚪ NEUTRAL)
Which timeframe you're using for hyper frame filtering
How to Install and Set Up
Step 1: Add the Script to TradingView
Open TradingView
Click "Pine Editor" at the bottom of the screen
Copy the entire script code
Paste it into the Pine Editor
Click "Add to Chart"
Step 2: Configure Your Settings
Click the gear icon ⚙️ next to "LazyEMA" in your indicators list.
Critical Settings to Configure:
Hyper Frame Selection (Most Important!)
Location: "Hyper Frame (Pick ONE)" section
Setting: "Timeframe"
What to choose:
Trading 15min or 1H charts? → Use "240" (4-hour)
Trading 4H or Daily charts? → Use "D" (Daily)
Trading Daily or Weekly charts? → Use "W" (Weekly)
Why this matters: This filter keeps you aligned with the bigger trend. Only take longs when this timeframe is green, shorts when it's red.
MA Type (Optional, default is fine)
Location: "MA Config" section
Default: EMA (recommended)
Options: EMA, SMA, WMA, HMA, RMA, VWMA
Most traders should stick with EMA
Visual Toggles (Customize your view)
Entry Zone: Turn individual EMAs on/off (3, 5, 21, 34)
Exit Zone: Turn individual EMAs on/off (89, 144)
Hyper Frame: Toggle the higher timeframe EMAs on/off
Step 3: Clean Up Your Chart
Turn OFF these if visible:
Volume bars (they clutter the view)
Any other indicators you have loaded
Grid lines (optional, but cleaner)
Keep ONLY:
Price candles
Your ShooterViz Lazy Trader EMA System
Maybe support/resistance levels if you manually draw them
How to Trade With This Script
The Basic Workflow
Before the Market Opens:
Check the background color and info table bias
Green background? Look for LONG setups only
Red background? Look for SHORT setups only
Gray background? Stay flat or trade small
During the Trading Session:
LONGS (When hyper frame is bullish):
Wait for Entry 1 signal:
Lime triangle appears with "20%"
Price has reclaimed the 5 EMA after dipping to 3 EMA
Action: Enter 20% of your intended position
Stop loss: Place below the 5 EMA or recent swing low
Wait for Entry 2 signal:
Green triangle appears with "30%"
Price pulled back to 21 EMA and bounced
Action: Add 30% more (you're now at 50% total)
Move stop: Trail it up to below 21 EMA
Wait for Entry 3 signal:
Teal triangle appears with "50%"
Price compressed at 34 EMA and broke out
Action: Add final 50% (you're now 100% loaded)
Move stop: Trail it up to below 34 EMA
Wait for Exit 1 signal:
Orange triangle appears with "50% OFF"
Price broke below 89 EMA
Action: Exit 50% of your position immediately
Move stop on rest: Trail to 89 EMA or lock in profits
Wait for Exit 2 signal:
Red triangle appears with "EXIT ALL"
Price broke below 144 EMA
Action: Exit remaining 50% (you're now flat)
Or: Stop gets hit at 89 EMA (same result)
SHORTS (When hyper frame is bearish):
Same process, but inverted
Triangles appear above price instead of below
Look for breakdowns below EMAs instead of bounces off them
Exit when price reclaims 89 and 144 EMAs
Real-World Example Walkthrough
Setup: Trading ES (S&P 500 Futures) on 1H Chart
Chart Configuration:
Timeframe: 1 Hour
Hyper Frame: 240 (4-hour)
Ticker: ES
Pre-Market Check:
Background is light green
Info table shows "🟢 LONG" for Hyper Bias
Decision: Only look for long entries today
9:30 AM - Market Opens
Price dips and touches 3 EMA
Watch for: Reclaim of 5 EMA
9:45 AM - Entry 1 Triggers
Lime triangle appears below bar
Price closed above 5 EMA at $4,550
Action taken:
Enter long 20% position (2 contracts if targeting 10 total)
Stop loss at $4,545 (below 5 EMA)
Risk: $10 per contract × 2 = $20 risk
10:30 AM - Entry 2 Triggers
Price rallied to $4,565, pulls back
Green triangle appears at 21 EMA ($4,555)
Action taken:
Add 30% (3 more contracts, now have 5 total)
Move stop to $4,550 (below 21 EMA)
Current P/L: +$25 ($5 gain on original 2 contracts, break-even on new 3)
11:15 AM - Entry 3 Triggers
Price consolidates at 34 EMA around $4,560
Teal triangle appears as price breaks to $4,568
Action taken:
Add final 50% (5 more contracts, now have 10 total)
Move stop to $4,555 (below 34 EMA)
Current P/L: +$70
1:00 PM - Price Extends
Price rallies to $4,595 (on track)
89 EMA is at $4,575
No action yet, let it run
2:15 PM - Exit 1 Triggers
Price pulls back from $4,600
Orange triangle appears as price breaks below 89 EMA at $4,580
Action taken:
Exit 50% (5 contracts closed at $4,580)
Keep 5 contracts with stop at 89 EMA ($4,575)
Banked: +$150 average gain on closed 5 contracts
2:45 PM - Exit 2 Triggers
Price continues down
Red triangle appears as price breaks 144 EMA at $4,570
Action taken:
Exit remaining 5 contracts at $4,570
Banked: +$100 on remaining 5 contracts
Final Results:
Total gain: $250 on the trade
Initial risk: $50 (if stopped out at Entry 1)
Risk/Reward: 5:1
Time in trade: ~5 hours
Common Questions
"What if I miss Entry 1? Can I still take Entry 2?"
Yes! Each entry is independent. If you miss the 3→5 reclaim, wait for the 21 EMA bounce. You'll start with a 30% position instead of 20%, but that's fine.
Rule: Never chase. Wait for the next EMA setup.
"What if multiple entry signals trigger at the same bar?"
Rare, but possible. If you see both Entry 1 and Entry 2 trigger together:
Take Entry 1 first (20%)
If the next bar confirms Entry 2 is still valid, add 30%
When in doubt, scale in gradually
"The hyper frame is green but I'm seeing short signals?"
Don't take them. The hyper frame is your bias filter. If it says "go long," ignore short setups. They're usually lower probability and will get stopped out.
"Can I use this for swing trading overnight?"
Absolutely. Just switch your hyper frame:
If you're on Daily charts, use Weekly hyper frame
If you're on 4H charts, use Daily hyper frame
Adjust position sizes for overnight risk
"What if the signal appears right at market close?"
Don't chase it. Wait for the next bar (next day) to confirm. Signals that appear in the last 5 minutes are often noise.
"How do I set up alerts?"
Right-click on the chart
Select "Add Alert"
Choose "LazyEMA" from the condition dropdown
Select which signal you want alerts for:
Entry 1: 3→5 Reclaim
Entry 2: 21 EMA Add
Entry 3: 34 EMA Breakout
Exit 1: 89 EMA Break
Exit 2: 144 EMA Break
Click "Create"
Pro tip: Set up all 5 alerts so you never miss a signal.
Position Sizing Guide see
swingtradenotes.substack.com
Critical Rule: Know your total risk BEFORE you take Entry 1. Don't wing it.
Customization Tips
For Day Traders (Scalpers)
Use 5min or 15min charts
Hyper frame: 1H or 4H
Expect 2-4 setups per day
Tighter stops (0.5% risk per entry)
For Swing Traders
Use 4H or Daily charts
Hyper frame: Daily or Weekly
Expect 1-2 setups per week
Wider stops (1-2% risk per entry)
For Position Traders
Use Daily or Weekly charts
Hyper frame: Weekly or Monthly
Expect 1-2 setups per month
Widest stops (2-3% risk per entry)
The "Don't Be Stupid" Checklist
Before taking ANY signal from this script, ask:
✅ Is the hyper frame bias pointing in my direction?
✅ Is the signal clean (not at a weird time or during news)?
✅ Do I know my stop loss level?
✅ Do I know my position size?
✅ Can I afford to lose if this trade fails?
If you answered "no" to ANY of these, skip the trade.
Troubleshooting
"I'm not seeing any signals"
Possible causes:
The "Show Lazy Trader System" toggle is off (turn it on)
Your chart timeframe is too high (try 1H or 4H)
Market is in a tight range (EMAs are compressed)
You need to refresh the chart
"Too many signals, getting whipsawed"
Fixes:
Increase your chart timeframe (go from 15m to 1H)
Switch to a less volatile ticker
Only trade when hyper frame bias is STRONG (not neutral)
Add a minimum bar count between signals
"The info table is covering my price action"
Fix:
Edit the script
Find the line: table.new(position.top_right, ...
Change position.top_right to position.bottom_right or position.top_left
"Signals appear then disappear"
This is normal (repainting). Some signals (especially compression breakouts) can disappear if the next bar reverses. This is why you:
Wait for bar close before acting
Use alerts that only fire on confirmed bars
Don't chase signals mid-bar
Final Thoughts
This script is a decision-making tool, not a crystal ball. It shows you high-probability setups based on EMA dynamics and trend structure. You still need to:
Manage your risk
Choose your position size
Stick to the rules
Accept losses when they happen
The system works when YOU work the system.
Print this guide, tape it next to your monitor, and follow it religiously for 20 trades before making ANY changes.
Good luck, and stay lazy (the smart way).

SHUBHAM 50000 ULTRA OPTIONSHUBHAM 50000 ULTRA OPTION
OptionFlow Pro: Smart Money & Anomaly Detection Indicator
Tagline: Don't just follow the flow. Understand it.
Core Concept:
OptionFlow Pro is an advanced, real-time market scanner and visual indicator that transforms raw options chain data into actionable trading intelligence. It goes beyond simple volume and open interest by identifying Unusual Options Activity (UOA), tracking Sweep Orders, and calculating the Volume-Weighted Put/Call Ratio to highlight where institutional "smart money" is placing its bets.
Key Features for Traders:
Unusual Activity & Sweep Detector:
What it does: Scans every tick for orders that significantly deviate from normal trading patterns—large block trades executed at the ask (for calls) or bid (for puts), and "sweep" orders that clean out multiple price levels instantly.
Trader Benefit: Pinpoints potential breakout or breakdown candidates before major moves occur in the underlying stock. Alerts you to aggressive, high-conviction buying or selling that retail traders often miss.
Volume-Weighted Put/Call Ratio (with Trend):
What it does: Calculates the put/call ratio not just by volume, but by the premium spent. A high premium-weighted put/call ratio shows bears are putting serious money behind their bets, making it a stronger signal.
Trader Benefit: Offers a more nuanced view of market sentiment than standard PCR. Helps gauge extreme fear (potential oversold bounce) or complacency (overbought top) in a specific stock or index (SPX/SPY).
Max Pain & Gamma Exposure (GEX) Visualizer:
What it does: Dynamically calculates the "Max Pain" strike (where option sellers face minimal losses) and estimates Gamma Exposure levels. Visual overlays on the chart show key pin levels and large gamma walls.
Trader Benefit: Identifies potential price magnets for weekly/monthly expiry. Understand where hedging activity by market makers may amplify volatility (negative gamma) or suppress it (positive gamma), aiding in entry/exit planning.
Implied Volatility (IV) Rank & Skew Analysis:
What it does: Compares current IV to its historical range (IV Rank) and visualizes the volatility smile/skew across strikes. Highlights expensive vs. cheap option premiums.
Trader Benefit: Empowers you to sell overpriced volatility (high IV Rank) and buy underpriced volatility (low IV Rank). Skew anomalies can signal asymmetric risk/reward opportunities or market fears about a sharp directional move.
Customizable Alerts & Heatmaps:
What it does: Set alerts for specific UOA criteria, PCR spikes, or IV changes. The platform-wide heatmap aggregates flow data across all symbols to show sector-level money movement.
Trader Benefit: Saves hours of manual scanning. Focus only on the setups that match your strategy (e.g., "Alert me for any $1M+ call sweeps in tech stocks").
Who Is It For?
Active Options Traders & Scalpers: Find high-probability directional plays with institutional confirmation.
Hedgers & Portfolio Managers: Identify tail-risk hedging activity and gauge overall market dealer positioning.
Volatility Traders: Precisely time entries for strangles, straddles, or iron condors based on IV regime and gamma.
Swing Traders & Technical Analysts: Confirms or diverges from classic chart patterns (e.g., breakout with strong call flow = higher conviction).
Why It's Different:
Most indicators look backward at price. OptionFlow Pro looks forward at market structure, liquidity, and dealer hedging flows. It doesn't predict the future; it reveals the present positioning that will influence future price action.
Platform Integration: Available as a standalone web platform, a TradingView custom script, and a direct data feed into thinkorswim, Interactive Brokers, and other major brokerages.

RenkoFlow PercentualIt calculates brick size as a percentage of the chart’s initial price and updates bricks only when price moves one full brick size up or down.
Green bricks represent upward movement and red bricks represent downward movement.
This tool is designed to help visualize directional price changes independently of time and can be used as a clean trend-filtering reference on any timeframe.

Long Term Holder Supply 155 DayThe “Long Term Holder Supply 155 Day” indicator is designed to bring on-chain inspired long-term analysis directly into chart-based technical trading.
The concept comes from the idea of Long-Term Holder (LTH) Supply, frequently used in Bitcoin on-chain analytics to identify price zones where long-term holders accumulated coins. These areas tend to act as strong support and resistance because long-term holders historically accumulate during undervaluation phases and distribute during overheated cycles.
What makes this script original
Unlike traditional moving averages or basic Donchian channels, this indicator combines both concepts using the same 155-day window, creating a unified model that visually represents:
The average long-term holder cost basis (via SMA 155).
The range of supply and demand zones historically defined by price extremes (via Donchian 155).
A trend-reactive color system that makes interpretation intuitive and immediate.
This dual-structure is not commonly found in standard TradingView scripts and is inspired by on-chain research methodology adapted for chart traders.
How it works
1. SMA 155 (LTH Mean Price)
Represents the long-term holder cost basis proxy.
Turns green when price is above it (market strength above holder basis).
Turns red when price is below it (market trading at a discount relative to long-term holders).
This allows traders to quickly identify whether Bitcoin is in a LTH profit or LTH loss environment — a critical on-chain concept.
2. Donchian Channel 155 (LTH Supply Range)
Upper Band (Green): Highest high of the last 155 days — interpreted as the upper bound of LTH supply/resistance.
Lower Band (Red): Lowest low of the last 155 days — interpreted as the lower bound of LTH accumulation/support.
This creates a long-term structural range showing where long-term holders were historically more likely to buy (lower band) or distribute (upper band).
How to use it
Bullish conditions:
Price breaks above the SMA 155.
Price begins approaching or breaking the upper Donchian band → signs of macro strength and potential long-term breakout.
Bearish conditions:
Price drops below SMA 155 (LTH basis lost).
Price moves toward the lower Donchian band → zone where long-term holders historically accumulate during deep value phases.
Sideways Accumulation:
Price oscillates inside the Donchian bands while hugging the SMA 155 → potential long-term consolidation before trend reversal.
Who this indicator is for
Long-term Bitcoin analysts
Swing traders
Investors tracking macro cycles
Traders who want lightweight on-chain logic without needing blockchain datasets
Core methodology behind the script
The indicator is built around:
SMA 155 → represents long-term average cost basis
Donchian 155 → long-term supply/demand range
Color-based trend confirmation → chart-based interpretation of on-chain behavior
This combination brings an on-chain inspired long-term model into pure price action, making it usable even by traders without access to blockchain data.

Market Structure Shift (MSS) [Sword & Shield]MARKET STRUCTURE SHIFT (MSS)
A clean and focused indicator for identifying Market Structure Shifts in price action.
════════════════════════════════════════════════════════════════════════════════
WHAT IS MARKET STRUCTURE SHIFT (MSS)?
════════════════════════════════════════════════════════════════════════════════
A Market Structure Shift occurs when price breaks a significant swing high or swing low,
indicating a potential change in market direction. This indicator automatically detects
and plots these key levels.
BULLISH MSS: Price breaks above a previous swing high
BEARISH MSS: Price breaks below a previous swing low
════════════════════════════════════════════════════════════════════════════════
FEATURES
════════════════════════════════════════════════════════════════════════════════
CLEAN DISPLAY
- Shows only the last 2 MSS by default (1 bullish + 1 bearish)
- Keeps charts clean and focused on recent structure
- Automatically removes old MSS when new ones appear
CUSTOMIZABLE DETECTION
- Adjustable swing detection (left/right bars)
- Choose break confirmation method (Close or Wick)
- Fixed-length lines (no infinite extension by default)
SMART FILTERING
- Only plots one MSS per direction until opposite MSS occurs
- Prevents duplicate signals in the same direction
- Clear visual distinction between bullish (blue) and bearish (red)
CLEAN LABELS
- Text labels positioned above lines
- No background tooltips for cleaner appearance
- Color-matched to their respective MSS lines
════════════════════════════════════════════════════════════════════════════════
SETTINGS
════════════════════════════════════════════════════════════════════════════════
SWING DETECTION
- Swing Left Bars (default: 2)
- Swing Right Bars (default: 2)
- Higher values = more significant swings detected
BREAK CONFIRMATION
- Close: MSS confirmed when candle closes beyond level
- Wick: MSS confirmed when wick touches beyond level
DISPLAY OPTIONS
- Show Only Last 2 MSS: ON by default (keeps chart clean)
- Extend lines to the right: OFF by default (fixed-length lines)
- Line bars (when not extended): 50 bars (customizable)
════════════════════════════════════════════════════════════════════════════════
HOW IT WORKS
════════════════════════════════════════════════════════════════════════════════
DETECTION LOGIC
1. Identifies swing highs and swing lows using pivot detection
2. Monitors price action for breaks of these levels
3. Confirms break based on selected method (Close or Wick)
4. Plots MSS line at the broken level
FILTERING LOGIC
- Only one MSS per direction is allowed consecutively
- Example: If bullish MSS appears, no new bullish MSS until bearish MSS occurs
- This prevents multiple signals in trending markets
DISPLAY LOGIC
- When "Show Only Last 2 MSS" is enabled:
• Only the most recent bullish MSS is shown
• Only the most recent bearish MSS is shown
• Old MSS are automatically deleted when new ones appear
- When disabled: All historical MSS remain visible
════════════════════════════════════════════════════════════════════════════════
USAGE EXAMPLES
════════════════════════════════════════════════════════════════════════════════
FOR TREND IDENTIFICATION
- Bullish MSS = Potential uptrend beginning
- Bearish MSS = Potential downtrend beginning
- Use in conjunction with other indicators for confirmation
FOR ENTRY SIGNALS
- Wait for MSS to confirm trend change
- Enter on pullback to MSS level
- Use MSS as support/resistance
FOR SCALPING (Lower Timeframes)
- Swing Left/Right Bars: 2-3 (more sensitive)
- Break Confirmation: Close (more reliable)
- Show Only Last 2 MSS: ON (cleaner charts)
FOR SWING TRADING (Higher Timeframes)
- Swing Left/Right Bars: 5-10 (more significant swings)
- Break Confirmation: Close (avoid false breaks)
- Show Only Last 2 MSS: ON or OFF based on preference
════════════════════════════════════════════════════════════════════════════════
VISUAL DESIGN
════════════════════════════════════════════════════════════════════════════════
LINES
- Dashed style for easy identification
- Blue for bullish MSS
- Red for bearish MSS
- Fixed length (50 bars default) for cleaner appearance
LABELS
- "MSS" text positioned above each line
- No background for clean display
- Color-matched to line color
- Small size to avoid chart clutter
════════════════════════════════════════════════════════════════════════════════
CREDITS & LICENSE
════════════════════════════════════════════════════════════════════════════════
© Sword & Shield
This Pine Script code is subject to the terms of the Mozilla Public License 2.0
mozilla.org

Precious Matrix Signal-S-L15-sum⭐ PRECIOUS MATRIX SIGNAL™
Today Range + R1–R6 Multi-Layer Market Structure Engine
Final Output → 🔵 BUY | 🔴 SELL | ⏹ NEUTRAL
A powerful, multi-range decision engine that reads today’s live structure and compares it with six major past ranges, Δ/E shifts, and daily strength summaries to generate a precise directional signal.
📘 What This Indicator Does
This indicator builds a complete price-behavior matrix combining:
🔹 Today’s High–Low structure
🔹 Six custom historical ranges (R1–R6)
🔹 Live Δ/E trend shifts
🔹 A/R (Above–Below Range) positioning
🔹 Remaining Potential %
🔹 Last-5, Last-10, Last-15 day trend summary
🔹 Auto Spot–Future selection
🔹 Lot size & Margin info
( Not for dark mode &only on NSE Futures & Spot )
All layers combine to produce a single actionable signal.
🔶 How It Works (Simple Flow)
1️⃣ Symbol Auto-Detection
If chart is futures, uses futures data
If futures range missing → switches to continuous 1!
If chart is spot, uses spot cleanly
Auto-reads lot size and margin
2️⃣ Today’s Live Range Engine
Live High / Low
Time of High & Low
Δ (Range size)
A/R (Where current price sits inside the range)
Remaining Potential % (powerful continuation measure)
3️⃣ R1–R6 Custom Range Engine
Each user-set range displays:
High & Low
Δ
A/R positioning
Remaining Potential %
Overshoot/Breakdown markers
Δ/E (Direction shift)
Color-coded range strength
4️⃣ Δ/E Shift Logic (Live Mode)
For each R1–R6:
Prev = previous close before the range
E = end-close of the range
Δ/E = Direction:
▲ Positive → Bullish
▼ Negative → Bearish
■ Neutral → Sideways
If the range ends today → uses intraday close (E*).
5️⃣ Trend Validation (Last-5 / 10 / 15 Days)
Automatic summary tables:
Daily Date
Close
H/L
Δ
A/R
Net Trend Color
Strongest zone marked
This prevents false signals and confirms bias.
6️⃣ Final Signal Engine
Uses a weighted scoring across:
Today’s bias
R1–R6 bias
Δ/E direction
Remaining potential
Last-5/10/15 confirmation
🔵 BUY
→ Majority Ranges UP
→ Today’s structure UP
→ Δ/E = ▲
→ Last-5 positive
🔴 SELL
→ Majority Ranges DOWN
→ Today’s structure DOWN
→ Δ/E = ▼
→ Last-5 negative
⏹ NEUTRAL
→ Mixed or no clear dominance
→ Low potential/compressed price
📊 Dashboard Panels
Panel 1 – Today + R1–R6 Master Matrix
Shows:
H / L / Δ
A/R
Remaining Potential %
Δ/E (live option)
Range badges & colors
Panel 2 – Last-5 / 10 / 15 Summary
Your secondary confirmation panel.
Panel 3 – Lot Size + Margin
Auto margin estimate at 24%.
⚙️ Input Controls
Show/Hide HLX Panel
Custom Range Start/End
Δ/E Live Override
Force Intraday Mode
Last-5/10/15 Selector ( last work properly display on mobile )
Nudge (Panel Offset)
Potential % thresholds
Designed to adjust smoothly for all timeframes.
🎯 Recommended Usage
Use on 3m / 5m / 15m / 30m / 1H / 2H / 4H
Works great on Index Futures, Stock Futures, and Spot
Keep Option-2 Δ/E enabled for live trading
Last-5 and R2–R6 give strongest confirmation for trend days
📈 Who Is This For?
Traders who want:
Multi-range professional context
Reliable bias confirmation
High-probability directional entries
Auto-range intelligence without manual marking
Futures–spot multi-engine precision
🟢 SUPER-SIMPLE FLOWCHART
START
|
Detect Spot/Future + Lot
|
Compute TODAY H/L
|
Compute R1–R6 Ranges
|
Apply Δ/E Live Logic
|
Build Range Strength Score
|
Build Last5/10/15 Trend
|
Combine All Scores (matrix)
|
BUY ? SELL ? NEUTRAL ?
|
Display Full Dashboard
🛑 Disclaimer
This is an educational tool.
No buy/sell recommendations.
Always use proper risk management.

Elliott Wave Principle Pro - Frost & Prechter [abusuhil]الوصف العربي اسفل الوصف الإنجليزي .
✅ Professional Description (English)
Elliott Wave Principle Pro – Frost & Prechter Edition
A complete, professional-grade Elliott Wave detection and trading system designed for traders who want to identify market structure with precision and execute trades based on confirmed wave completion signals — without repainting.
This indicator combines the classical Elliott Wave rules from Frost & Prechter’s “Elliott Wave Principle” with modern algorithmic detection, Fibonacci validation, ZigZag pivot systems, and fully automated entry/exit levels.
⭐ Core Features
1. Automatic Elliott Wave Detection
Detects Impulse Waves (5-3-5-3-5)
Detects Corrective Waves (ABC) including:
• Zigzag
• Flat
• Expanded Flat
Supports multiple wave degrees (Cycle → Minuette)
2. Strict Elliott Rule Engine
All major EW rules are applied:
Wave 2 never retraces beyond Wave 1
Wave 4 must not overlap Wave 1
Wave 3 is never the shortest
Wave relationships validated using Fibonacci ratios
You can choose Strict / Standard / Flexible rule modes.
⭐ 3. Non-Repainting Confirmation System
Waves are confirmed only after pivot completion
Signals never change once displayed
Historical signals remain stable
Fully resistant to repainting
⭐ 4. Automated Trading Signals
Every completed structure triggers:
BUY Signals
End of Wave C
End of bearish Impulse (Wave 5)
SELL Signals
End of Wave 5 in bullish impulse
End of bullish ABC correction
Each signal includes:
Entry Line
Stop Loss (3 methods: Wave / ATR / Fixed)
TP1 – TP2 – TP3 (Fibonacci-based or Wave Projected)
Optional PRZ (Potential Reversal Zone)
You may show only the latest signal for clarity.
⭐ 5. Advanced Visual Tools
Wave numbers (1–5 / A–B–C)
Wave lines
Channels
Projection levels
Degree colors
Customizable labels and signal shapes (Box / Arrow / No Text)
A clean Simple Mode is available to hide all waves and show signals only.
⭐ 6. Informational Table (Optional)
Displays:
Last detected structure
Direction (Bullish / Bearish)
Active signal status (Buy / Sell / Wait)
⭐ How Traders Benefit
This tool helps traders:
Understand the full Elliott Wave context instantly
Know exactly when a wave cycle has completed
Enter trades with predefined, optimized levels
Avoid emotional decisions and subjective wave counting
Rely on a non-repainting analytical engine
Identify high-probability reversal zones
Improve trade timing and risk management
Perfect for swing trading, intraday trading, and wave practitioners.
🇸🇦 الوصف الاحترافي (العربية)
Elliott Wave Principle Pro – نسخة فروسـت وبريشتـر
مؤشر احترافي متكامل لتحليل موجات إليوت واكتشاف البُنى السعريّة بشكل آلي ودقيق، مع إعطاء إشارات تداول مؤكدة عند اكتمال الموجات — بدون إعادة رسم (Non-Repainting).
يجمع هذا المؤشر بين قواعد مدرسة إليوت الكلاسيكية من كتاب “Elliott Wave Principle” وبين خوارزميات حديثة تعتمد على الـ ZigZag، والفيبوناتشي، والتحقق الرياضي من صحة الموجة.
⭐ أهم المزايا
1. اكتشاف آلي كامل لموجات إليوت
اكتشاف الموجات الدافعة Impulse 5-3-5-3-5
اكتشاف الموجات التصحيحية ABC بما يشمل:
• Zigzag
• Flat
• Expanded Flat
دعم جميع درجات الموجة من Cycle حتى Minuette
⭐ 2. محرك قواعد إليوت الاحترافي
يطبق المؤشر جميع القواعد الأساسية لموجات إليوت، مثل:
الموجة 2 لا تتجاوز بداية الموجة 1
الموجة 4 يجب ألا تتداخل مع الموجة 1
الموجة 3 ليست الأقصر
تأكيد العلاقات باستخدام نسب فيبوناتشي
مع إمكانية اختيار نمط القواعد: صارم / قياسي / مرن.
⭐ 3. نظام تأكيد بدون إعادة رسم
لا يتم تأكيد الموجة إلا بعد اكتمالها فعليًا
لا يتم حذف أي إشارة بعد ظهورها
جميع النتائج ثابتة وغير قابلة للتغيير
مقاوم لإعادة الرسم 100%
⭐ 4. إشارات تداول تلقائية
يصدر المؤشر إشارات شراء وبيع عند اكتمال التركيبات التالية:
إشارات BUY
نهاية موجة C
نهاية موجة 5 الهابطة (انعكاس صاعد)
إشارات SELL
نهاية موجة 5 الصاعدة
نهاية تصحيح ABC الصاعد
وتتضمن الإشارة:
مستوى الدخول
وقف الخسارة (Wave / ATR / نسبة ثابتة)
الأهداف TP1 – TP2 – TP3
منطقة انعكاس محتملة PRZ (اختيارية)
ويمكن عرض آخر إشارة فقط لسهولة القراءة.
⭐ 5. أدوات بصرية متقدمة
ترقيم الموجات 1–5 و A–B–C
خطوط الموجات
قنوات Elliott
مستويات الإسقاط
ألوان الدرجات
تخصيص شكل الإشارة (مربع / سهم / بدون نص)
كما يمكن تفعيل الوضع البسيط لإظهار الإشارات فقط.
⭐ 6. جدول معلومات الاختياري
يعرض:
نوع آخر موجة مكتشفة
اتجاهها (صاعد / هابط)
حالة الإشارة الحالية (شراء / بيع / انتظار)
⭐ فوائد استخدام المؤشر للمتداول
هذا المؤشر يساعدك على:
فهم بنية موجات إليوت دون قراءة الشارت يدويًا
اكتشاف نقاط الانعكاس القوية قبل حدوثها
الدخول في صفقات محسوبة مسبقًا (Entry + SL + TP)
تقليل التشتت والتقدير الشخصي في العدّ
تحسين إدارة المخاطر
تعزيز دقة التوقيت في بداية الاتجاهات الجديدة
دراسة السوق بطريقة احترافية تعتمد على قاعدة علمية واضحة
مثالي للمضارب اليومي، المتداول المتأرجح، ولممارسي مدرسة إليوت.
