Elliott Wave [LuxAlgo]The Elliott Wave indicator allows users to detect Elliott Wave (EW) impulses as well as corrective segments automatically on the chart. These are detected and displayed serially, allowing users to keep track of the evolution of an impulse or corrective wave.
Fibonacci retracements constructed from detected impulse waves are also included.
This script additionally allows users to get alerted on a wide variety of trigger conditions (see the ALERTS section below).
🔶 SETTINGS
🔹 Source
• "high" -> options high, close, maximum of open/close
• "low" -> options low, close, minimum of open/close
🔹 ZigZag
• The source and length are used to check whether a new Pivot Point is found.
Example:
• source = high/low, length = 10:
• There is a new pivot high when:
- previous high is higher than current high
- the highs of 10 bars prior to previous high are all lower
• These pivot points are used to form the ZigZag lines, which in their turn are used for pattern recognition
🔶 USAGE
The basic principles we use to identify Elliott Wave impulses are:
• A movement in the direction of the trend ( Motive/Impulse wave ) is divided in 5 waves (Wave 1 -> 5)
• The Corrective Wave (against the trend) is divided in 3 waves (Wave A -> C)
• The waves can be subdivided in smaller waves
• Wave 2 can’t retrace more than the beginning of Wave 1
• Wave 4 does not overlap with the price territory of Wave 1
Here we see an example:
Let's look at the development:
• 1 bar after point (5) a confirmed 5 Motive Wave pattern is found (1 -> 5; The 5 Waves can also be seen as one large Wave 1 ).
• Next, the script draws a set of Fibonacci lines, which are area's where the Corrective Wave potentially will bounce.
Here we see the fifth wave is getting larger, the previous highest point is updated, and the Wave 5 is larger than Wave 3 :
(At this point, the pattern is invalidated, and it display as dotted)
Further progression in time:
At this point, a confirmed " 3 Corrective Wave pattern " is found (a -> c)
When a new high has developed, a circle is drawn (in the same color of the lines)
However, when the bottom of the drawn box has breached, a red cross will be visualized.
Further progression:
Later on, a bearish confirmed " 5 Motive Wave pattern " is found (1 -> 5):
When a Corrective Wave becomes invalidated, the ABC pattern will display as dashed (not dotted):
🔶 TECHNIQUES
Pine Script™ introduces methods!
• More information can be found here:
• Pine Script™ v5 User Manual 👉 Methods
• Pine Script™ language reference manual 👉 method
🔶 ALERTS
Dynamic alerts are included in the script, you only need to set 1 alert to receive following messages:
• When a new EW Motive Pattern is found (Bullish/Bearish )
• When a new EW Corrective Pattern is found (Bullish/Bearish )
• When an EW Motive Pattern is invalidated (Bullish/Bearish )
• When an EW Corrective Pattern is invalidated (Bullish/Bearish )
• When possible, a start of a new EW Motive Wave is found (Bullish/Bearish )
• Here is information how you can set these alerts()
Elliottwavecount

Elliott Wave - HAP [PRO] █ OVERVIEW
Meet HAP WAVE's real-time automated wave drawing tool on the chart. HAP WAVES Indicator is a technical analysis tool that uses Elliott Wave Theory and various technical indicators to analyze price and volume data in financial markets, such as crypto, stocks, and forex. It automatically draws Elliott Waves on the chart in real-time and provides features to identify potential buy and sell signals. The indicator can be used to identify target areas for waves 3, 5, and C, and shows both downward and upward waves. Additionally, the tool displays the real-time ratio of each wave and allows users to adjust wave rules flexibly. The tool also provides pre-sign analysis to help users predict future waves and includes alerts for various events, such as the start of a wave or the failure of a wave pattern. The indicator includes a trend channel and has several pairs of scan-wave tools. including real-time wave counting
════════════════════════
🎯 Feature
• Can draw wave lines in real time, indicating at that moment what wave the market is in.
• Automatically identify the target area of waves 3, 5, and C.
• Keep drawing waves automatically. All waves
• Shows both a downward wave (Bear) and an upward wave (Bull).
• Displays the real time ratio of each wave. (when hovering over the wave number)
• Each wave rule can be adjusted flexibly.
• Pre-show signs analyze waves that may occur in the future.
• Alert yourself when you encounter waves that are likely to occur in advance.
• Notify when meeting the start of a given wave.
• Alert when wave 2,4,A,B fail
• Notify when the wave is expanding again
• Multiple alert formats (save your alert, set it up just once, and receive all alerts according to 9–12)
• Hit Trend Channel from Automatic Coupled Price Swing
*There are also several pairs of scan wave tools.
════════════════════════
🔻Components
🎯 Unlocking the Power of the Elliott Wave Theory
feature that can set the starting point of the wave. by yourself
Trend Following Of course, adding this could be an element to help you make your decision easier.
Support and resistance
🎲 Scan version
This :
================================
🎯 Explanation of the wave counter setting section
════════════════════════
⬜ Understanding its basic principles and rules
Elliott Wave Prediction
Elliott Wave Theory is a technical analysis tool that seeks to identify patterns in financial market data and to make predictions about future price movements. The theory was developed by Ralph Nelson Elliott in the 1930s and is based on the idea that financial markets move in repetitive patterns, or waves, that can be analyzed and traded.
The Elliott Wave Theory has specific rules and guidelines for counting waves and determining their characteristics, including direction, size, and duration. The theory divides waves into two categories: motive waves (1, 2, 3, 4, and 5) and corrective waves (A, B, C). Motive waves are those that move in the direction of the overall trend and are subdivided into five smaller waves. Corrective waves are those that move against the trend and are subdivided into three smaller waves.
The theory also includes guidelines for determining the end of a wave and the start of a new wave, as well as rules for determining the characteristics of each wave, such as its size and duration. By analyzing the characteristics of waves and applying the rules and guidelines of the Elliott Wave Theory, traders and investors can make informed decisions about buying and selling in financial markets.
In summary, the Elliott Wave Theory is a technical analysis tool that seeks to identify patterns in financial market data and to make predictions about future price movements. The theory is based on the idea that financial markets move in repetitive patterns, or waves, and has specific rules and guidelines for counting and analyzing these waves.
>> The Elliott Wave Theory divides financial market movements into two categories: motive waves and corrective waves. Each wave has its own cycle and purpose, and understanding these cycles is important for making informed decisions about buying and selling in financial markets.
Motive Waves: Motive waves move in the direction of the overall trend and are subdivided into five smaller waves. The five waves of a motive wave cycle are:
•Wave 1: The first wave of a motive wave cycle is often referred to as the "impulse wave." This wave represents the beginning of a new trend and is characterized by strong price movements in the direction of the trend.
•Wave 2: The second wave is a corrective wave that retraces a portion of the gains made in Wave 1. This wave is usually smaller and less intense than Wave 1.
•Wave 3: The third wave is usually the longest and strongest wave of the motive wave cycle, and it represents the continuation of the trend. This wave is characterized by strong price movements in the direction of the trend and is usually much larger than Waves 1 and 2.
•Wave 4: The fourth wave is a corrective wave that retraces a portion of the gains made in Wave 3. This wave is usually smaller and less intense than Waves 1 and 3, and it provides a temporary pause in the trend.
•Wave 5: The fifth wave is the final wave of the motive wave cycle and is usually the shortest and weakest wave. This wave represents the end of the trend and is characterized by a final push in the direction of the trend.
Corrective Waves: Corrective waves move against the trend and are subdivided into three smaller waves. The three waves of a corrective wave cycle are:
•A. Wave A: The first wave of a corrective wave cycle is often referred to as the "A wave." This wave is characterized by a downward move against the trend and represents the start of a correction.
•B. Wave B: The second wave of a corrective wave cycle is the "B wave." This wave is characterized by an upward move against the trend, and it represents the counter-trend rally.
•C. Wave C: The final wave of a corrective wave cycle is the "C wave." This wave is characterized by a downward move in the direction of the trend, and it represents the completion of the correction.
In summary, the Elliott Wave Theory divides financial market movements into two categories: motive waves, which move in the direction of the trend, and corrective waves, which move against the trend. Understanding the cycle of each wave is important for making informed decisions about buying and selling in financial markets.
════════════════════════
🎯 CONCEPTS (Disclaimer)
Elliott Wave Count
The HAP WAVES indicator is designed for experienced traders who are familiar with advanced trading techniques. This tool is intended for day traders and long-term investors who have a solid understanding of the market and are looking to improve their trading strategy. The indicator was created by a well-known market analyst and is based on the principles and techniques documented in several books, including those by `Jason Perl`.
It is recommended that users of the HAP WAVES indicator have a good understanding of the concepts and techniques discussed in the books that cover this indicator. Before using the tool, it is important to have a good understanding of the underlying principles and techniques in order to make the most of the indicator and potentially improve your trading performance.
════════════════════════
🎯 Rules and Principles of this Indicator
* This description only addresses bullish (uptrend) markets, while bearish (downtrend) gives let you look a vice versa.
• ▶ HAP WAVES Requirements for Wave 1
The Wave 1 HAP WAVES requirements for a bullish (rising) market require that the market has closed a minimum of 21 bars below all 20 previous closes, then closes a maximum of 13 bars above all 12 previous closes, and finally reaches an 8 bar close below all 7 previous closes, to confirm that Wave 2 has formed.
• ▶ HAP WAVES Requirements for Wave 2
The first requirement for Wave 2 is the last requirement for Wave 1, which is a close of at least 8 bars with a close less than the previous 7 bars. Wave 2 continues until the market records a 21-bar close above all 20 previous closes, indicating the start of Wave 3.
• ▶ HAP WAVES Requirements for Wave 3
Wave 3 is confirmed after Wave 2 closes at 21 bars high, and it continues until there is a 13 bar close, indicating the end of Wave 3 and the start of Wave 4.
• ▶ HAP WAVES Requirements for Wave 4
The first requirement for Wave 4 is that there is a close at 13 bars after the end of Wave 3. Wave 4 is complete when the market records a 34 bar close (above all previous 33 closes), indicating the start of Wave 5.
• ▶ HAP WAVES Requirements for Wave 5
The first requirement for Wave 5 is a 34 bar close, signaling the end of Wave 4. The wave is considered complete when a 13 bar close is published, resulting in Wave A.
• ▶ HAP WAVES Requirements for Wave A
The HAP WAVES Requirements for Wave A state that the first call for Wave A is a 13 bar close (close below all previous 12 closes), signaling the end of Wave 5. Wave A is considered complete with an 8 bar high close (close above previous 7 closes), leading to the start of Wave B.
• ▶ HAP WAVES Requirements for Wave B
The first requirement for Wave B is a 8 bar high close (close above the previous 7 closes) after Wave A. Wave B is complete when there is a 21 bar low close (close below all 20 previous closes).
• ▶ HAP WAVES Requirements for Wave C
Wave C starts with a close of 21 bars low for Wave C, meaning the market close is below all 20 previous closes. Wave C is considered closed when the market closes below the close low of Wave A.
* Additional rules to apply the HAP WAVES indicator to the bullish trend
• The peak of Wave 3 must be higher than the close of Wave 1, and the peak of Wave 5 must be higher than the peak of Wave 3.
• If the pullback from Wave 1 is shallow, and the market later retraces above the high close of Wave 1, Wave 1 will slide to the right to align with the new high close.
• If the pullback from Wave 3 is shallow, and the market later retraces above the high close of Wave 3, Wave 3 will slide to the right to align with the new high close.
• Wave 5 will only be confirmed if Wave C crosses the low close of Wave A. If Wave B closes above the high close of Wave 5, Waves A, B and C will be erased and Wave 5 will slide to the right.
• If Wave 2 closes below the low close of Wave 1, the countdown will start over, and if Wave 4 closes below the low close of Wave 2, Wave 2 will move to the location of Wave 4.
• After Wave C crosses the low close of Wave A, Wave 5 will be locked in and cannot move. If the market later retraces above the high close of Wave 5, it will be marked as a new advance in Wave 1 rather than a blur of the previous Wave 5.
════════════════════════
Skrip berbayar

Tom Joseph MACD 5-35 for Elliot WavesThis oscillator for the Elliott Theory has been invented by Tom Joseph and it's useful to correctly count the impulsive and corrective waves.
Its difference compared to a simple MACD is the peculiarity to use the ratio between the Fast SMA (default period set to 5) and the Slow SMA (default period se to 35).
The used formula is as below:
( (fast_SMA / slow_SMA) -1 ) * 100
Hope you could find it useful! 😉

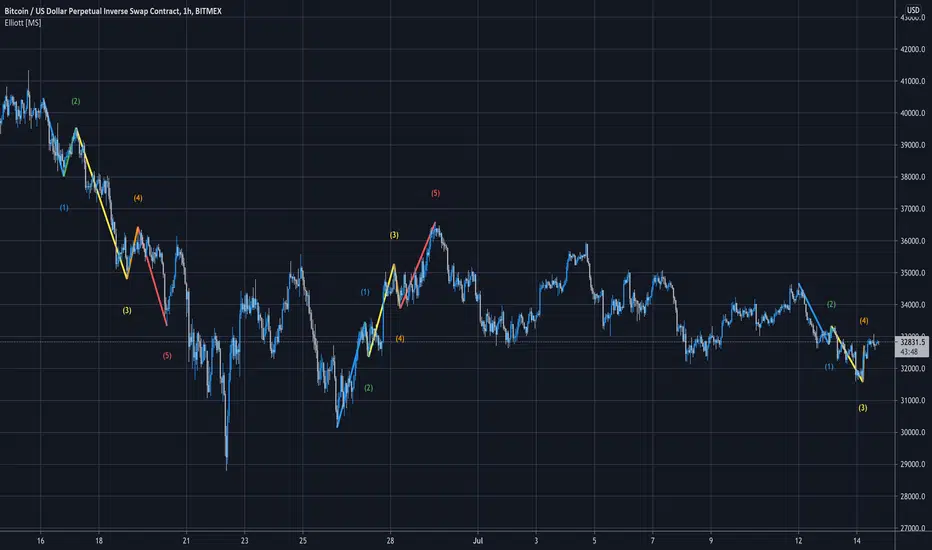
Elliott Wave [MS]Elliott Wave counter for TradingView! Automatically count Elliott waves on any asset and any timeframe. The script will count in-progress patterns as well as show past patterns that have completed (adjustable in Settings).
Simple to use, just add to your chart and choose how big of waves you're looking for with the Size setting.
Smaller numbers will auto count smaller sized Elliott Waves.
Larger numbers will auto count bigger sized Elliott Waves.
Scan for multiple size waves by adding the indicator to your chart multiple times.
Settings
Size - Set how big or small of waves you want to scan for
Hide Failed Patterns - Show or hide past waves that didn't get to 5
Color Mode - Set your own colors for each wave
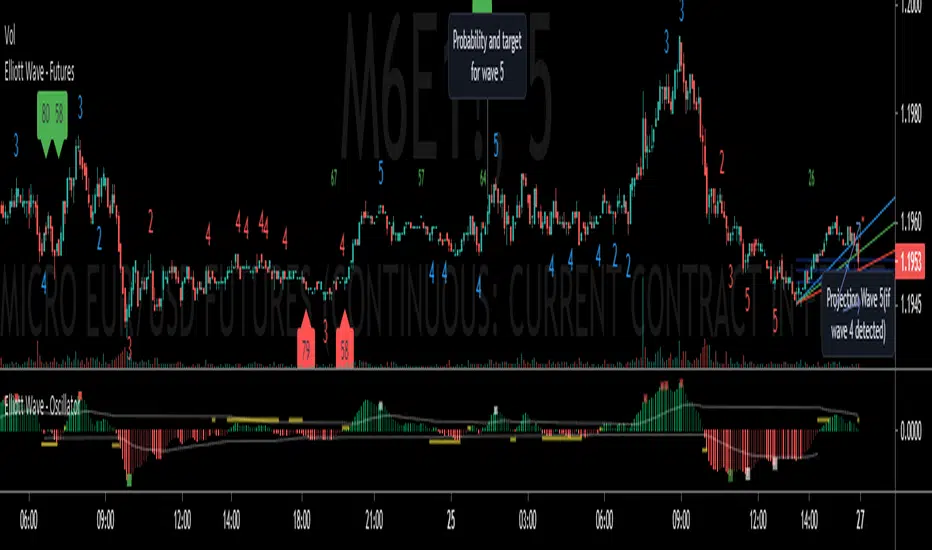
Elliott Wave - FuturesElliott Wave, indicating possible waves 2, 3, 4 and 5
Based on my Elliott Wave - Oscillator, this signals are converted into numbers displayed on chart:
Waves2, Waves3, Waves4, Waves5:
- Indicated on Chart with numbers
Fib fan Wave 4 retracement
- Blue, green and red lines for optimum retracement
Probability and target for wave 5
- Plotted when wave 4 is found
- Stays visible in chart
- Target is based on Daily Fibonnacci
- Probability: If current trend volume is bigger than previous opposite wave trend volume, probability is painted with color of trend background(for a trend to continue, value is recommended bigger than 35)
Projection Wave 4 (if wave 3 detected) and Projection Wave 5(if wave 4 detected)
- Only displayed when waves are active, else not displayed and not saved on chart
- For upside trend 2 blue target lines are displayed based on Daily Fibonnacci
- For downside trend 2 red target lines are displayed based on Daily Fibonnacci
REMINDER OF OSCILATOR USE:
Waves3: Indicated in RED Line(Upwards) and Green Line(Downwards)
- Detects wave greater than SMA
Waves4: Maximum height indicated in yellow Line
- Detects when wave greater than SMA (Wave 3 or 5) approaches wave 4 regression point
Waves5: Indicated in White Line
- Detects divergence in oscilator and price, meaning end of trend
Appreciate any suggestions, collaboration, comments or ideas.
Detects Waves 2, 3 , 4 and 5
Fib fan Wave 4 retracement
Probability and target for wave 5
Projection Wave 4 (if wave 3 detected)
Projection Wave 5(if wave 4 detected)
Alerts for Waves 2, 3, 4 and 5
Better and accurate targets for waves based on Futures
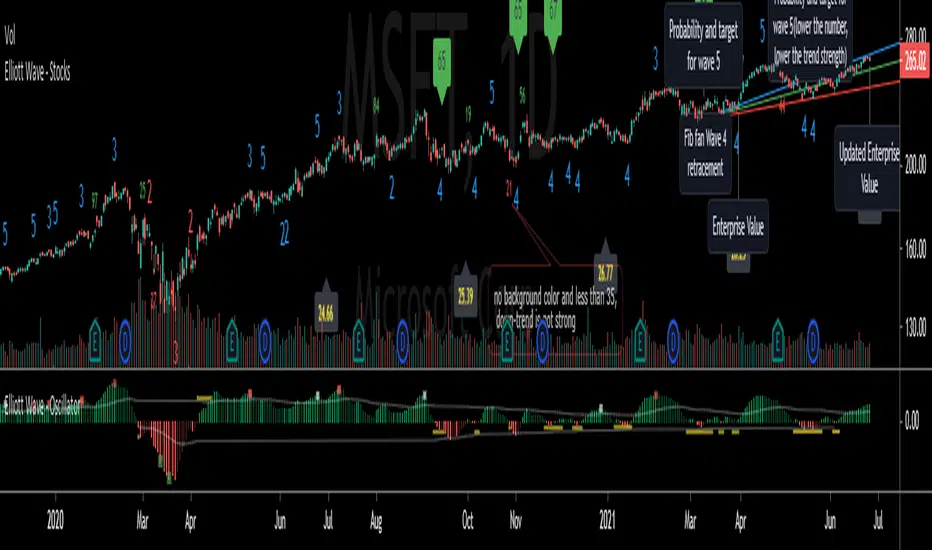
Elliott Wave - StocksElliott Wave, indicating possible waves 2, 3, 4 and 5
Based on my Elliott Wave - Oscillator, this signals are converted into numbers displayed on chart:
Waves2, Waves3, Waves4, Waves5:
- Indicated on Chart with numbers
Fib fan Wave 4 retracement
- Blue, green and red lines for optimum retracement
Probability and target for wave 5
- Plotted when wave 4 is found
- Stays visible in chart
- Target is based on Monthly Fibonnacci
- Probability: If current trend volume is bigger than previous opposite wave trend volume, probability is painted with color of trend background(for a trend to continue, value is recommended bigger than 35)
Projection Wave 4 (if wave 3 detected) and Projection Wave 5(if wave 4 detected)
- Only displayed when waves are active, else not displayed and not saved on chart
- For upside trend 2 blue target lines are displayed based on Monthly Fibonnacci
- For downside trend 2 red target lines are displayed based on Monthly Fibonnacci
Fundamentals: Enterprise Value
- Displayed when financial reports are updated to database
- Also displayed the latest calculated enterprise value with current stock price and last financial report
REMINDER OF OSCILATOR USE:
Waves3: Indicated in RED Line(Upwards) and Green Line(Downwards)
- Detects wave greater than SMA
Waves4: Maximum height indicated in yellow Line
- Detects when wave greater than SMA (Wave 3 or 5) approaches wave 4 regression point
Waves5: Indicated in White Line
- Detects divergence in oscilator and price, meaning end of trend
Appreciate any suggestions, collaboration, comments or ideas.
Detects Waves 2, 3 , 4 and 5
Fib fan Wave 4 retracement
Probability and target for wave 5
Projection Wave 4 (if wave 3 detected)
Projection Wave 5(if wave 4 detected)
Alerts for Waves 2, 3, 4 and 5
Fundamentals: Enterprise Value
Better and accurate targets for waves based on Stocks
Elliott Wave - OscillatorWaves3: Indicated in RED Line(Upwards) and Green Line(Downwards)
- Detects wave greater than SMA
Waves4: Maximum height indicated in yellow Line
- Detects when wave greater than SMA (Wave 3 or 5) approaches wave 4 regression point
Waves5: Indicated in White Line
- Detects divergence in oscilator and price, meaning end of trend
Appreciate any suggestions, collaboration, comments or ideas.
Detects Waves 3 , 4 and 5
Alerts for Waves 3, 4 and 5(red, green and white)

ElliotElliott Wave Oscilator, indicating possible waves 3, 4 and 5
Waves3: Indicated in RED Line(Upwards) and Green Line(Downwards)
- Detects wave greater than SMA
Waves4: Maximum height indicated in yellow Line
- Detects when wave greater than SMA (Wave 3 or 5) approaches wave 4 regression point
Waves5: Indicated in White Line
- Detects divergence in oscilator and price, meaning end of trend
////Working on Elliott wave projections with PRICE
Appreciate any suggestions, collaboration, comments or ideas.

EWO[Giskard]Elliott Wave Oscillator with breakout bands
The Elliott Wave Oscillator (EWO) is defined as
EWO = SMA(fast-period, source) – SMA(slow-period, source)
where source is hl2, fast-period is 5 and slow-period is 35.
if price is in an uptrend, and this uptrend has been stronger over the previous five candles relative to the previous 35, then the EWO will be positive. If price is in an uptrend, but price has been in a stronger overall uptrend over the past 35 candles relative to the previous five, the EWO will be negative. Likewise, we can apply this to downtrends.
The Oscillator Break Out Bands provide an Up Band and a Low Band. In a Wave Three, the EWO needs to be above the Break Out
Band. The default strength of the band is 100%, but 80% could be also a good configuration.
Hint: Use together with the XTL indicator

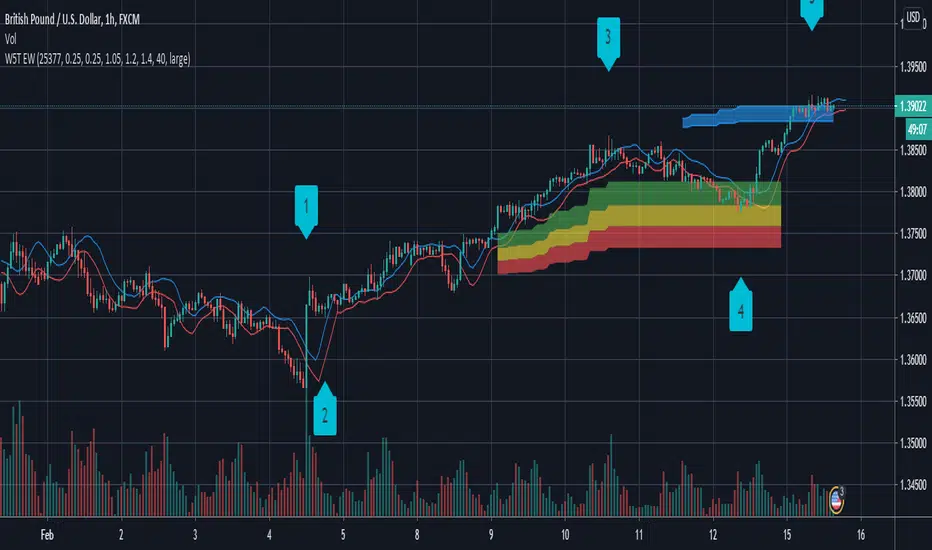
W5T Bar number for Elliott Wave IsolationSpecial Bar counting tool to allow Isolation of Elliott Wave wave count. Watch the Video Tour >>HERE<<< of this full and comprehensive Elliott Wave Indicator Suite.

W5T Elliott Wave Indicator SuiteThe Elliott Wave Indicator Suite brings order and reason to the world of Swing Trading, Intraday Trading and Day Trading. It greatly illuminates the path through the forest of chaotic markets versus getting lost among all the trees. Perfect for Stocks, Forex, Futures, Commodities, Indexes and even Crypto Currency markets. Watch the Video Tour and find out More >>>HERE<<<
Includes:
Elliott Wave Indicator
High Probability Pull Back Zones
Elliott Wave isolation
Automated Target Zones
False Breakout Stochastic
Automated Elliott Wave Count
Special 5/35 Pull Back Oscillator
6/4 MA High & Low for Trade Entry & Management
Training Bootcamp
Free Monthly Live Support Webinars
Any Problems with ELLIOTT WAVES? Here my secret to count the EW!Hi at all!
Have someone any problems to count the Elliott Waves correctly? Then use my modified indicator.
The indicator shows a fast and a slow RSI oscillator.
I use this indicator to find the 3. wave on any big wave -> so I can find always trend wave und can indicate with that than the correction wave.
I set an example on the chart, so you can look at the peaks the RSI oscillator shows. The highest peak show the 3. wave of Elliott Waves. If you know the 3. wave you can immediately see the wave 1, 2 and of course 4 and 5.
For better instruction this indicator get green and red, if the fast RSI is higher or lower than the slow RSI. This color changing helps also to see every spectrum of a wave.
