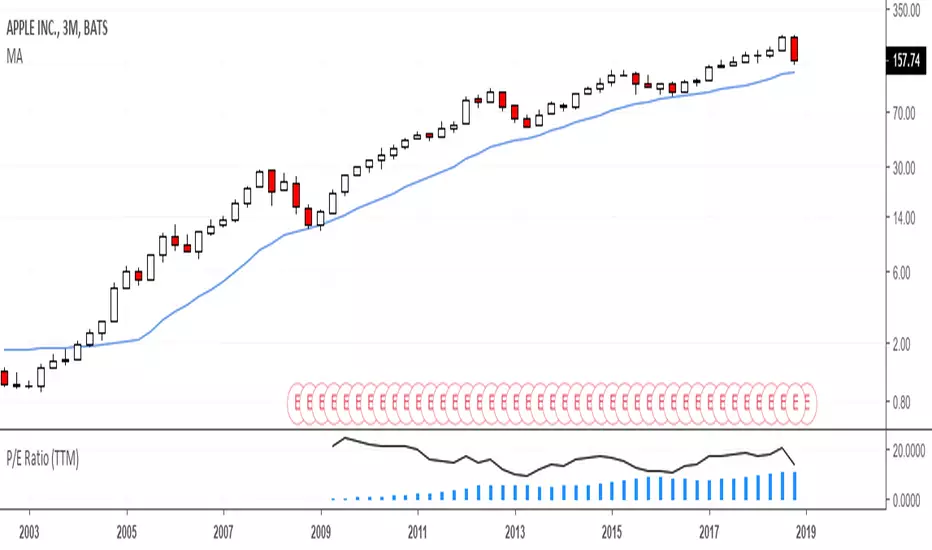
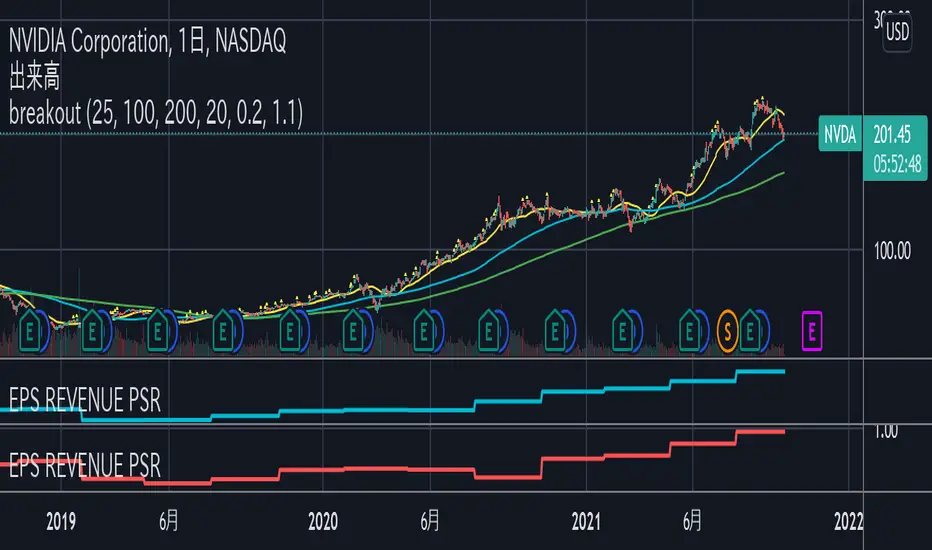
EPS and PER indicatorThis indicator shows quarterly EPS and PER.
Uncheck EPS or PER for the chart visibility.
"standard" and "diluted" mode can be selected for EPS setting.
このインジケーターは四半期のEPSとPERを表示します。
チャートを見やすくするためにはEPSまたはPERのチェックをオフにしてください。
EPSの設定として「通常」と「希薄化後」のモードを選択することができます。
EPS
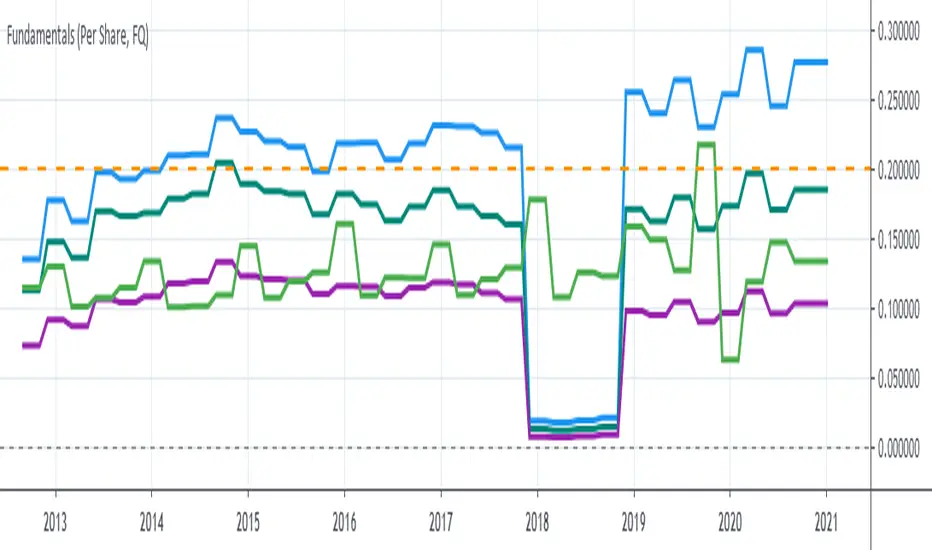
P1 FundamentalsP1 is because to me, this is a priority 1 indicator, so I have P1 and P2 indicators ordered on the favorite list.
What can you check on the selection pane?
On “period”, you can show the data related to:
the fiscal quarters
or the fiscal years.
You can select a pack of financial data that I have organized in sections:
Revenue & earnings
EPS & DPS (EPS, EPS estimate, DPS and dividend payout ratio )
Debt (total debt, total equity and cash & equivalents)
Returns (ROE, ROIC, ROA and R&D revenue to ratio)
I recommend to just select one of them, in other case the chart is a mess.
Any feedback on the code is welcome!!
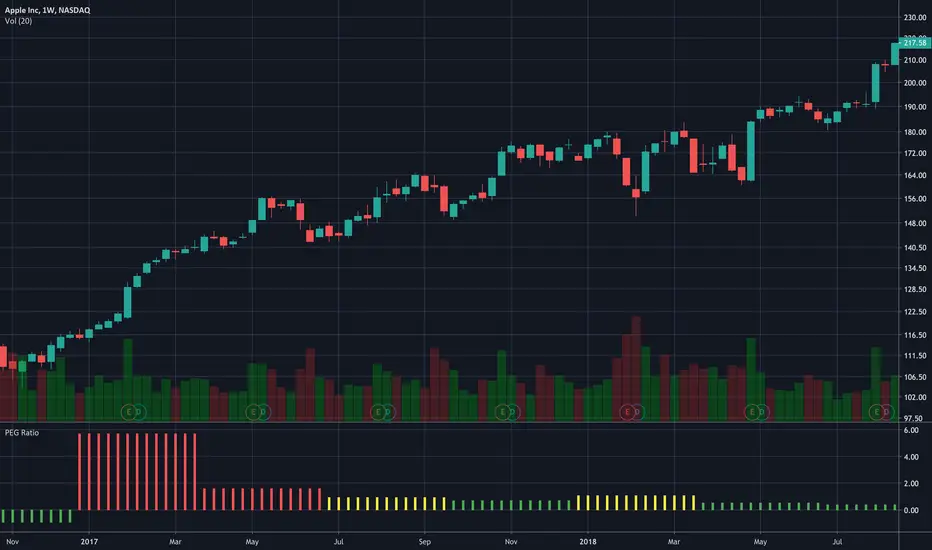
PEG RatioHello everyone,
Quick script to check the PEG Ratio.
What is PEG Ratio?
The price/earnings to growth ratio (PEG Ratio) is a stock's price-to-earnings (P/E) ratio divided by the growth rate of its earnings for a specified time period. The PEG ratio is used to determine a stock's value while also factoring in the company's expected earnings growth, and is thought to provide a more complete picture than the more standard P/E ratio.
A PEG Ratio greater than 1.0 means that the stock is overvalued, while below 1.0 means is is undervalued. When the PEG Ratio is exactly 1.0, then the stock is trading at fair valuation.
Formula:
PEG Ratio = (Price / EPS) / EPS Growth
Examples:
Company A:
Price per share = $46
EPS this year = $2.09
EPS last year = $1.74
Company B
Price per share = $80
EPS this year = $2.67
EPS last year = $1.78
Company A
P/E ratio = $46 / $2.09 = 22
Earnings growth rate = ($2.09 / $1.74) - 1 = 20%
PEG ratio = 22 / 20 = 1.1
Company B
P/E ratio = $80 / $2.67 = 30
Earnings growth rate = ($2.67 / $1.78) - 1 = 50%
PEG ratio = 30 / 50 = 0.6
The company A is overvalued whiled the B is undervalued.
In this script an overvalued stock is considered when the PEG Ratio is above 1.1, while it is 0.9 for an undervalued stock.
Only works with Stocks.
Happy trading,