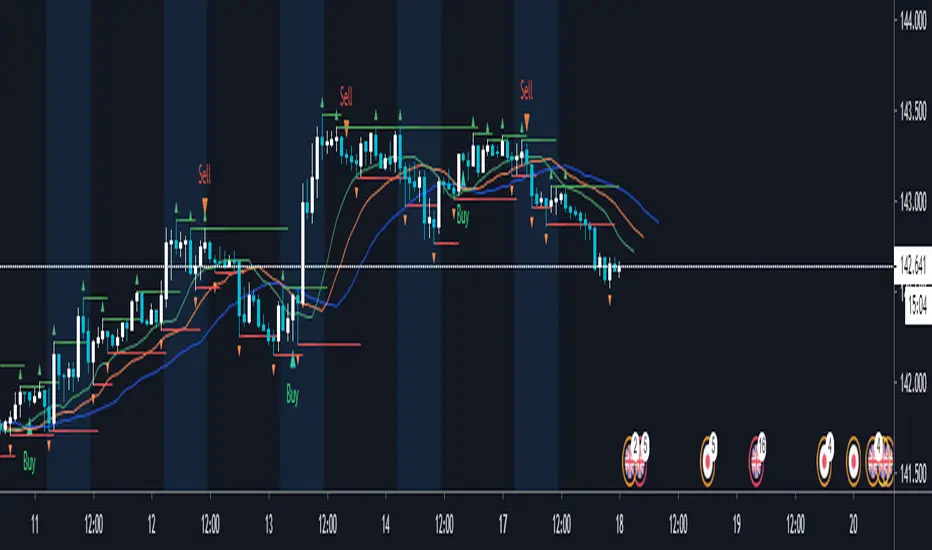
Setup Max e Min Larry WilliansLarry Williams used this system to win the trading championship
Hello friends, I bring a script with a trading strategy to be used in futures such as Index, Forex and Commodities. Developed by famous trader Larry Williams.
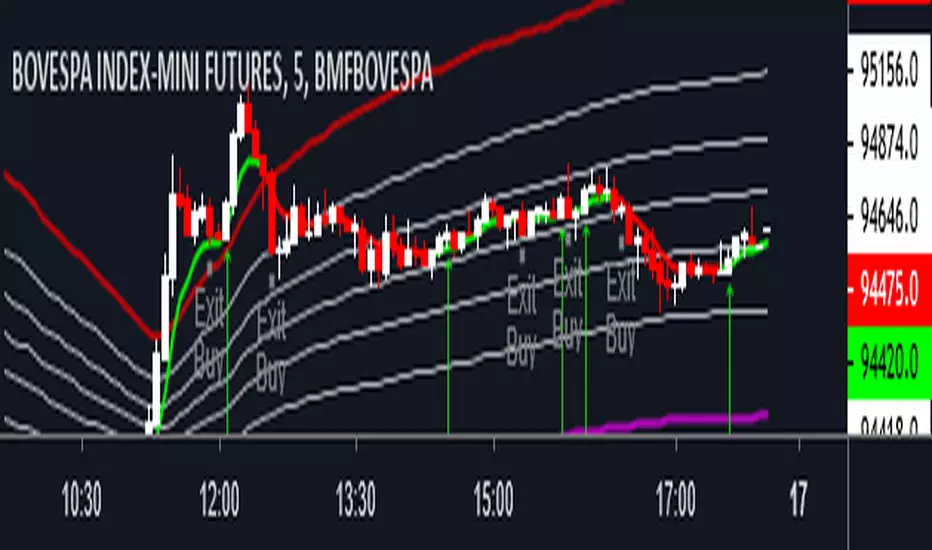
In them we use two 3-period Simple Moving Averages (Arithmetic) (one with the high price, the other with the low price), and a 21-period Moving Average (Arithmetic) to determine the trend. This will form an average channel with the prices of the maximums and minimums of the last three candles.
Best time charts use the strategy: from 5 minutes to 60 minutes.
This strategy is quite simple. The 21 Moving Average will color according to the trend (Green for bullish, Red for bearish and Gray for transitions). The Script will signal the entry according to the trend by the colors of the candles and also by the signal:
When green, the buy will be on the crossing of the lower Moving Average crossing the candlestick, and the exit will be on the crossing of the candlestick on the next Upper Moving Average.
When red, the sell will be at the crossing of the Upper Moving Average crossing the candlestick, and the exit will be at the crossing of the candlestick on the next Lower Moving Average.
When the Script signals the candle with a purple X, it means that the trend is changing and the entire open operation must be closed.
This system has no Stop, so be careful when using it.
Na linguagem do autor:
Larry Williams usou esse sistema ganhar campeonato de trade
Olá amigos, trago um script com uma estratégia de trade pra ser usada em futuros como Índice, Forex e Commodities. Desenvolvido pelo famoso trader Larry Willians.
Neles usamos duas Médias Móveis Simples (Aritmética) de 3 períodos (uma com o preço da máxima, outra com o preço da mínima), e uma Média Móvel (Aritmética) de 21 períodos para determinar a tendência. Nisso vai formar uma canal de médias com os preços das máximas e mínimas dos últimos três candles.
Melhores tempos gráficos usar a estratégia: de 5 minutos até 60 minutos.
Essa estratégia é bem simples. A Média Móvel de 21 irá colorir de acordo com a tendência (Green pra alta, Red para baixa e Gray para transições). O Script irá sinalizar a entrada de acordo com a tendência pela cores dos candles e também pela sinalização:
Quando green, a compra será no cruzamento da Média Móvel inferior cruzando o candle, e a saida será no cruzamento do candle na Média Móvel Superior seguinte.
Quando red, a venda será no cruzamento da Média Móvel Superior cruzando o candle, e a saida será no cruzamento do candle na Média Móvel Inferior seguinte.
Quando o Script sinaliza o candle com X purple, significa que a tendência está em mudança e deve ser fechada toda a operação em aberto.
Este sistema não possui Stop, portando cuidado quanto a seu uso.
Estrategia

Delox EMA CrossThis indicator works with the change of trend of emas
When the fast 14 crosses above the 21 this is an uptrend.
and when the slow ema of 21 crosses below the slow ema of 14 then we have a downtrend.
It is accompanied by the Stochastic indicator that when there is a cross of Emas will give a bullish or bearish signal.
Bearish signal
When the D-stochastic or the Orange line of the stochastic is greater than 60 and there is a trend reversal crossover it will give a bearish signal painted on the background of the chart.
Bullish signal
When the stochastic D which is the orange line of the stochastic is less than 30 and has a line crossing on the lines it will give a bullish signal.
White bar
White bar appears when there is a change in trend between ema 14 and ema 21.
Remember this is not an investment recommendation this script is for educational purposes only.
If you like the script please follow me this helps a lot and you can also follow me this would help me a lot to keep uploading videos and new scripts for the community.

MACD-Extendido-Estrategia por Neil--------------------------------
MACD-Extendida-Estrategia
--------------------------------
DESCRIPTION
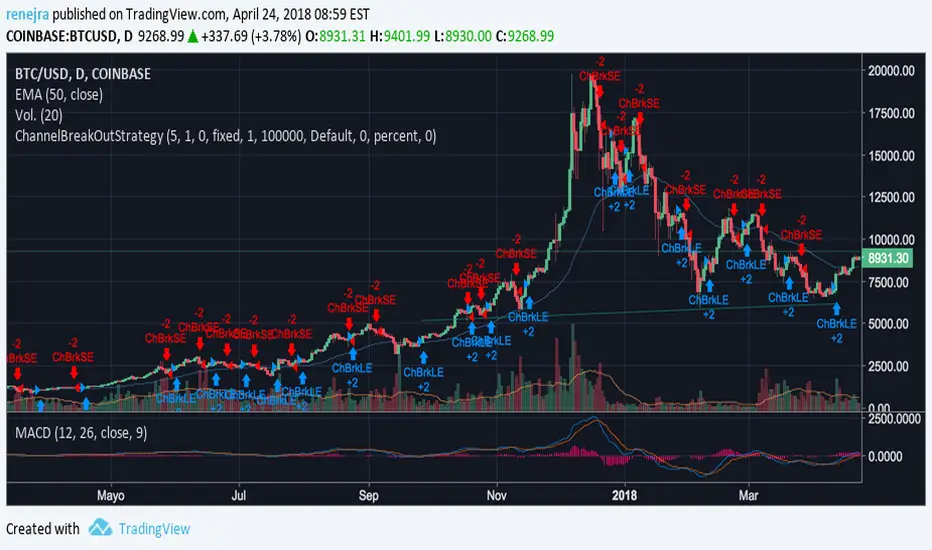
Resource that identifies entry and exit operations using the indicator
Average Convergence and Divergence Movements ( MACD ) and 5 strategies
INTERESTING
Novel strategies are implemented such as:
1. Overbought and oversold band to avoid horizontal movements
2. Control inputs and outputs at positions opposite the histogram line
3. Make a profit (take profit) without prior purchase orders
HOW DOES IT WORK (STRATEGIES)
1) Overbought and oversold:
Allows you to define an overbought upper band
Allows you to define an oversold ower band
Operations that occur within the band are ignored
2) Place of next operation (either side):
Indicates that the next operation can occur on either side of the histogram
3) Place of next operation (opposite side):
Indicates that the next operation must occur on the opposite side of the histogram
4) Take profit:
It allows defining the deviation in favor to execute a take profit.
It does not place a buy order at a distant point, instead it looks back and if the shift meets the expected deviation, take profit is executed
5) Loss control (stop loss):
It allows to define the deviation against to execute a stop loss.
It does not place a stop order at a distant point, instead it looks back and if the displacement meets the expected deviation the stop loss is executed
How to use it:
Press the "Indicators" option, go to the "Public Librarian" segment, write the name "MACD-Extended-Strategy by Neil", double-click on the record in question and you will have it added in your work panel, now, just It remains to be used to identify the inputs and outputs and you can do it visually or by defining the automatic notification alerts.
--------------------------------
MACD-Extendida-Estrategia
--------------------------------
DESCRIPCION
Recurso que identifica operaciones de entradas y salida haciendo uso del indicador
Media móvil de Convergencia/Divergencia ( MACD ) y 5 estrategias
NOVEDADES
Se implementan estrategias novedosas como:
1. Banda de sobrecompra y sobreventa para esquivar movimientos horizontales
2. Control de entradas y salidas en posiciones contrarias a la línea del histograma
3. Toma de ganancias (take profit) sin ordenes de compra previa
COMO FUNCIONA (ESTRATEGIAS)
1) Sobrecompra y Sobreventa:
Permite definir una banda superior de sobrecompra
Permite definir una banda inferior de sobreventa
Operaciones que ocurren dentro de la banda son ignoradas
2) Lugar de próxima operación (cualquier lado):
Indica que la próxima operación puede ocurrir en cualquier lado del histograma
3) Lugar de próxima operación (lado opuesto):
Indica que la próxima operación debe ocurrir en el lado opuesto del histograma
4) Toma de ganancias (take profit):
Permite definir la desviación a favor para ejecutar una toma de ganancia.
No coloca una orden de compra en un punto distante, en su lugar mira hacia atrás y si el desplazamiento cumple con la desviación esperada se ejecuta la toma de ganancia
5) Control de pérdida (stop loss):
Permite definir la desviación en contra para ejecutar una parada de pérdida.
No coloca una orden de parada en un punto distante, en su lugar mira hacia atrás y si el desplazamiento cumple con la desviación esperada se ejecuta la parada de la pérdida
Como usarlo:
Presione la opción "Indicadores", ubíquese en el segmento "Libreria Publica", escriba el nombre "MACD-Extendido-Estrategia por Neil", haga doble clic sobre el registro en cuestión y lo tendrá agregado en su panel de trabajo, ahora, solo resta usarlo para identificar las entradas y salidas y puede hacerlo de forma visual o definiendo las alertas de notificación automática.

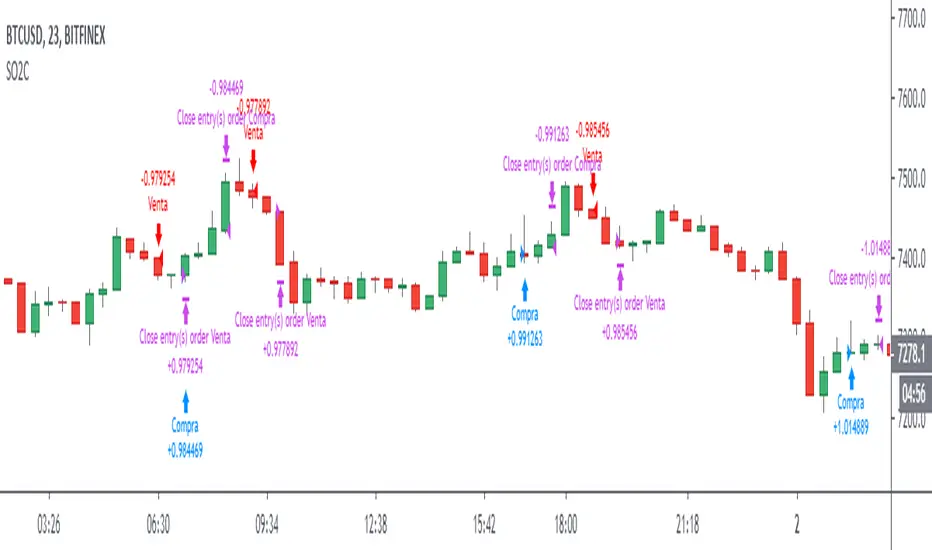
Estrategia de Monitor - RSI/EMAThis indicator, competes the signals of two of the most important and reliable indicators for monitoring price trends, the Squeeze Monitor and the RSI.
For a better visualization of the relationship of the indicators with the price, the Squeeze Monitor is presented in colored bars that represent the trend of the indicator. The RSI is combined with the EMA of the RSI that supports its directionality.
As additional support for decision making, the ADX is also plotted, as an element to project the force of the next movement.
The indicator settings are presented in the configuration of the indicator. The following parameters can be adjusted there:
** Monitor Parameters **
Monitor Length Squeeze -> "Long. Monitor"
** ADX parameters **
ADX Longitug -> "Long. ADX"
ADX Smoother -> "Suavizador ADX"
ADX Variation Factor -> "Factor Var. ADX"
This parameter defines the minimum variation for the
ADX address highlighting
** RSI parameters **
RSI Length -> "Long. RSI"
RSI Smoothing -> "Suavizador RSI"
RSI EMA Length -> "Long. EMA del RSI"
Finally, the Script consolidates the information, based on the trends of the indicators, and changes the color of the candle body. The color code considers Green for the uptrend, Red for the Downtrend and Yellow in transition processes (not operable).

Strategy Follow Line Indicator The objective is only to evaluate different configurations, I do not recommend using only this indicator to trade, because you can lose all your money if you do not know what you are doing.
I hope you find it useful.
Successes

Remora4 indicadores en 1
Esto se logró combinando algunas de las ideas de otros tres indicadores:
- Williams Alligator
- Fractales y niveles
- Oscilador Asombroso
- Bitrader4.0
Como operar:
El Alligator nos muestra la tendencia, operar a favor de la tendencia.
Ubicar los fractales y determinar los breakouts con ellos.
El indicador Bitrader4.0 nos muestra la compra y venta de acuerdo a la configuración de los parámetros setup
Funcional en todos los timeframe.
////////////////////////////////
4 indicators in 1
This was achieved by combining some of the ideas from three other indicators:
- True Williams Alligator
- Fractals and Levels
- Awesome Oscillator
- Bitrader4.0
How to operate:
The trend will show us the alligator, operate in favor of the trend.
Locate the fractals and determine the breakouts with them.
The Bitrader4.0 indicator will show us buying and selling according to the setup parameters.
Functional in all timeframe.
Strategy Quadratic Semaphore I add a basic strategy for the "Quadratic traffic light" indicator, it can help to find a good configuration.
Regards.
Strategy Death To The Bear Simple strategy for the indicator "Death To The Bear".
Simple rules:
- Entry according to the selected weapons.
- Take profit 1 (TP1) in% of daily ATR (can be set, default 20%)
- Active Stop in Breakeven when I take profit in TP1.
- Take profit 2 (TP1) in% of daily ATR (can be set, default 30%)
* Pyramidization can be changed from the configuration (maximum number of tickets to average your price)
* Many do not like to pyramid, but I can assure you that with good management, and good choice of the instrument and time frame, you will get good money.
Note: at the request of some people who cannot see the EMOJI in the configuration you can choose TEXT.
Thumbs up

High Gain Volume Strategy Only 2 Candles The result after having a good wine...
Data with reliable volume required.
to enjoy!
IchiMA ChannelEstrategia basada en un principio de ichimoku, Green Long , Red Short.
Make it simple.

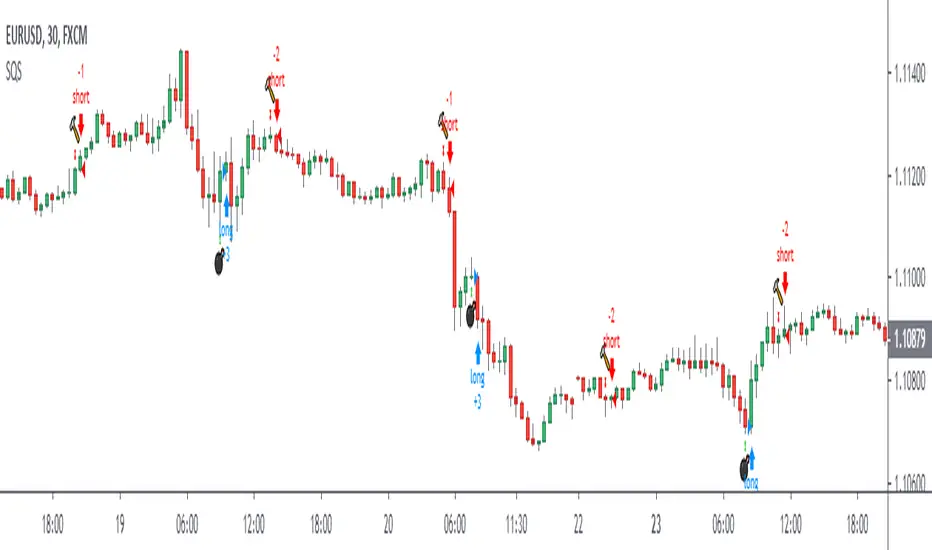
Vom SystemOnly show Long/Short entries.
Based on moving averages cross, volume, volatility,and trending indicators.
Its my gift to you, ENJOY.

Terminator IEstrategia que vengo desarrollando hace tiempo para el desarrollo de mi futuro bot.
Funciona mucho mejor con velas heikin ashi.