Volume Profile Grid [Alpha Extract]A sophisticated volume distribution analysis system that transforms market activity into institutional-grade visual profiles, revealing hidden support/resistance zones and market participant behavior. Utilizing advanced price level segmentation, bullish/bearish volume separation, and dynamic range analysis, the Volume Profile Grid delivers comprehensive market structure insights with Point of Control (POC) identification, Value Area boundaries, and volume delta analysis. The system features intelligent visualization modes, real-time sentiment analysis, and flexible range selection to provide traders with clear, actionable volume-based market context.
🔶 Dynamic Range Analysis Engine
Implements dual-mode range selection with visible chart analysis and fixed period lookback, automatically adjusting to current market view or analyzing specified historical periods. The system intelligently calculates optimal bar counts while maintaining performance through configurable maximum limits, ensuring responsive profile generation across all timeframes with institutional-grade precision.
// Dynamic period calculation with intelligent caching
get_analysis_period() =>
if i_use_visible_range
chart_start_time = chart.left_visible_bar_time
current_time = last_bar_time
time_span = current_time - chart_start_time
tf_seconds = timeframe.in_seconds()
estimated_bars = time_span / (tf_seconds * 1000)
range_bars = math.floor(estimated_bars)
final_bars = math.min(range_bars, i_max_visible_bars)
math.max(final_bars, 50) // Minimum threshold
else
math.max(i_periods, 50)
🔶 Advanced Bull/Bear Volume Separation
Employs sophisticated candle classification algorithms to separate bullish and bearish volume at each price level, with weighted distribution based on bar intersection ratios. The system analyzes open/close relationships to determine volume direction, applying proportional allocation for doji patterns and ensuring accurate representation of buying versus selling pressure across the entire price spectrum.
🔶 Multi-Mode Volume Visualization
Features three distinct display modes for bull/bear volume representation: Split mode creates mirrored profiles from a central axis, Side by Side mode displays sequential bull/bear segments, and Stacked mode separates volumes vertically. Each mode offers unique insights into market participant behavior with customizable width, thickness, and color parameters for optimal visual clarity.
// Bull/Bear volume calculation with weighted distribution
for bar_offset = 0 to actual_periods - 1
bar_high = high
bar_low = low
bar_volume = volume
// Calculate intersection weight
weight = math.min(bar_high, next_level) - math.max(bar_low, current_level)
weight := weight / (bar_high - bar_low)
weighted_volume = bar_volume * weight
// Classify volume direction
if bar_close > bar_open
level_bull_volume += weighted_volume
else if bar_close < bar_open
level_bear_volume += weighted_volume
else // Doji handling
level_bull_volume += weighted_volume * 0.5
level_bear_volume += weighted_volume * 0.5
🔶 Point of Control & Value Area Detection
Implements institutional-standard POC identification by locating the price level with maximum volume accumulation, providing critical support/resistance zones. The Value Area calculation uses sophisticated sorting algorithms to identify the price range containing 70% of trading volume, revealing the market's accepted value zone where institutional participants concentrate their activity.
🔶 Volume Delta Analysis System
Incorporates real-time volume delta calculation with configurable dominance thresholds to identify significant bull/bear imbalances. The system visually highlights price levels where buying or selling pressure exceeds threshold percentages, providing immediate insight into directional volume flow and potential reversal zones through color-coded delta indicators.
// Value Area calculation using 70% volume accumulation
total_volume_sum = array.sum(total_volumes)
target_volume = total_volume_sum * 0.70
// Sort volumes to find highest activity zones
for i = 0 to array.size(sorted_volumes) - 2
for j = i + 1 to array.size(sorted_volumes) - 1
if array.get(sorted_volumes, j) > array.get(sorted_volumes, i)
// Swap and track indices for value area boundaries
// Accumulate until 70% threshold reached
for i = 0 to array.size(sorted_indices) - 1
accumulated_volume += vol
array.push(va_levels, array.get(volume_levels, idx))
if accumulated_volume >= target_volume
break
❓How It Works
🔶 Weighted Volume Distribution
Implements proportional volume allocation based on the percentage of each bar that intersects with price levels. When a bar spans multiple levels, volume is distributed proportionally based on the intersection ratio, ensuring precise representation of trading activity across the entire price spectrum without double-counting or volume loss.
🔶 Real-Time Profile Generation
Profiles regenerate on each bar close when in visible range mode, automatically adapting to chart zoom and scroll actions. The system maintains optimal performance through intelligent caching mechanisms and selective line updates, ensuring smooth operation even with maximum resolution settings and extended analysis periods.
🔶 Market Sentiment Analysis
Features comprehensive volume analysis table displaying total volume metrics, bullish/bearish percentages, and overall market sentiment classification. The system calculates volume dominance ratios in real-time, providing immediate insight into whether buyers or sellers control the current price structure with percentage-based sentiment thresholds.
🔶 Visual Profile Mapping
Provides multi-layered visual feedback through colored volume bars, POC line highlighting, Value Area boundaries, and optional delta indicators. The system supports profile mirroring for alternative perspectives, line extension for future reference, and customizable label positioning with detailed price information at critical levels.
Why Choose Volume Profile Grid
The Volume Profile Grid represents the evolution of volume analysis tools, combining traditional volume profile concepts with modern visualization techniques and intelligent analysis algorithms. By integrating dynamic range selection, sophisticated bull/bear separation, and multi-mode visualization with POC/Value Area detection, it provides traders with institutional-quality market structure analysis that adapts to any trading style. The comprehensive delta analysis and sentiment monitoring system eliminates guesswork while the flexible visualization options ensure optimal clarity across all market conditions, making it an essential tool for traders seeking to understand true market dynamics through volume-based price discovery.
ETH-BTC

ICHIMOKU Crypto Swing AlertThis is a crypto swing alert for the strategy with the same name designed for timeframes bigger than 1h.
The main components are
ICHOMOKU
KDJ
Average High
Average Low
Rules for entry
For long: we have the ichimoku crosses between tenkan and baselines, we have a rising kdj line and at the same time we have a increase in the average high
For short: we have the ichimoku crosses between tenkan and baselines, we have a falling kdj line and at the same time we have an increase in the average low
Rules for exit
We exit when we have inverse conditions than the initial ones used for entry.
Caution
This strategy does not use a risk management, so be careful with it !
If you have any questions let me know !

Crypto swing correlation RSI and SMAThis is a crypto swing strategy, designed for long term periods and correlated pairs with crypto market total(or other coins used as correlation, however I recommend total of crypto or btc)
Its components are:
RSI with a very length
Correlation candles
SMA 9
Rules for entry:
For long : RSI is above 51 level and going higher and close of the candle is above the SMA
For short :RSI is below 49 and going lower and close of the candle is below the SMA
Rules for exit:
We exit when we encountered an opposite condition than the entry one, or based on take profit/stop loss levels.
If you have any questions let me know !

Full Crypto Swing Strategy ALMA Cross with MACDThis is a full crypto swing strategy designed.
From my testing it looks like it perform the best on timeframes 4h +.
The below example has been adapted to BNB/USDT, using the entire period since 2017 until present day, with a comission of 0.03% ( which is the comission for the futures on binance).
Its components are :
ALMA Fast
ALMA Slow
MACD Histogram
Rules for entry
For long, we have a crossover of the fast alma with the slow one and the histogram is ascending.
For short, we have a crossunder of the fast alma with the slow one and the histogram is descending.
Rules for exit
We exit based on a risk management system for TP and SL, or when we receive an opposite condition than the initial one.
Regarding risk management
0.05 = 5% movement
2 = 200% movement
0.001 = 0.1% movement
If you have any questions, let me know !

Aggresive Scalper/Swing Crypto StrategyThis is a simple yet very efficient scalper long strategy adapted for low timeframes for crypto. Can also be used with bigger timeframes as a swinger.
Its main components are:
Price oscillator swing
Vortex
Risk management for TP/SL
Rules for entry
We calculate the difference between the oscillator from the lowest low and the highest high. If the difference is positive, its a long potential. If its negative we exit from the long trade.
At the same time we check that the we have a crossover between the VIP vortex with the VIM vortex part.
Lastly we check that the current candle is bigger the second previous high.
Rules for exit
If we reach the take profit or the stop loss.
If we have a negative difference betwee LL and HH and VIP vortex crossunder with VIM vortex .
In this example I aimed for a 1:10 risk reward ratio, meaing that for every dollar lost, we will gain 10 when we win. Thus having a 10% minimum win rate will give us a profit over many trades.
If you have any questions, let me know !

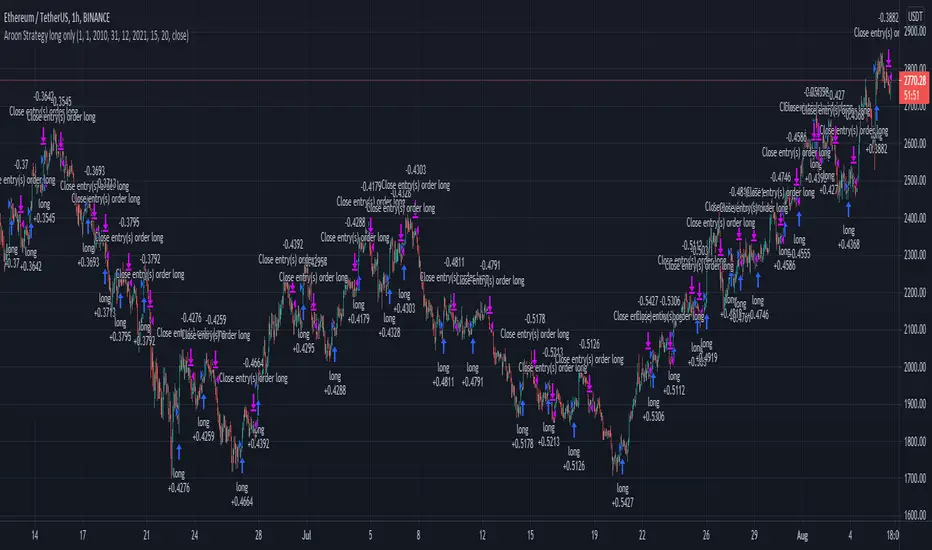
Aroon Strategy long onlyThis is a simple long only strategy made of Aroon and Least Square moving average.
The rules are simple:
Long entry = crossover of upper part with the lower part from aroon and close of the candle is above the moving average
Long exit = crossunder of upper part with the lower part from aroon and close of the candle is below the moving average
IF you have any questions let me know !
3x EMA fast, 3 x MA slow + BB + PsarThis is a trend system which combines multiple fast EMA + mulitple slower SMA together with bollinger band channel and PSAR.
For entry rules the ones that I use are:
Long
We are inside BB channel, psar is ascending, and our close is above all moving averages or below all EMA'S + 1 SMA
WE can exit either when our close is below all EMA's or when PSAR is descending or when we hit upper/lower BB levels
Short
We are inside BB channel, psar is descnending, and our close is below all moving averages or below all EMA's + 1 SMA
WE can exit either when our close is above all EMA's or when PSAR is ascending or when we hit upper/lower BB levels
If you have any questions, let me know

Crypto RSI with RVI StrategyThis is a long only strategy adapted for crypto market.
Its idea is to take the most juice out of a long trend and cut the losses as soon as possible.
For this , its components are RSI with a very big length - 100 or 200 preferably and RVI.
Rules for entry
If RVI is in the buy zone and we have a crossover from RSI with the overbought level.
Rules for exit
With change condition : If RVI is in the sell zone and we have a cross under from RSI with the oversold level.
With stop loss : we have a SL based on movement in % of the price, recommendable between 5-10%.
If you have any questions let me know !

MACD oscillator with EMA alert version 4HThis is the study/indicator alert version of the macd + ema strategy.
The strategy details are the following :
Is a simple, yet efficient strategy, which is made from a combination of an oscillator and a moving average.
Its setup for 4h candles with the current settings, however it can be adapted to other different timeframes.
It works nicely ,beating the buy and hold for both BTC and ETH over the last 3 years.
As well with some optimizations and modifications it can be adapted to futures market, indexes(NASDAQ, NIFTY etc), forex( GBPUSD ), stocks and so on.
Components:
MACD
EMA
Time condition
Long/short option
For long/exit short we enter when we are above the ema , histogram is positive and current candle is higher than previous.
For short /exit long , when close below ema , histo negative and current candles smaller than previous
If you have any questions please let me know !

Heikin-Ashi Change Strategy/ Indicator
Today I bring you a simple and efficient indicator/strategy based only on HA.
Can be used together with other TA tools or alone.
The idea behind is simple :
We have to forms to calculate the candle, using inner HA candles or normal candles. Once we have that we apply certain rules to get the max high, min low, open and close(ohlc)
With that then we check for changing in the patters like for example
For long close is higher than open and the previos close is lower than open. For short is going to be the opposite of long condition.
For the purpose of this example, I only use long direction and exit once we have the short signal.
If you have any questions, please let me know in private chat !

BTC & ETH Alert SystemWith Tradingview's free plan, only one alert is allowed. The purpose of this indicator is to allow for two alerts--one for BTC and one for ETH.
How to use the alert system:
1. Set the desired value for BTC and ETH that you want to be alerted for
2. Set an alert on the indicator by clicking the three ellipses and then "Add Alert"
3. Set the alert to go off if the value of the indicator is greater than 0.
The example is of BTC using an alert of $10,000 and an alert of ETH at $2,000 (untriggered)
The script can be easily modified to be used for different assets

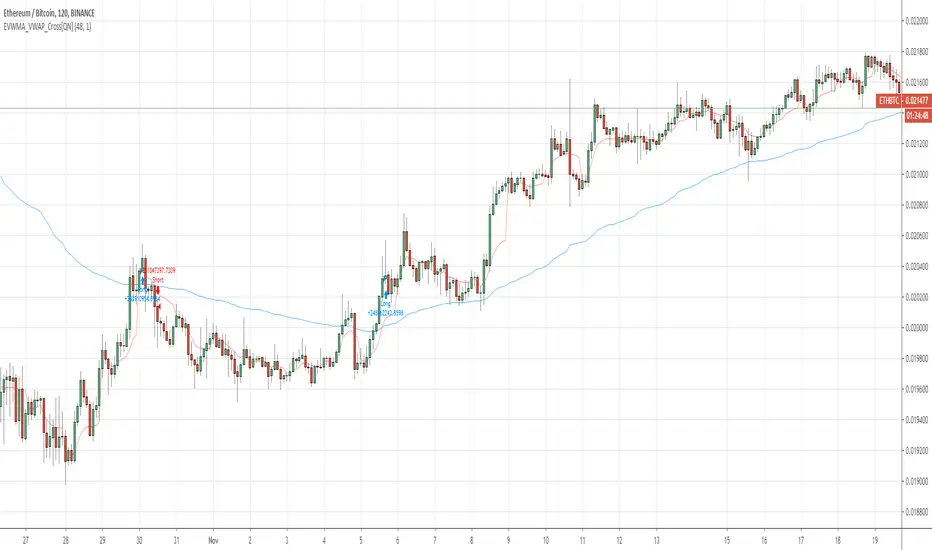
EVWMA VWAP Cross Strategy [QuantNomad]Continue to experiement with VWAP and EVWMA.
It seems that just simple crosses between VWAP and EVWMA can be pretty good signals. VWAP is a bit choppy so you can use VWAP smoothing input to smoth it a bit.
Here are few other strategies based on EVWMA:
EVWMA VWAP MACD Strategy
QuantNomad - EVWMA MACD Strategy
U&Dif price has moved up since 1 to 3 candles ago = buy
if price has moved down since 1 to 3 candles ago = sell
has internal SL & TP
tested on
BITFINEX:ETHUSD
BITFINEX:BTCUSD
BITFINEX:LTCUSD
BITFINEX:ETHBTC
4 hour charts

Gap finder (gold minds)This tool highlights where gaps happens and outlines in the chart where the gap zones are. If there is a gap up there is a green line, a gap down it is red. The gap zone is highlighted in blue. You can choose the size of your gap with the input menu to the desired size. Feel free to ask comment below. Made for the Gold Minds group
