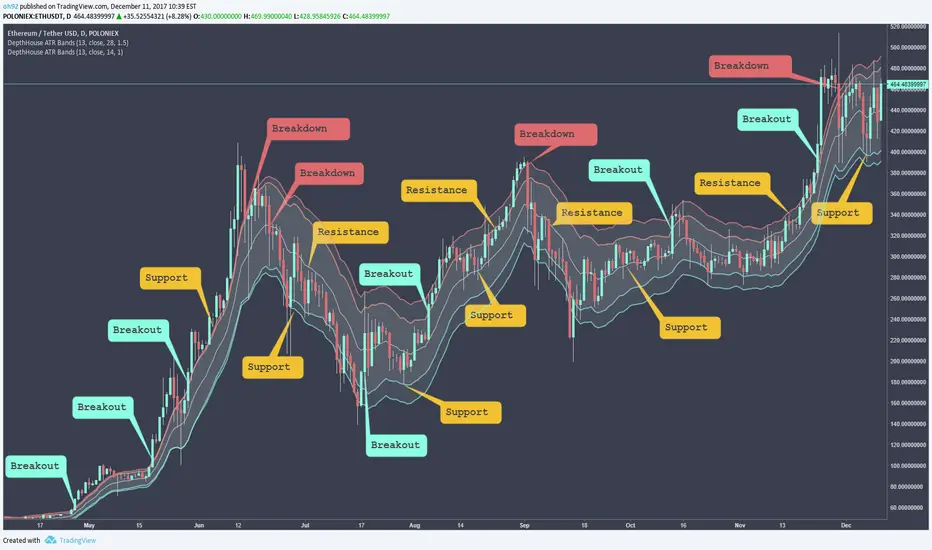
DepthHouse - ATR BandsDepthHouse ATR Bands is a FREE INDICATOR
Similar to the well-known Bollinger Bands.
Instead of using the standard deviation formula, ATR Bands determines the size of the bands based on the adjustable average range.
IF you use this FREE Indicator:
Please like and comment!
Check out my channel on YouTube! youtu.be
Bitcoin and Ethereum Donations are always appreciated :)
BTC : 1MLnVPqebcFTqYEVAKm9dSCRWhyNDmAb5W
ETH : 0xEEcD7Ce6E22AfA6083074c4CCd326Be0b1C932d9
How to use:
The bands tighten while the markets’ range becomes lower, and widens as its' range becomes broader. Giving the indicator a loaded spring effect.
A break outside of the bands in either direction indicates a possible breakout.
All 3 bands serve as possible support and/or resistance. Meaning breaks back into the bands could indicate a reversal, or end of the breakout.
This indicator is completely customizable, so compiling multiple sized bands on top of each other may create a strong competitive edge.
--
IF YOU SUBSCRIBED
This indicator was intended to be available for purchase Jan 2018.
However, with recent change of mind I have decided to make it free to use.
IF you previously subscribed. I greatly appreciate your interest and I hope you enjoy this now FREE indicator!
Once again, thank you!
Ethereum (Mata Wang Kripto)
DepthHouse - Moving Average ChannelsThe indicator Moving Average Channels was created for experimental purposes due to the parabolic moves BTC has made in the recent past.
How it works:
The basis, or center line, is a standard moving average that is set by the user.
The bands are then a customizable percentage of the basis.
Which based on the settings, could serve as possible support and resistance.
DepthHouse – Moving Average Channels has been published for you all to see and try for yourselves.
Maybe this indicator has uses elsewhere? If you find something feel free to post it in the comments below!
If you like this indicator, please drop a like or comment!
They are very much appreciated!
Be sure to go to my profile and check out my other indicators!

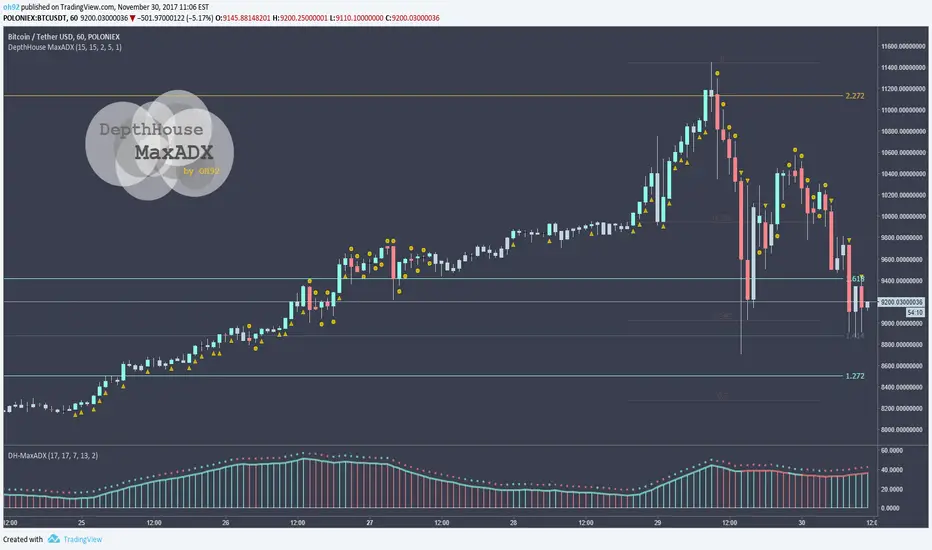
DepthHouse - MaxADX LayoverThis indicator takes our MaxADX a step further by giving possible trend change signals.
MaxADX combines directional information and smoothed moving averages to help traders indicate trend reversals and strengthening trends. As you can see in the chart above this indicator makes it very easy to spot trend reversals in trending markets.
How to use MaxADX Oscillator:
The top circles represent the immediate trend. Used as very early indication of trend changes and/or reversals
The solid line just below that represents the general trend direction. Green meaning up white red meaning down.
The histogram below that represents the general trend strength. A change in that indicate a reversal or a breakout in either direction.
The MaxADX Layover:
The layover then calculates three variables above, and determines the possible direction with symbols and/or bar colors which can easily be turned on or off.
Where this indicator falls short unfortunately, is its use in ranging markets.
Which leaves this as a great indicator for all beginners and professionals who prefer to trade in volatile markets such as cryptocurrencies.
This indicator will be free until January,1st 2018 – see how to get below
--
DepthHouse's MaxADX is 1 of 3 indicators that will be available for purchase via subscription come Jan 2018.
This indicator package will come with the following 3 indicators:
:: MaxADX ::
:: Premium oscillator to help spot forming trends and reversals.
:: MaxADX Signals ::
:: Taking MaxADX a step farther by creating an overlay that show possible trend strengthening and reversals via bar colors and shapes.
:: ATRBands ::
:: Like Bollinger Bands , this indicator is uses to help spot breakouts, and overbought/sold areas.
--
How to get:
To qualify for the trial period which ends January, 1st 2018, please go to the link in my bio and click subscribe!
You will then be sent directions for your account to be added to the whitelist.
If you have already subscribed, you will be added to the list shortly.
DepthHouse-MaxADXDepthHouse's MaxADX is 1 of 3 indicators that will be available for purchase via subscription come Jan 2018.
This indicator combines the use of directional information and smoothed moving averages to help traders indicate trend reversals and strengthening trends. As you can see in the chart above this indicator makes it very easy to spot trend reversals in trending markets.
Where this indicator falls short unfortunately, is its use in ranging markets.
This is a great indicator for all beginners and professionals who prefer to trade in volatile markets such as cryptocurrencies.
This indicator package will come with 3 indicators:
MaxADX
Premium oscillator to help spot forming trends and reversals.
MaxADX Signals
Taking MaxADX a step farther by creating an overlay that show possible trend strengthening and reversals via bar colors and shapes.
ATRBands
Like Bollinger Bands, this indicator is uses to help spot breakouts, and overbought/sold areas.
How to get:
To qualify for the trial period which ends January, 1st 2018, please go to the link in my bio and click subscribe!
You will then be sent directions for your account to be added to the whitelist.

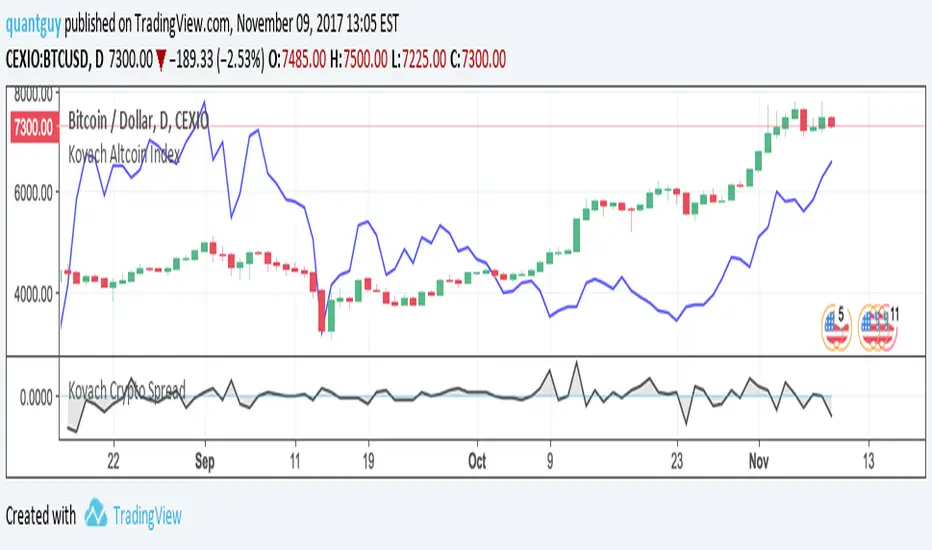
Kovach Altcoin IndexCombined with the Kovach Crypto Spread, these two indicators can help visualize asset flows from Bitcoin to Altcoins and vice versa. For example, now we have a bit of a pullback in Bitcoin due to the Segwit2x fork cancellation. We can clearly see, using the Altcoin index, that Altcoins are rallying from investors pulling out of Bitcoin.
This is further confirmed with the Kovach Crypto Spread indicator, which measures the spread in returns between Bitcoin and the top Altcoins.
Both of these scripts weight Altcoins proportional to their market capitalization, and this is updated weekly so that you constantly have up-to-date parameters, and the indicators adequately reflect the markets in real time.
Check out these indicators as well as the Kovach Momentum Indicators and the Reversals indicator at quantguy.net
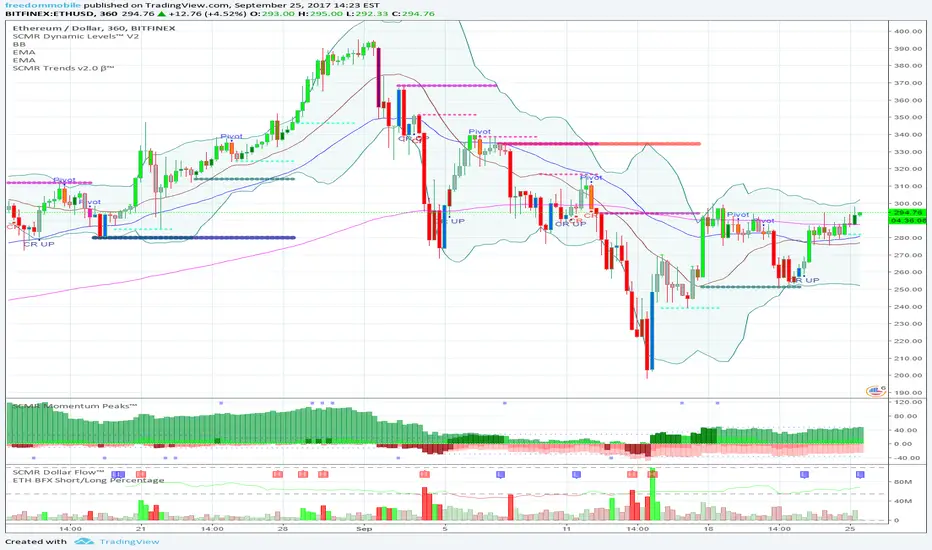
Bitfinex ETH Margin traders- BitfinexAfter good reception of BTC Margin trader indicators, I present to you the ETH margin trader info for Bitfinex exchange.
Hope it helps people.

BFXLS - Compare styleDisplays BitFinex longs and shorts on your chart in the same was as if you add them by using TradingView's "compare" function - major advantage is that this works for all pairs that BitFinex supports without having to manually set up your chart each time.

Crypto-Adjusted Parabolic Stop and Reverse (CAPSAR)Finally, a more accurate PSAR is here!
This PSAR will show up , and stick around when a majority of the Crypto-Currencies in the index below conform in the same direction.
The CAPSAR can be applied to any Crypto-currency and ANY time-frame!
This Crypto-Index makes up over 90% of the Crypto-Currency market cap (total global Crypto investment).
Bitcoin
Ethereum
Bitcoin Cash
Ripple
Litecoin
Nemcoin
Thick Blue lines beneath the price indicate a change in direction, and momentum up.
Thick Red lines above the price indicate a change in direction, and momentum down.
This indicators holds three editable parameters:
1. "Start" - The starting value for the Acceleration Factor (.02 is the Default).
2. "Increment" = The increment in which the Acceleration Factor will move (.02 is Default).
3. "Max" - The maximum value of the Acceleration Factor (.20 is the Default)


BFXLS - BitFinex Long/Shorts
Small improvement upon the above script - all credit should really go to pigloo
Auto-detects ticker and automatically loads the long/shorts for it - so works on more than just BTC
Note - only works on BitFinex and only works for tickers which have long and short data available!
Green area = Longs
Red area = Shorts
Lighter area = Longs - Shorts

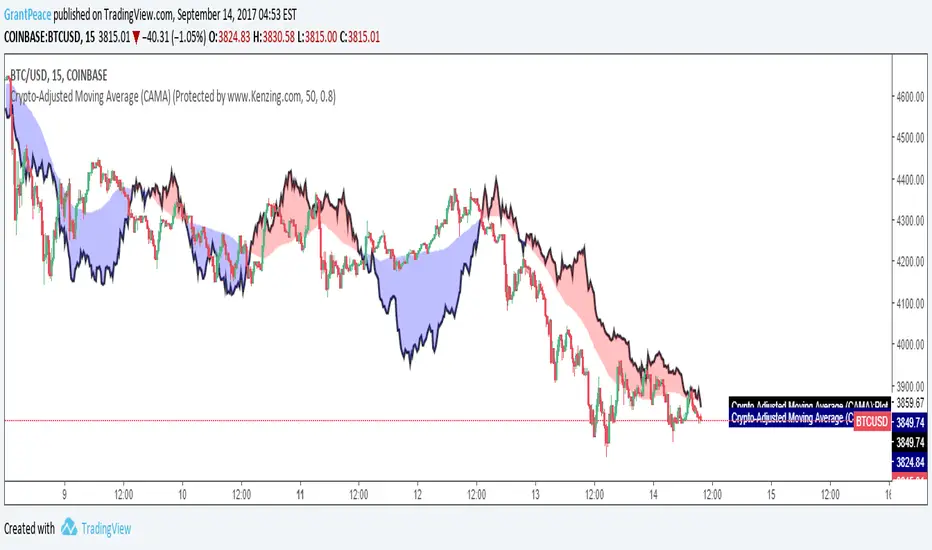
Crypto-Adjusted Moving Average (CAMA)UPDATED! This moving average can now be applied to any Crypto-currency and ANY time-frame!
Request use in the comments :)
This moving average is adjusted to give weight to the performance of the 6 largest Cryptocurrencies by market-cap.
This is the Crypto-Index that affects the moving average.
Bitcoin
Ethereum
Bitcoin Cash
Ripple
Litecoin
Nem Coin.
The use of this indicator is to observe divergence between the price of the underlying asset that is the basis of your chart, and the rest of the Crypto-currency market.
If more Crypto-currencies go down while your observed currency goes up, the CAMA will sit lower and a blue pool will become visible showing that that the chart is performing better than the Crypto-Weighted Index listed above. If more Crypto-currencies go up while your observed currency goes down, the CAMA will sit higher and a red cloud will form, showing that the chart is performing worse than the Crypto-weighted Index.
The indicator uses two variables that can be changed:
"MA_Length" = This is the length of the moving average and is set to 50 by default.
"CryptoFactor" = This is the weighting given to the movement of the Crypto-Index. Essentially, this is the factor as to how much the movement of the Crypto-Index effects the weight of the moving average. If you set this at 0 , the line will be a simple moving average of the set length without any affect of the Crypto-Index.
By default, the CryptoFactor is set to 0.8 .
Holy Grail indicator (possibly) Version 2This is a continuation of the previous (possible) Holy Grail script. This is designed for forex and crypto trading.
The when the price crosses over a line it is a buy/sell signal. When the price crosses the blue area it is a great opportunity to ride the momentum, although quite risky. It is good to follow this in periods of high volume where the smallest trends can be caught. When the price crosses the pink area it is a little less risky than the blue area, but also doesn't catch every wave. When the price crosses back into the blue area it is a good signal that the small trend may be reversing, which also applies to the pink area. Although the pink area provides a little more certainty
The large red line provides the most stable entry points. For everyone that keeps asking, the backtests of the red line are generally very good, it lets profits ride and has almost nonexistent drawdowns. I would be interested in automating it, but it will enter and exit a position way too many times in certain circumstances creating an issue with fees.
The thin purple line shows the general trend. It reacts too slowly to give entry and exit points, but it may be helpful to watch it's behavior. Feel free to message me with any questions, ideas, or interests in collaborations in automated trading.
Cheers

The best Holy Grail indicator (currently)These have been optimized for the cryptocurrency markets, but also seems to work really well in commodities, futures, and forex. A crossover with the closing is treated as a buy or sell signal. The 4 lines provided have different sensitivities and therefore can be treated in combination or separately. This seems to be highly effective in trending markets as a trend follower, and in a ranging market the signals can pretty reliably be reversed for profit. I made this code private because it is still a work in progress and I am interested in hearing people's thoughts and experiences with it for further developments. This is well on the way to becoming a holy grail!
All the best, happy trading
-mcbw_

Lazy Strength v2Enhancement on the Lazy Strength Indicator
1. Diamond at the bottom shows the trends
RED: Downtrend
BLUE: Uptrend
2. Arrows at the top show the Buy/Sell signals
BLUE: BUY
RED: SELL
Wait for the Diamond and Arrows to be aligned.
RED diamond + RED Arrow = SELL at the next candle open
BLUE arrow + BLUE Arrow = Buy at the next candle open
This indicator works on the tradingview Apple app

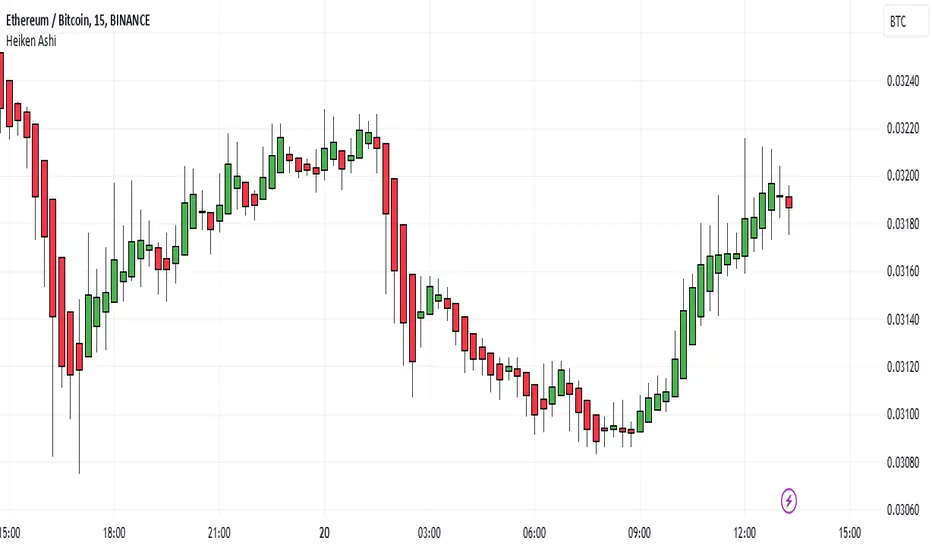
Heiken Ashi Candles
This is a script to place Heiken Ashi candles on your chart alongside another candle type or more importantly, using the variables from this script, you can build a strategy using Heiken Ashi candles that will depict true/proper entries and exits in a strategy when using the backtest feature.
We hope this helps!
MA PostureA simple script I wrote that allows you to look at the posture of a moving average. Rates of change can be useful to understanding momentum. Additionally, I have included a signal line so you can see if the posture is more or less than average.