PDF {pSAR /w HiLo Trends + Fib Retrace/Extension Levels}parabolic SAR /w HighLow Trends Indicator/Bar-color-marking + Dynamic Fib Retrace and Extension Level
~ * ~ * ~ * ~ * ~ * ~ * ~ * ~ * ~ * ~ * ~ * ~ * ~ * ~ * ~ * ~ * ~ * ~ * ~ * ~ * ~
Note:
In no way is this intended as a financial/investment/trading advice. You are responsible for your own investment decisions and trades.
Please exercise your own judgement for your own trades base on your own risk-aversion level and goals as an investor or a trader. The use of OTHER indicators and analysis in conjunction (tailored to your own style of investing/trading) will help improve confidence of your analysis, for you to determine your own trade decisions.
~ * ~ * ~ * ~ * ~ * ~ * ~ * ~ * ~ * ~ * ~ * ~ * ~ * ~ * ~ * ~ * ~ * ~ * ~ * ~ * ~
Please check out my other indicators sets and series, e.g.
LIVIDITIUM (dynamic levels),
AEONDRIFT (standard deviation bands),
FUSIONGAPS (MA based oscillators),
MAJESTIC (Momentum/Acceleration/Jerk Oscillators),
PRISM (pSAR based oscillator, with RSI/StochRSI as well as Momentum/Acceleration/Jerk indicators),
and more to come.
Constructive feedback and suggestions are welcome.
~ JuniAiko
(=^~^=)v~
Fibonacci Retracement

Auto FibonacciAutomatic fibonacci tool.
Still in beta, but works.
will be updating in the future with better improvements, depending on popularity.
Feedback and suggestions welcome.
[VIP] Trading ToolkitIndicator includes:
Auto fibonacci retracement
Auto Gannfan (modified)
Linear Regression
Buy and Sell Signal
Fibonacci extension
Moving averages
Alert includes:
When Buy signal appear
When Sell signal appear
Touch Top Linear Regression
Touch Bottom Linear Regression
Crossunder Middle Linear Regression
Crossover Middle Linear Regression
Disclaimer:
Chart colours and styles are dedicated for Dark template (soon for bright version)
More question or request trial? check links below


™TradeChartist Fib Extensions™TradeChartist Fib Extensions is a free to use script that helps traders plot Fibonacci Extensions on chart. Even though Trading View has a Fib extensions tool, some traders may prefer a plotting script like this with Fib plot lines extending across the whole of the chart to track historic prices in relation to Fib extensions drawn.
----To draw Fib extensions for uptrend ,
1. Choose a Pivot Low point (LL or a HL) as Pivot 1
2. Choose a Pivot High point (must be higher than Pivot 1) as Pivot 2
3. Choose a Pivot Low point (must be lower than Pivot 2, must be Higher than Pivot 1)
----To draw Fib extensions for downtrend,
1. Choose a Pivot High point (HH or a LH) as Pivot 1
2. Choose a Pivot Low point (must be lower than Pivot 1) as Pivot 2
3. Choose a Pivot High point (must be higher than Pivot 2 and lower than Pivot 1)
Negative extensions of -23.6% and -61.8% fib plots may be useful for some to spot reversals or to set stop losses.
Higher levels can be used if price goes beyond 161.8%
This is a free to use indicator. Give a thumbs up or leave a comment if you like the script
Check my 'Scripts' page to see other published scripts. Get in touch with me if you would like access to my invite-only scripts for a trial before deciding on a paid access for a period of your choice. Half-Yearly, Annual and Lifetime access available on invite-only scripts along with 1hr Team Viewer intro session.

Auto Fibonacci Retracement by Atilla YurtsevenAuto Fibonacci Retracement is simply the best Fibonacci retracement indicator ever. Everything is done automatically. Just try it yourself!
Trend Lines and Targets are experimental.
Disclaimer: Past performance is not an indication of future performance. All the information in this article, including the algorithm & indicator, was provided and published for informational purposes only and should not be considered legal or financial advice. Use at your own risk!
Remember to follow me if you like to get notified when i publish new indicators or analysis. You will enjoy it!
Trade safe
Atilla Yurtseven
Twitter: @atillayurtseven

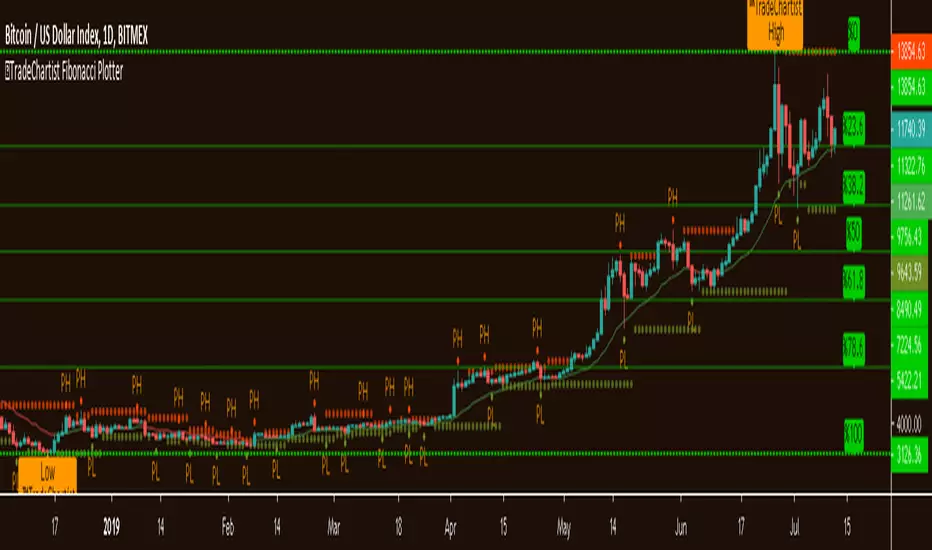
™TradeChartist Fibonacci Plotter™TradeChartist Fibonacci Plotter is a free and easy to use script to plot Fibonacci levels, 20 EMA (20 period Exponential Moving Average) and Pivot Highs/Lows on any time frame chart on any assets like Stocks, Forex, Commodities, Cryptocurrencies etc.
Fibonacci Levels can be plotted using the following options from settings.
1. Lookback type - Candles
Calculates the High and Low price of the user input number of Candles back (100 default) and plots Fibonacci Levels based on the calculated High and Low for the number of candles in the past from the current candle
2. Lookback type - Days
Calculates the High and Low price of the user input number of Days back (100 default) and plots Fibonacci Levels based on the calculated High and Low for the number of days in the past from the day of the current bar. The levels stay intact on any time frame as long as no new Highs or Lows are formed.
3. Manual Price Input
Plots Fibonacci Levels based on the user specified High and Low Price in the settings input screen. The levels stay intact on any time frame irrespective of new Highs or Lows being formed. Using this option and activating higher Fibonacci Levels like 1.272, 1.414 and 1.618 will enable the trader to keep the Levels intact and set alerts based on static higher levels for trade execution when price crosses beyond 100% retracement. On the other two lookback types, higher levels when activated will move dynamically based on new highs or lows being formed and price will never go beyond 100% level.
Example of Manual Price Input for GBP-USD on 1hr chart with higher levels is shown below:
Also the levels can be reversed by checking "Reverse Fibonacci Levels" from settings (Off by Default)
In addition to the Fibonacci plot, 20 period EMA (On by Default) and Pivot Highs/Lows (On by Default) are coded into the script as optional extras as both of these indicators will help make an informed decision in making trade decisions using Fibonacci Levels.
This is a free to use indicator. Give a thumbs up or leave a comment if you like the script
Check my 'Scripts' page to see other published scripts. Get in touch with me if you would like access to my invite-only scripts for a trial before deciding on a paid access for a period of your choice. Monthly, Quarterly, Half-Yearly and 1 Year access available on invite-only scripts along with 1hr Team Viewer intro session.
Rumpy's D/W AutofibsUses yesterday's & last week's high/low to plot auto fibs.
You can toggle them on/off separately as it does become a bit cluttered with both enabled.
--------------------------------------
If you find it useful please consider a tip/donation :
BTC - 3BMEXEDyWJ58eXUEALYPadbn1wwWKmf6sA
--------------------------------------
Weekly fibs
--------------------------------------
Daily fibs

Higher High Lower Low Strategy (With Source Code)This script finds pivot highs and pivot lows then calculates higher highs & lower lows. And also it calculates support/resistance by using HH-HL-LL-LH points.
Generally HH and HL shows up-trend, LL and LH shows down-trend.
If price breaks resistance levels it means the trend is up or if price breaks support level it means the trend is down, so the script changes bar color blue or black. if there is up-trend then bar color is blue, or if down-trend then bar color is black. also as you can see support and resistance levels change dynamically.
If you use smaller numbers for left/right bars then it will be more sensitive.
source code of :


AutoFib
The AutoFib Pro is a useful tool that automatically calculates and plots Fibonacci Retracement levels. Each period, the AutoFib evaluates the price history over a user-specified number of bars. It then finds the extreme high and extreme low points for that window and then uses those values to establish 5 levels based on Fibonacci’s golden ratio.
This provides a simple visual representation of support and resistance levels. The tool’s automated nature means that the levels are dynamically adjusted to account for new extreme highs and lows, as well as irregular movements.
When the bands are located closely together, the security is experiencing high volatility. A large gap between the top and bottom levels signify a price outbreak. When the price crosses the middle 50% level, it is likely (but not guaranteed) to continue in that direction.

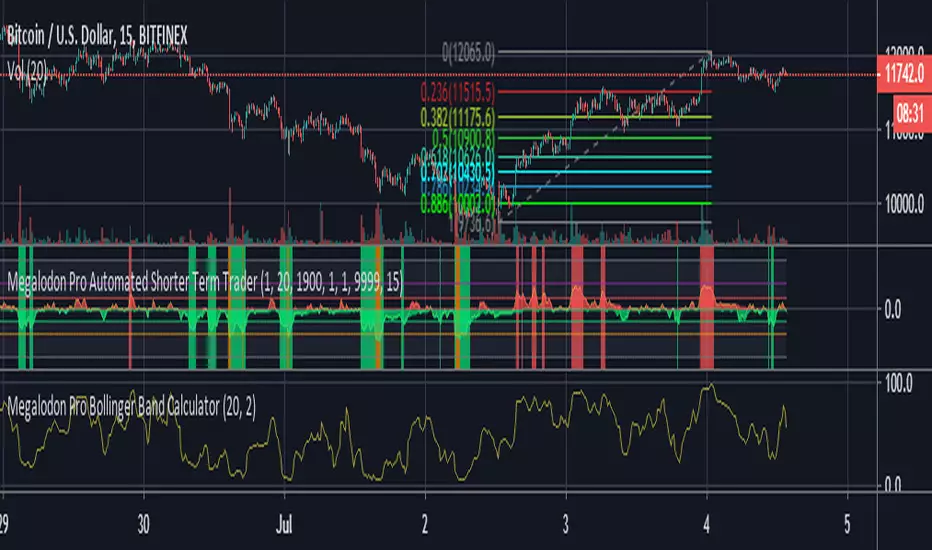
Megalodon Pro Fibonacci CalculatorHow to use?
It ranges between 0-100. 0 is oversold, 100 is overbought.
It could be a really beneficial tool for determining longer term price location.
It is designed for any time frames smaller than 1 Day time frame.

Megalodon Pro Bollinger Band CalculatorHow to use?
It ranges between 0-100. 0 is oversold, 100 is overbought.
It could be a really beneficial tool for timing your day trades in lower time frames.
It is designed for 1 minutes - 15 minutes - 30 minutes - 60 minutes - 240 minutes - 1 Day time frames.
MoT - ZigZag Fibonacci + Ext./Ret. (Extended Ver.)The Indicator plots ZigZags and then overlays Fibonacci Levels (With Extension and Retracement Levels).
W have also programmed the indicator to search for Bullish/Bearish chart patterns in the form of ABC's, ABCD's, 3 Drives , BAT etc etc.
We have also added multiple time frame (MTF) options so the script will search for swing Highs/Lows over a larger period.
Please Note - This Version is with Extended lines of the most current Fib Levels. Which can make the charts look very busy. The other Indicator (No Extensions - Cleaner) is here:

OmegaWhile others Seek Alpha, we seek Omega™
Market tops and Bottoms on any time frame and at your fingertips
Leave Nothing On The Table
Stop Guessing - Start Profiting - Stop Watching - Start Living
Enjoy,
Arbitrage Trade Team

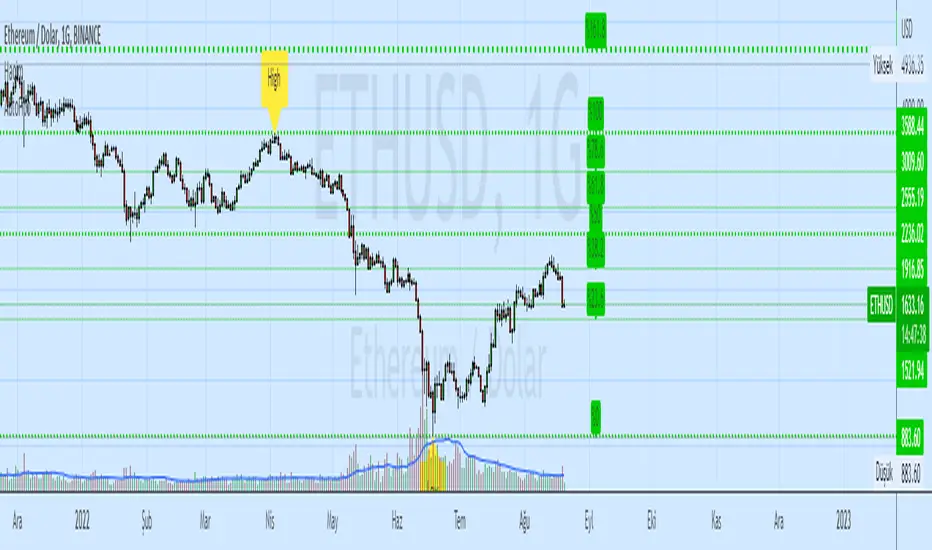
JD Auto Fibonacci LevelAuto Fibonacci Levels
This indicator will automatically check lowest and highest candle of last 144 candles.based on which Fibonacci levels will automatically get applied on to the charts.
These level are support and resistance of the market and help us to find the targets in up and down trend.
Created by Crypto Money Mantra Jatin Dembla
Date : 1-June-2019

RyuFib Auto Fibonacci Retracement🔰 Auto Fibonacci Retracement
📌Auto plots the Fibonacci levels the same as the Fib Retracement tool from the high to low or low to high according to the set length. This tool saves you 2 seconds from manually drawing the Fibonacci Retracement, however, having to do on 100 different charts can save time; and can set up on various timeframes to show to get a quick look at the fib support/resistance levels of the chart. Shows additional fib levels and fib extensions. Can set custom timeframe to add multiple fib indicators for different timeframes shown, or to always show a particular timeframe. Can set the length for different timeframes, so you can flip between timeframes without having to adjust. The 12h and daily timeframes are shorter length since if it's too long the chart history may not be long enough.
📌Features
🔹Fibonacci Retracement Levels (show/hide all)
🔹Fibonacci Extension Levels (option show/hide all)
🔹Fibonacci Text Labels (option show/hide all)
🔹Select fib Retracement type, from high to low or low to high
🔹Select fib candle type, from the wick or candle close
🔹Select fib custom timeframe
🔹Select custom length back for different timeframes, shorter 4h and under, 12, and daily
🔹Select fib line width
🔹Select fib text labels position offset
📌Note: If the fibs are not showing then the chart history is too short for the length, adjust the fib length.

Median trend with support and resistance fibonacci retracementFirst try automated fibonacci retracement

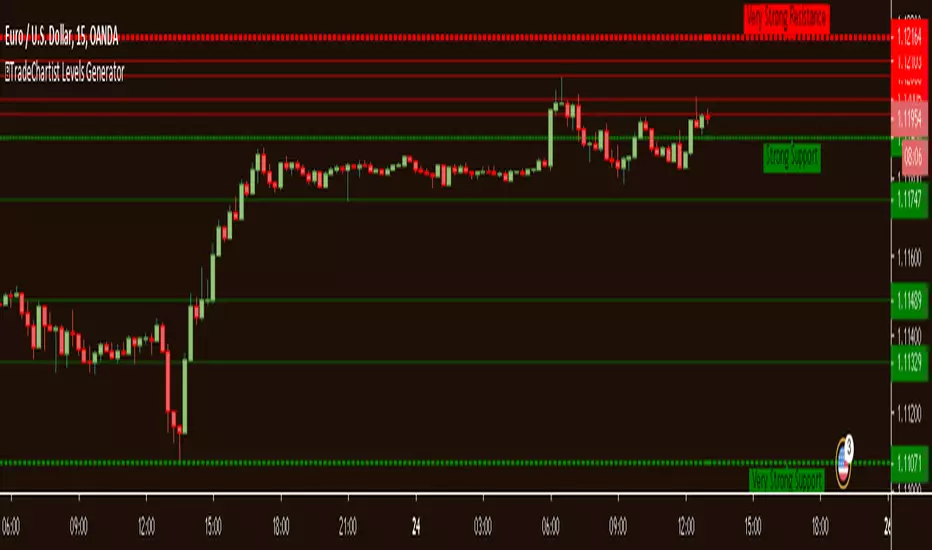
Levels Generator with Fibs"Levels Generator with Fibs" is an easy to use and a well coded script that can be used by traders of all levels from beginners to advanced professionals.
What does the script do?
Plots the support and resistance levels automatically based on user preference of Local or Global levels from indicator settings.
Plots Fibonacci retracement levels between high and low based on 'Days' or 'Candles' lookback from indicator settings.
What markets can this script be used on?
Forex
Stocks
Commodities
Cryptocurrencies
and almost any asset on Trading View
Does the script repaint levels?
No. The script does not repaint as it plots levels based on the past price movement. The only time the levels change for a given timeframe is when the price makes a new All Time High or a new All Time Low.
What is the difference between "Plot Levels" and "Plot Fibonacci Levels"?
"Plot Levels" plots support and resistance levels automatically without any input from the user other than preferred levels 'plot' from the indicator settings namely
Plot All Global Levels - Plots all important levels from ATH to ATL (dependent on data age/availability on Trading View) - recommended for Long term outlook
Plot Local Levels for Higher TF - Plots all important Support/Resistance levels for mostly higher time frames (1hr or higher) - Short to Mid term outlook
Plot Local Levels for Lower TF - Plots all important Support/Resistance levels for mostly smaller time frames (can be used for up to 1hr in most cases) - Recommended for Scalping/Swing Trading mostly dependent on volatility
"Plot Fibonacci Levels" plots all standard Fibonacci retracement levels - 0, 23.6%, 38.2%, 50%, 61.8%, 78.6% and 100% based on
"Days" Lookback - Fibonacci levels between High and Low based on number of days in the past, starting from the current day on any time frame chart
"Candles" Lookback - Fibonacci levels between High and Low based on number of candles in the past, starting from the current candle on any time frame chart
Can the Fibonacci levels be reversed?
Yes. The Fibonacci levels can be reversed by checking the "Reverse" checkbox from the indicator settings. This is very handy if the trend looks like there may be a support or resistance from one of the Fib levels and a possibility of a new high or a new low based on the price action.
What is the need for "Plot 1.272 Fibonacci Level" under "Plot Fibonacci Levels"?
1.272 is an important Fibonacci number as it is the square root of 1.618 and is the near support or resistance after 100% price retracement. Even though it keeps moving on the chart dependent on the new high or new low based on Days/Candles lookback, it serves as a 'nice to have' reference for any trader looking beyond 100% retracement for support/resistance.
Why do the 'local levels' lines' color changes between green and red?
The nearby levels lines change color based on price closing above or below them. This happens to only closest local levels for lower TF near price action and for top/bottom lines of the local levels for higher TF.
The line turns green when it becomes support as price closes above it.
The line turns red when it becomes resistance as price closes below it.
Can the levels lines' colors be changed?
Yes. The color of the Higher TF levels and all Global levels (from "Plot All Global Levels") can be changed from the 'Styles' tab from the indicator settings. Some lines change between green and red (which show on both light and dark themed background), so they are not editable and are hidden, but all other lines can be edited to show /hide or change color from the 'Styles' tab on the indicator settings.
What chart background is recommended?
The colors of the levels are neutral to both light and dark background of the chart screen, but a black or a dark background shows the lines even better. It comes down to user preference. If the default horizontal and vertical lines on chart screen is of no use, it can be hidden from 'Background' tab on Trading View chart settings by increasing the transparency of the lines all the way up.
Get in touch with me if you would like access to the script on monthly, 6 monthly or annual basis.
Auto FIB v1Auto FIB indicator defects automatically high and low for the coins and created Fib lines.
I would greatly appreciate if you could leave feedback on this indicator.
if you like this indicator, I would greatly appreciate if you can donate for the hard work.
BTC - 138yXLNU2CJBuTJ9tBYkKBcv1wC17VN2RV
ETH -0x435a32d7F1383626F271eE9f999d18b83453BF80
LTC - LcsfSCsRDqPWxH7vC5wMGJXh8x3bfKvvZj
ETC - 0x3f6cAfdc0544a34DdC0E0fd4908C68Ec6a803708
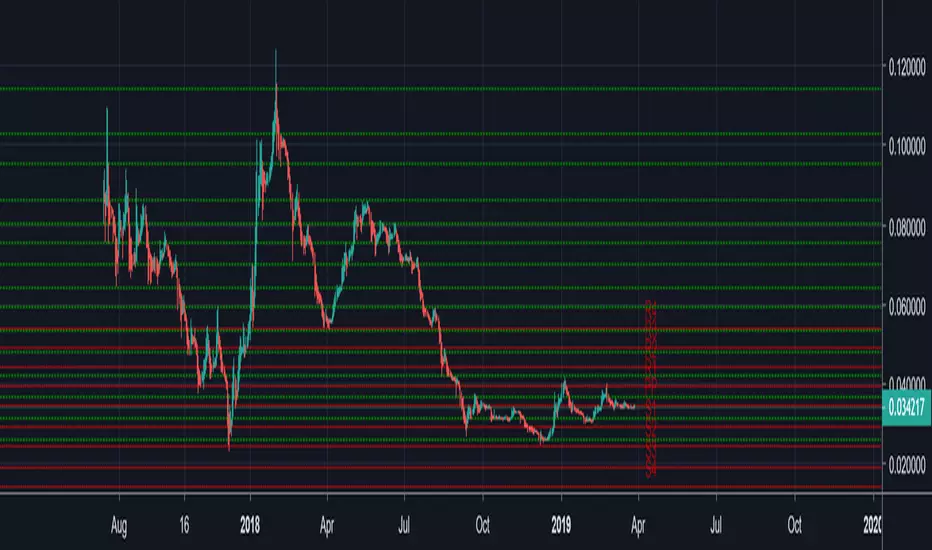
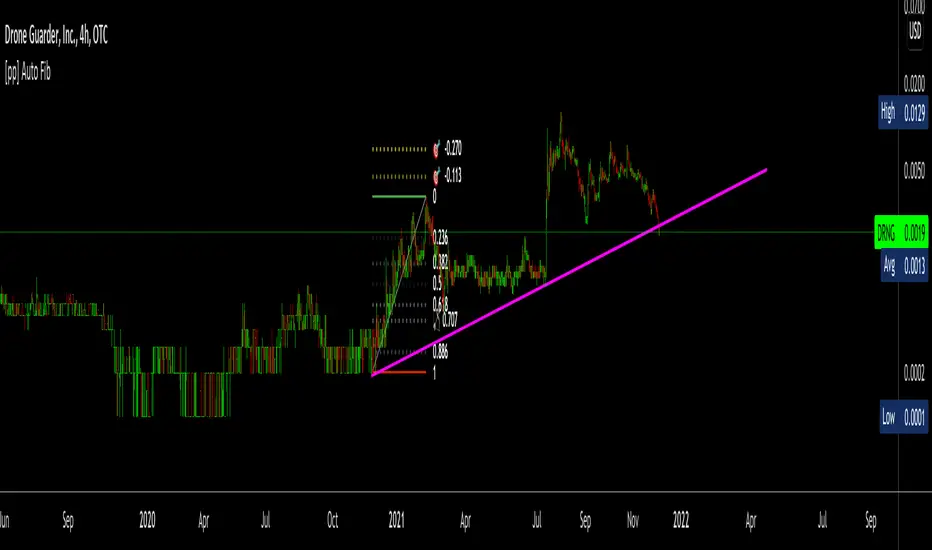
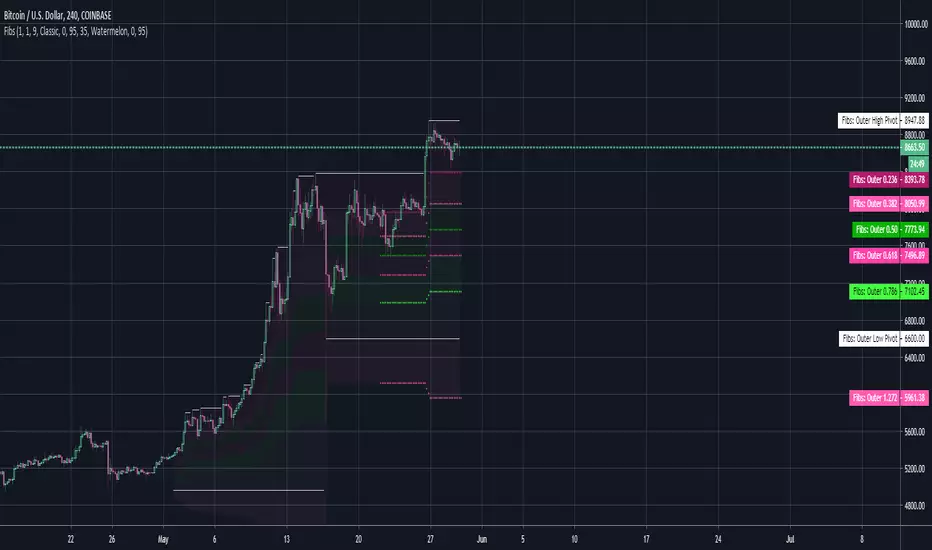
DrungleOG's Auto Fibs PVI got tired of manually using the Fib retracement tool on pivots. This little guy automates it for me. Does not have all levels in this version, mostly just the ones I use. Can add all later if there's interest.
23.6%
38.2%
50%
61.8%
78.6%
127.20%
You can have two sets of Fibs, Inner and Outer. Use the outer for the larger runs and the inner for smaller. The Fib lines have a look back view window of 48 bars and the base/resistance lines have 168 (a week's worth of time on the 1h). The lookback window is based on the view (show_last param) not the pivot calculations.
-DrungleOG
Fib Signals | -- MoonLaunchr --Script that can display signals against key Fibonacci levels based on highs and lows within a given time-frame
Set the number of days back in time that you would like the indicator to look for the high and low for calculating fibs.
Bear Market options include sub-level fibs within the 12.3% range - 38.2 and 61.8% 3 levels deep.
Signals when crossing over and under key fibs.
Set ALERTS for each key fib piercing.
Set ALERTS when new highs or lows are made.
All levels and signals can be displayed or hidden and customised within the indicator options.
Next candle price projection.
Bull Market key fib sub-levels will be added in the next update (top 12.8% sub-levels 1,2 & 3).
Happy trading!
