Fibonacci Sequence Circles [BigBeluga]🔵 Overview
The Fibonacci Sequence Circles is a unique and visually intuitive indicator designed for the TradingView platform. It combines the principles of the Fibonacci sequence with geometric circles to help traders identify potential support and resistance levels, as well as price expansion zones. The indicator dynamically anchors to key price points, such as pivot highs, pivot lows, or timeframe changes (daily, weekly, monthly), and generates Fibonacci-based circles around these anchor points.
⚠️For proper indicators visualization use simple not logarithmic chart
🔵 Key Features
Customizable Anchor Points : The indicator can be anchored to Pivot Highs , Pivot Lows , or timeframe changes ( Daily, Weekly, Monthly ), making it adaptable to various trading strategies.
Fibonacci Sequence Logic : The circles are generated using the Fibonacci sequence, where the diameter of each circle is the sum of the diameters of the two preceding circles.
first = start_val
secon = start_val + int(start_val/2)
three = first + secon
four = secon + three
five = three + four
six = four + five
seven = five + six
eight = six + seven
nine = seven + eight
ten = eight + nine
Adjustable Start Value : Traders can modify the starting value of the sequence to scale the circles larger or smaller, ensuring they fit the current price action.
Color Customization : Each circle can be individually enabled or disabled, and its color can be customized for better visual clarity.
Visual Labels : The diameter of each circle (in bars) is displayed next to the circle, providing additional context for analysis.
🔵 Usage
Step 1: Set the Anchor Point - Choose the anchor type ( Pivot High, Pivot Low, Daily, Weekly, Monthly ) to define the center of the Fibonacci circles.
Step 2: Adjust the Start Value - Modify the starting value of the Fibonacci sequence to scale the circles according to the price action.
Step 3: Customize Circle Colors - Enable or disable specific circles and adjust their colors for better visualization.
Step 4: Analyze Price Action - Use the circles to identify potential support/resistance levels, price expansion zones, or trend continuation areas.
Step 5: Combine with Other Tools - Enhance your analysis by combining the indicator with other technical tools like trendlines, moving averages, or volume indicators.
The Fibonacci Sequence Circles is a powerful and flexible tool for traders who rely on Fibonacci principles and geometric patterns. Its ability to anchor to key price points and dynamically scale based on market conditions makes it suitable for various trading styles and timeframes. Whether you're a day trader or a long-term investor, this indicator can help you visualize and anticipate price movements with greater precision.
Fibonaccisequence

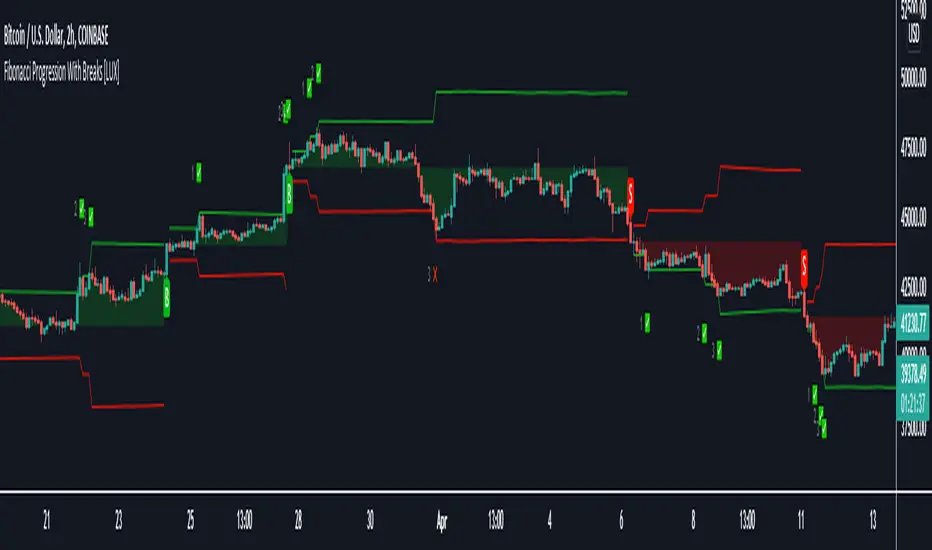
Fibonacci Progression with Breaks [LuxAlgo]This indicator highlights points where price significantly deviates from a central level. This deviation distance is determined by a user-set value or using a multiple of a period 200 Atr and is multiplied by successive values of the Fibonacci sequence.
Settings
Method: Distance method, options include "Manual" or "Atr"
Size: Distance in points if the selected method is "Manual" or Atr multiplier if the selected method is "Atr"
Sequence Length: Determines the maximum number of significant deviations allowed.
Usage
The indicator allows highlighting potential reversal points, but it can also determine trends using the central level, with an uptrend detected if the central level is higher than its previous value and vice versa for a downtrend.
When an uptrend is detected, and the price deviates significantly upward from it a first checkmark will be highlighted alongside the Fibonacci sequence used as a multiplier, if the price deviates downward, a cross will be shown instead, then the distance threshold will be multiplied by the next value in the Fibonacci sequence.
If the price deviates from the central level such that the length of the sequence is greater than the user set Sequence Length , a break label will be shown alongside a new central level with a value determined by the current closing price, while the Fibonacci multiplier will be reset to 1.
Upper and lower extremities made from the central level and threshold distance are highlighted and can be used as support and resistances.