Time Session Filter - Visual Only - @Davi117 Simple visual adjustable time filter to highlight certain times of the day.
For instance if you only trade between 06:00 and 10:00 etc.
Includes Time Zone Selector using GMT
E.g if you live in London then you time zone will be just GMT, else if you live in Paris it would be GMT+1.
Ensure Trading View's time zone selection in the bottom right to the left of the Auto Scale toggle, is also set also set to your time zone, else it will be misaligned.
Filter
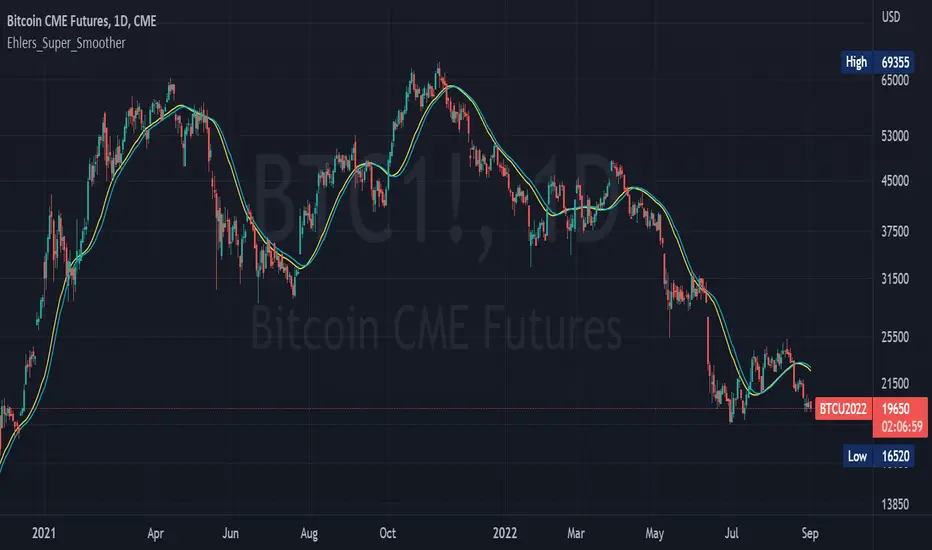
Ehlers_Super_SmootherThe 2 Pole and 3 Pole Super Smoother Filters were developed by John Ehlers and described in "Chapter 13: Super Smother" of his book Cybernetic Analysis for Stocks and Futures .
The 2 Pole Smoother is described as being a better approximation of price, whereas the 3 Pole Smoother has superior smoothing.
Library "Ehlers_Super_Smoother"
Provides the functions to calculate Double and Triple Exponentional Moving Averages (DEMA & TEMA)
twoPole(_source, _length) Calculates 2 Pole Ehlers Super Smoother Filter
Parameters:
_source : -> Open, Close, High, Low, etc ('close' is used if no argument is supplied)
_length : -> Ehlers Super Smoother length
Returns: 2 Pole Ehlers Super Smoothing to an input source at the specified input length
threePole(_source, _length) Calculates 3 Pole Ehlers Super Smoother Filter
Parameters:
_source : -> Open, Close, High, Low, etc ('close' is used if no argument is supplied)
_length : -> Ehlers Super Smoother length
Returns: 3 Pole Ehlers Super Smoothing to an input source at the specified input length
Laguerre FilterThis is the Laguerre Filter by John F. Ehlers. He published this filter design in the article Time Wrap - Without Space Travel.
This study open gamma and weight of each filter for to customize the filter design.
For example, setting gamma to 0.2, 0.7, 0.8,0.8 and weight 1,2,2,1, the curve is a very nice simulation to ALMZ(50),
setting gamma to 0.3, 0.3, 0.8, 0.9 and weight of 1,3,3,1 will produce a curve close to EMA(20),
basically, the Laguerre filter can simulate various type of moving averages.
The beauty of this Filter is it use only one data point and 3 filters output to reproduce various moving average, it is
an innovative approach to develop smoothing lines, and to avoid whipsaws on the price.
Each filter can be plotted for evaluation too.
Data of the first filter allows to input any bar, eg. 0 for current bar, 1 for one previous, for the purpose to evaluate forecasting idea.
Follows Ehlers' paper, this study allows to plot the weighted average line with all filter off.

[DSPrated] Modified EMD for swing tradeModified Ehlers Empirical Mode Decomposition indicator for swing trade based on Butterworth 2nd order IIR filter
Description
This script is inspired by John Ehlers' TECHNICAL PAPERS - Truncating Indicators and Empirical Mode Decomposition. But instead of detecting trend it applies to finding swing regions.
Also here is suggested canonical DSP approach for designing coefficients for Butterworth 2nd order IIR filters - bandpass and lowpass.
Besides, truncated IIR filter with configurable length parameter is used. It worth mentioning, that although truncated filter is more robust than original IIR, it losses specified properties (bandpass) the more, the less is length parameter.
Butterworth Bandpass Infinite Impulse Response (IIR) Filter
This is the 2nd order Butterworth Bandpass Infinite Impulse Response (IIR) Filter based on the transform from the 1st order lowpass
Based on the example 8.8 on p476 from book Digital Signal Processing: A Practical Approach 2nd Edition by Emmanuel C. Ifeachor (Author), Barrie W. Jervis (Author)
It differs from Ehlers BandPass Filter only in the way you initialize input parameters. Here you can define cutoff periods of region of interest. For example on a timeframe, where one bar equals 1 hour you can define periods 18 and 22, which mean you'll see the swing intensity of price movement components within specified range.
Parameters
Source
Period 1 - cutoff period of bandpass begining
Period 2 - cutoff period of the end of bandpass
length - IIR truncation length
Concept of usage
Within specified bandpass this indicator eliminates the Trend line according to Ehlers EMD. The bandpass periods is recommended to choose accordingly to personal comfortable trading style and timeframe.
The trendline painted with 3 colors depending of the next modes:
up tend - green
cycling - black
downtrend - red
So the buy signal is generated when trend line in cycling mode and filtered component reaches it local minimum.
And the sell signal is generated when trend line in cycling mode and filtered component reaches it local maximum.
Secure long and short zones marked with color.
---
// TO DO
// - compare truncated and full version using signal generators
// - apply zero lag filter modification fordetectig ternd and swing peroids
// - implement strategy scripts
// - implement somewhat "true" EMD with sevral IMFs(intrinsic mode function)
// - better description?
// - parameter optimization
---
Please, feel free to report any issues and improvement suggestions.

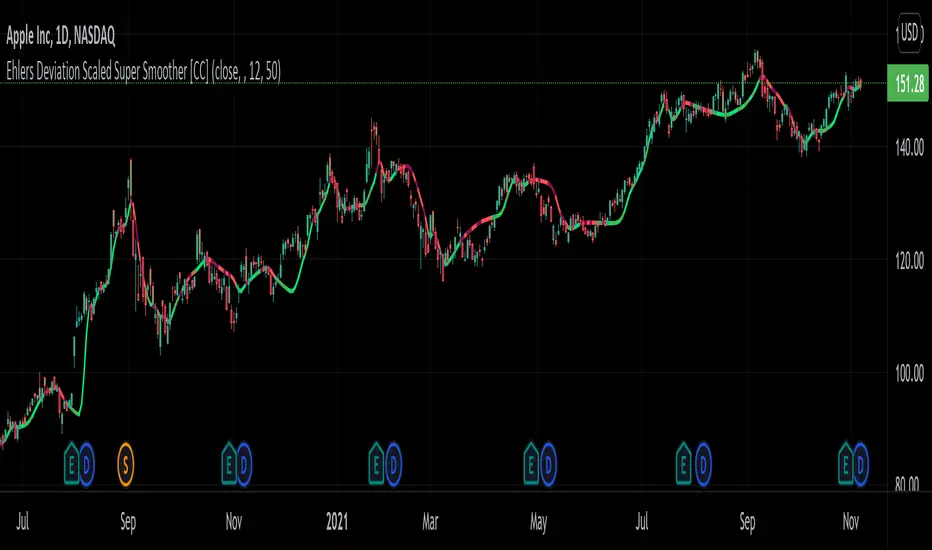
Ehlers Deviation Scaled Super Smoother [CC]The Deviation Scaled Super Smoother was created by John Ehlers and this is an excellent moving average that changes direction very quickly and can keep up with the current underlying trend. This indicator works by applying a Hann Windowed Moving Average to the stock's momentum and scaling that by the Root Mean Square and then using that value in the input for a Super Smoother . I have included strong buy and sell signals in addition to normal ones so lighter colors are normal signals and darker colors are strong ones. Buy when the line turns green and sell when it turns red.
Let me know if there are any other scripts you would like to see me publish!
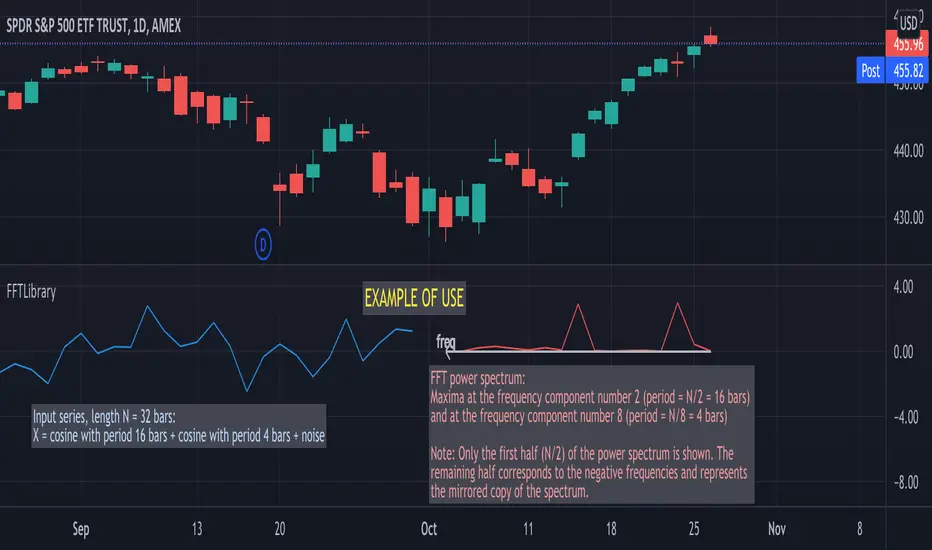
FFTLibraryLibrary "FFTLibrary" contains a function for performing Fast Fourier Transform (FFT) along with a few helper functions. In general, FFT is defined for complex inputs and outputs. The real and imaginary parts of formally complex data are treated as separate arrays (denoted as x and y). For real-valued data, the array of imaginary parts should be filled with zeros.
FFT function
fft(x, y, dir) : Computes the one-dimensional discrete Fourier transform using an in-place complex-to-complex FFT algorithm . Note: The transform also produces a mirror copy of the frequency components, which correspond to the signal's negative frequencies.
Parameters:
x : float array, real part of the data, array size must be a power of 2
y : float array, imaginary part of the data, array size must be the same as x ; for real-valued input, y must be an array of zeros
dir : string, options = , defines the direction of the transform: forward" (time-to-frequency) or inverse (frequency-to-time)
Returns: x, y : tuple (float array, float array), real and imaginary parts of the transformed data (original x and y are changed on output)
Helper functions
fftPower(x, y) : Helper function that computes the power of each frequency component (in other words, Fourier amplitudes squared).
Parameters:
x : float array, real part of the Fourier amplitudes
y : float array, imaginary part of the Fourier amplitudes
Returns: power : float array of the same length as x and y , Fourier amplitudes squared
fftFreq(N) : Helper function that returns the FFT sample frequencies defined in cycles per timeframe unit. For example, if the timeframe is 5m, the frequencies are in cycles/(5 minutes).
Parameters:
N : int, window length (number of points in the transformed dataset)
Returns: freq : float array of N, contains the sample frequencies (with zero at the start).
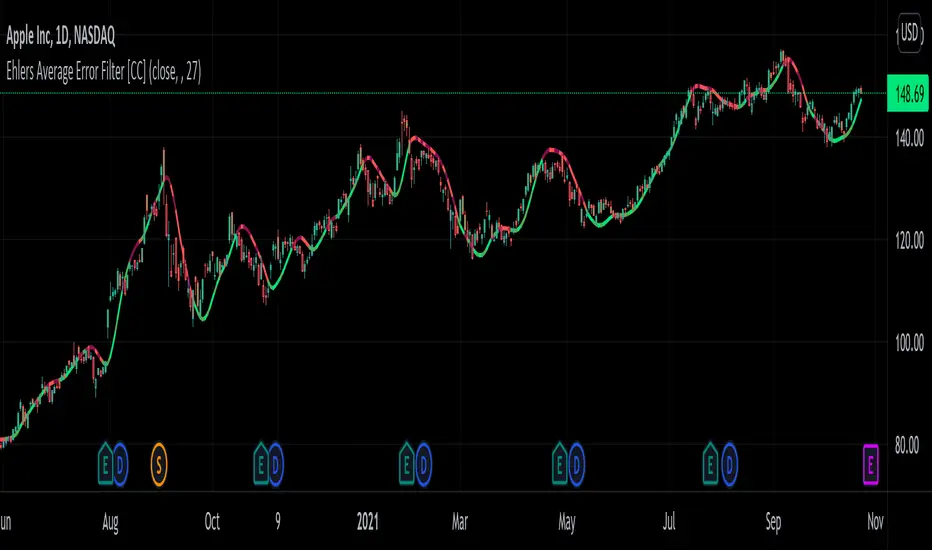
Ehlers Average Error Filter [CC]The Average Error Filter was created by John Ehlers and this is a variation of a Zero Lag Exponential Moving Average that uses a Super Smoother to filter out the noise and then uses a second Super Smoother of the difference between the current price and the filtered data. This works well as a trendline and does give out a few false signals like all indicators inevitably do but most signals do a good job of keeping up with the trend and providing clear entries and exits when the trend changes. I have included strong buy and sell signals in addition to normal ones so like always darker colors are strong signals and lighter colors are normal ones. Buy when the line turns green and sell when it turns red.
Let me know if there are any other scripts you would like to see me publish!
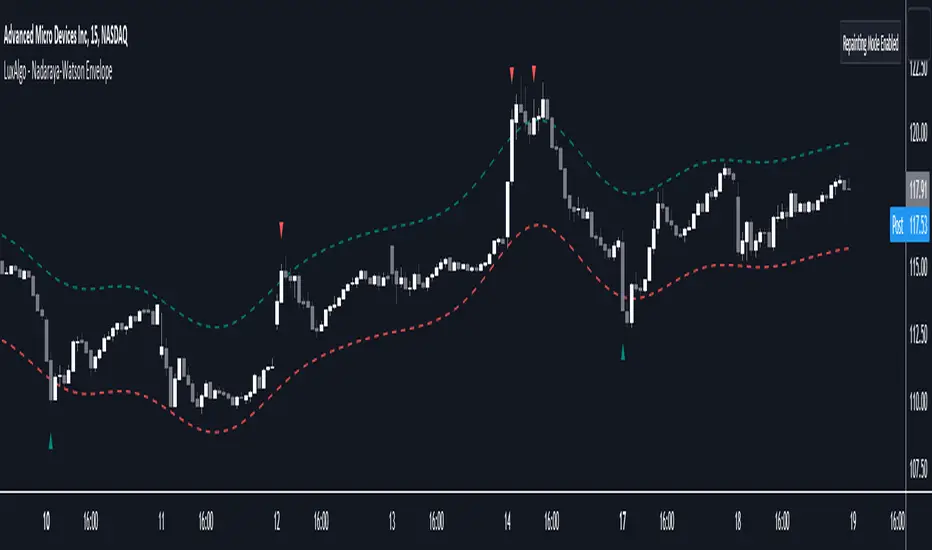
Nadaraya-Watson Envelope [LuxAlgo]This indicator builds upon the previously posted Nadaraya-Watson smoothers. Here we have created an envelope indicator based on Kernel Smoothing with integrated alerts from crosses between the price and envelope extremities. Unlike the Nadaraya-Watson estimator, this indicator follows a contrarian methodology.
Please note that by default this indicator can be subject to repainting. Users can use a non-repainting smoothing method available from the settings. The triangle labels are designed so that the indicator remains useful in real-time applications.
🔶 USAGE
🔹 Non Repainting
This tool can outline extremes made by the prices. This is achieved by estimating the underlying trend in the price, then calculating the mean absolute deviations from it, the obtained result is added/subtracted to the estimated underlying trend.
The non-repainting method estimates the underlying trend in price using an "endpoint Nadaraya-Watson estimator", and would return similar results to more classical band indicators.
🔹 Repainting
The repainting method makes use of the Nadaraya-Watson estimator to estimate the underlying trend in the price. The construction of the band extremities is the same as in the non-repainting method.
We can expect the price to reverse when crossing one of the envelope extremities. Crosses between the price and the envelopes extremities are indicated with triangles on the chart.
For real-time applications, triangles are always displayed when a cross occurs and remain displayed at the location it first appeared even if the cross is no longer visible after a recalculation of the envelope.
By popular demand, we have integrated alerts for this indicator from the crosses between the price and the envelope extremities. However, we do not recommend this precise method to be used alone or for solely real-time applications. We do not have data supporting the performance of this tool over more classical bands/envelope/channels indicators.
🔶 SETTINGS
Bandwidth: Controls the degree of smoothness of the envelopes, with higher values returning smoother results.
Mult: Controls the envelope width.
Source: Input source of the indicator.
Repainting Smoothing: Determine if a repainting or non-repainting method should be used for the calculation of the indicator.
🔶 RELATED SCRIPTS
For more information on the Nadaraya-Watson estimator see:
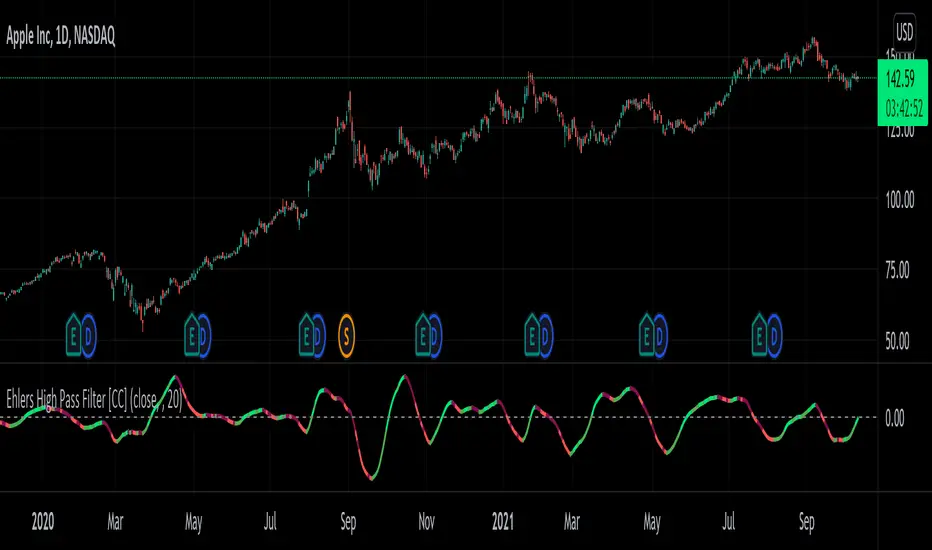
Ehlers High Pass Filter [CC]The High Pass Filter was created by John Ehlers and I would define this indicator as both a momentum indicator but also a predictor indicator. This does a pretty good job of predicting future price action even though I have double smoothed it to provide clear buy and sell signals. I will be publishing quite a few more Ehlers indicators very soon so stay tuned. This indicator can be interpreted in a few different ways but most importantly it is a mid to long term sell signal when the indicator falls below the zero line and vice versa. It also falls below the zero line when the underlying price data starts losing momentum so it can be used also as a price reversal. I have included strong buy and sell signals in addition to normal ones so darker colors are strong signals and lighter colors are normal signals. Buy when the line turns green and sell when it turns red.
Let me know if there are any other indicators you would like to see me publish!
Ehlers Cycle BandPass Filter [CC]The Cycle BandPass Filter was created by John Ehlers (Cycle Modes and Trend Modes) and this is an alternate to the default BandPass Filter by changing some settings. This will be another series I will be introducing showing some indicators created by Ehlers and that didn't get much attention. This identifies the underlying cycle in the price data and these indicators aren't very common so I want to introduce more of these to tv. Buying and selling with these indicators can be a bit tricky but overall what Ehlers recommends is to buy at the lowest point and sell at the highest point to capture the underlying cycle. I have included strong buy and sell signals as darker colors and normal signals as lighter colors. Buy when the line turns green and sell when it turns red.
Let me know if there are any other scripts you would like to see me publish!

Nadaraya-Watson Smoothers [LuxAlgo]The following tool smoothes the price data using various methods derived from the Nadaraya-Watson estimator, a simple Kernel regression method. This method makes use of the Gaussian kernel as a weighting function.
Users have the option to use a non-repainting as well as a repainting method, see the USAGE section for more information.
🔶 USAGE
🔹 Non Repainting
When Repainting Smoothing is disabled the returned indicator acts similarly to a regular causal moving average. This result could be described as an "endpoint Nadaraya-Watson estimator".
Unlike a regular moving average whose degree of smoothness is commonly determined by the length of its calculation window, the degree of smoothness of the proposed indicator is determined by the bandwidth setting, with a higher value returning smoother results.
In the above chart, a bandwidth value of 50 is used. An increasing value of the smoother is indicative of an uptrend, while a decreasing value is indicative of a downtrend.
🔹 Repainting
Non-causal smoothing methods have found low support from technical analysts because they tend to repaint. Yet, they can provide powerful insights such as estimating underlying trends in the price as well as seeing how far prices deviate from them. They can also make drawing certain patterns easier and can help see underlying structures in the price more clearly.
Using higher bandwidth values allows for estimating longer-term trends in the price.
Triangular labels highlight points where the direction of the estimator change. This allows for the identification of tops and bottoms in the underlying trend which can be compared to the actual price tops and bottoms.
Note that multiple labels can appear in real time, highlighting real-time changes in the estimator's direction. The most recent label on a series of labels is the first to appear. This can eventually be useful for the real-time predictive application of the estimator. However, it is not a usage we particularly recommend.
🔶 DETAILS
The Nadaraya-Watson estimator can be described as a series of weighted averages using a specific normalized kernel as a weighting function. For each point of the estimator at time t , the peak of the kernel is located at time t , as such the highest weights are attributed to values neighboring the price located at time t .
A lower bandwidth value would contribute toward a more important weighting of the price at a precise point and would as such less smooth results. In the case where our bandwidth is so small that the resulting kernel is just an impulse, we would get the raw price back.
However, when the bandwidth is sufficiently large, prices would be weighted similarly, thus resulting in a result closer to the price mean.
It can be interesting to note that due to the nature of the estimator and its weighting procedure, real-time results would not deviate drastically for points in the estimator near the center of the calculation window.
🔶 SETTINGS
Bandwidth : controls the bandwidth of the Gaussian kernel, with higher values returning smoother results.
Src : Input source of the kernel regression.
Repainting Smoothing : Determine if the smoothing method should repaint or not. If disabled the "endpoint Nadaraya-Watson estimator" is returned.

Ehlers Simple Window Indicator [CC]The Simple Window Indicator was created by John Ehlers (Stocks and Commodities Sep 2021) and this is the last of the 4 new indicators that he published in the latest issue of Stocks & Commodities. Since these are all part of a series, the idea behind each indicator is the exact same. The only difference is of course the calculation for each indicator. This script is different mostly because it is extremely noisy in comparison so I had to smooth it twice to provide clear buy and sell signals. Window functions are used in digital signal processing to filter out noise and the end result is an oscillator that centers around the 0 line. The easy way to understand these indicators that I will be publishing and those are that when they are above 0, it usually means an uptrend and below 0 then a downtrend. For more immediate signals, I have included both normal and strong buy and sell signals so darker colors for strong signals and lighter colors for normal signals. Buy when the line turns green and sell when it turns red.
Let me know if there are any other indicators you would like me to publish!

Ehlers Triangle Window Indicator [CC]The Triangle Window Indicator was created by John Ehlers (Stocks and Commodities Sep 2021) and this is one of 4 new indicators that he published in the latest issue of Stocks & Commodities and I will be publishing the last one tomorrow. Since these are all part of a series, the idea behind each indicator is the exact same. The only difference is of course the calculation for each indicator. Window functions are used in digital signal processing to filter out noise and the end result is an oscillator that centers around the 0 line. The easy way to understand these indicators that I will be publishing and those are that when they are above 0, it usually means an uptrend and below 0 then a downtrend. For more immediate signals, I have included both normal and strong buy and sell signals so darker colors for strong signals and lighter colors for normal signals. Buy when the line turns green and sell when it turns red.
Let me know if there are any other indicators you would like me to publish!

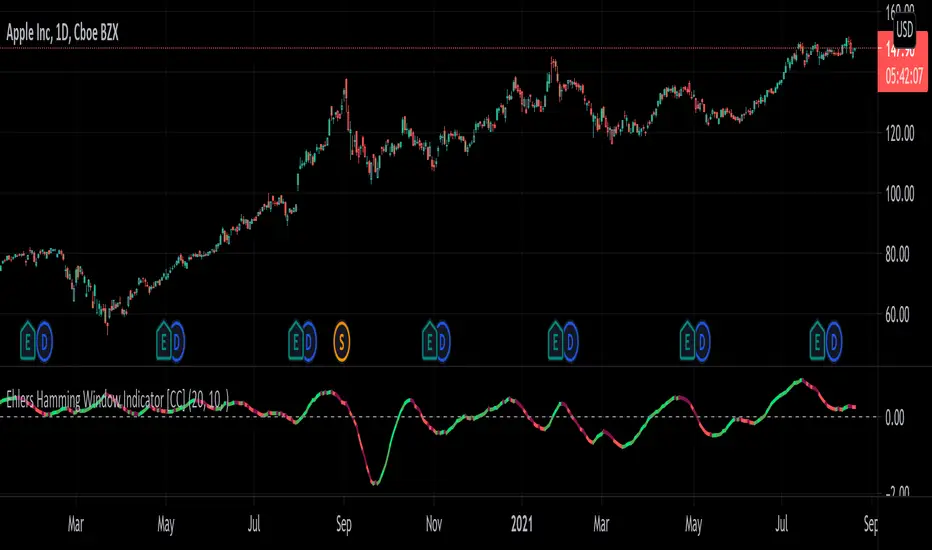
Ehlers Hamming Window Indicator [CC]The Hamming Window Indicator was created by John Ehlers (Stocks and Commodities Sep 2021) and this is one of 4 new indicators that he published in the latest issue of Stocks & Commodities and I will be publishing the other 2 in the next few days. Since these are all part of a series, the idea behind each indicator is the exact same. The only difference is of course the calculation for each indicator. Window functions are used in digital signal processing to filter out noise and the end result is an oscillator that centers around the 0 line. The easy way to understand these indicators that I will be publishing and those are that when they are above 0, it usually means an uptrend and below 0 then a downtrend. For more immediate signals, I have included both normal and strong buy and sell signals so darker colors for strong signals and lighter colors for normal signals. Buy when the line turns green and sell when it turns red.
Let me know if there are any other indicators you would like me to publish!
Ehlers Hann Window Indicator [CC]The Hann Window Indicator was created by John Ehlers (Stocks & Commodities Sep 2021) and this is one of 4 new indicators that he published in the latest issue of Stocks & Commodities and I will be publishing the other 3 in the next few days. Since these are all part of a series, the idea behind each indicator is the exact same. The only difference is of course the calculation for each indicator. Window functions are used in digital signal processing to filter out noise and the end result is an oscillator that centers around the 0 line. The easy way to understand these indicators that I will be publishing and those are that when they are above 0, it usually means an uptrend and below 0 then a downtrend. For more immediate signals, I have included both normal and strong buy and sell signals so darker colors for strong signals and lighter colors for normal signals. Buy when the line turns green and sell when it turns red.
Let me know if there are any other indicators you would like me to publish!

Ehlers Optimum Predictor [CC]The Optimum Predictor was created by John Ehlers (Rocket Science For Traders pgs 209-210) and this indicator does a pretty good job of predicting major market moves. When the blue line crosses over the red line then this indicator is predicting an upcoming uptrend and when the blue line crosses under the red line then it is predicting an upcoming downtrend. Ehlers recommends using this indicator with an entire trading system to filter out any bad signals but most of the signals it gives are pretty accurate. He uses advanced digital signal processing to predict the future prices and uses it in an ema formula for the calculation. There are several ways to interpret this indicator: you can look for crossovers, you can also look for when the indicator goes above 0 for a general uptrend or below 0 for a general downtrend.
Let me know if there are any other scripts you would like to see me publish!

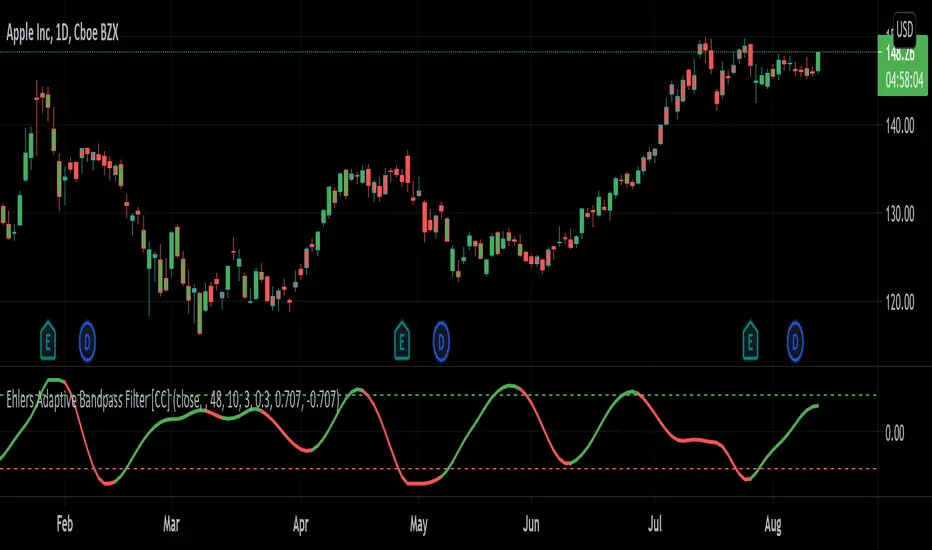
Ehlers Adaptive Bandpass Filter [CC]The Adaptive Bandpass Filter was created by John Ehlers (Cycle Analytics For Traders pgs 153-156) and this uses his autocorrelation code to provide the adaptive lengths to use for the underlying bandpass filter. The bandpass filter is a common way in digital signal processing to filter out the underlying noise in the data. It can actually be turned into a leading indicator by changing the bw variable to a smaller amount. Since this indicator is adaptive using the cycle period, the buy and sell signals are different compared to the normal bandpass filter. Buy signals for this indicator according to Ehlers are when the line is red and the line is under the oversold line (also red) then you buy when the indicator line turns green and then you exit when the indicator line turns red and is above the overbought line. This indicator doesn't provide clear buy and sell signals in all circumstances but generally speaking buy when the indicator line turns green and sell when it turns red. Feel free to experiment with this one.
Let me know if there are any other scripts you would like to see me publish!
Fast Fourier Transform (FFT) FilterDear friends!
I'm happy to present an implementation of the Fast Fourier Transform (FFT) algorithm. The script uses the FFT procedure to decompose the input time series into its cyclical constituents, in other words, its frequency components , and convert it back to the time domain with modified frequency content, that is, to filter it.
Input Description and Usage
Source and Length :
Indicates where the data comes from and the size of the lookback window used to build the dataset.
Standardize Input Dataset :
If enabled, the dataset is preprocessed by subtracting its mean and normalizing the result by the standard deviation, which is sometimes useful when analyzing seasonalities. This procedure is not recommended when using the FFT filter for smoothing (see below), as it will not preserve the average of the dataset.
Show Frequency-Domain Power Spectrum :
When enabled, the results of Fourier analysis (for the last price bar!) are plotted as a frequency-domain power spectrum , where “power” is a measure of the significance of the component in the dataset. In the spectrum, lower frequencies (longer cycles) are on the right, higher frequencies are on the left. The graph does not display the 0th component, which contains only information about the mean value. Frequency components that are allowed to pass through the filter (see below) are highlighted in magenta .
Dominant Cycles, Rows :
If this option is activated, the periods and relative powers of several dominant cyclical components that is, those that have a higher power, are listed in the table. The number of the component in the power spectrum (N) is shown in the first column. The number of rows in the table is defined by the user.
Show Inverse Fourier Transform (Filtered) :
When enabled, the reconstructed and filtered time-domain dataset (for the last price bar!) is displayed.
Apply FFT Filter in a Moving Window :
When enabled, the FFT filter with the same parameters is applied to each bar. The last data point of the reconstructed and filtered dataset is used to build a new time series. For example, by getting rid of high-frequency noise, the FFT filter can make the data smoother. By removing slowly evolving low-frequency components (including non-periodic constituents), one can reveal and analyze shorter cycles. Since filtering is done in real-time in a moving window (similar to the moving average), the modified data can potentially be used as part of a strategy and be subjected to other technical indicators.
Lowest Allowed N :
Indicates the number of the lowest frequency component used in the reconstructed time series.
Highest Allowed N :
Indicates the number of the highest frequency component used in the reconstructed time series.
Filtering Time Range block:
Specifies the time range over which real-time FFT filtering is applied. The reason for the presence of this block is that the FFT procedure is relatively computationally intensive. Therefore, the script execution may encounter the time limit imposed by TradingView when all historical bars are processed.
As always, I look forward to your feedback!
Also, leave a comment if you'd be interested in the tutorial on how to use this tool and/or in seeing the FFT filter in a strategy.

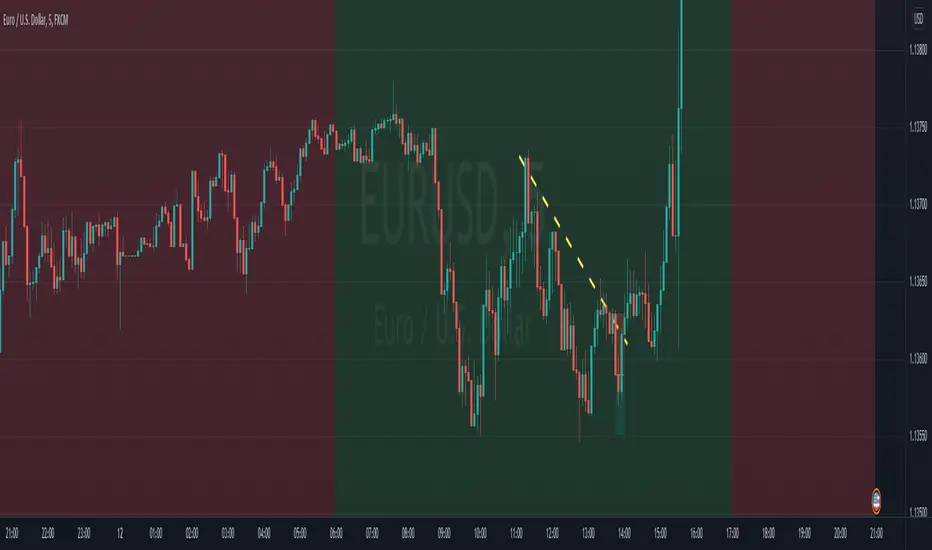
Daily SeasonalityDay trading trend filter indicator designed to hep get better entries or exits based on historical opens and closes each hour.
This indicator is NOT designed as an entry or exit signal. The purpose behind it is to give you statistical information about how likely certain times of day are either bullish , bearish or neutral and use that to confirm or reject other trading signals.
For example you might be anticipating a breakout based on your strategy or another indicator but see that the next few days are usually bearish and re-evaluate entering the trade.
The Daily Seasonality indicator calculates the percentage of candles per day of the week that had a higher close than open.
Default settings are:
- a look-back of 52 weeks (1 year).
- extreme bullish ( bright green) above 74%
-extreme bearish ( bright red) below 25%
- bullish (green) above 55%
- bearish (red) below 45%
- neutral (white) exactly 50%
- no trend (gray) 46% - 54%
All of these are updatable via the settings.
This indicator is designed to work only on the Daily timeframe.

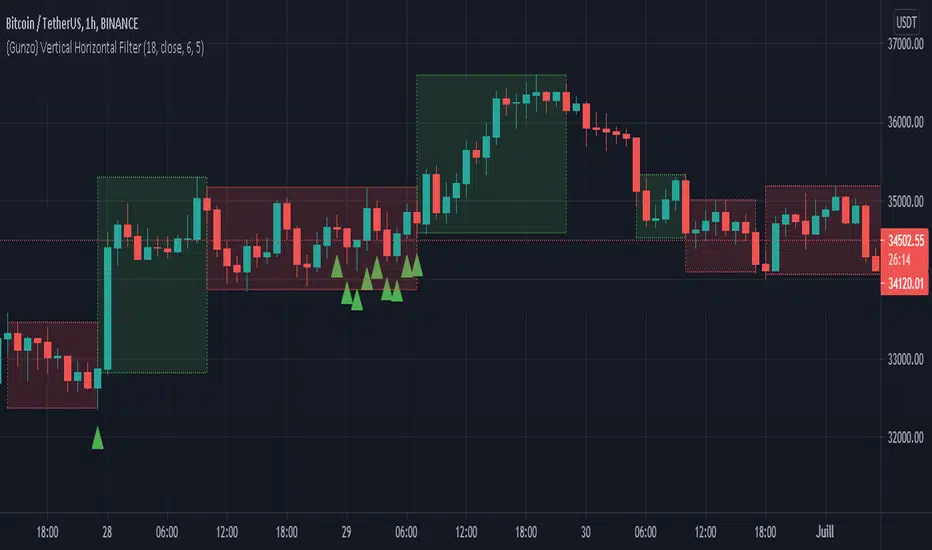
{Gunzo} Vertical Horizontal Filter (Trading ranges)Vertical Horizontal Filter indicator is a tool that can be used to identify market conditions (ranging or trending). It measures if the price is going vertical (uni-directional) or horizontal (non-directional).
OVERVIEW :
The Vertical Horizontal Filter is a technical analysis indicator created by Adam White in 1991. He described it in the “Issues of Futures” magazine for the first time. The indicator is only composed of one line that measures the level of trend activity.
If the VHF line is increasing, we consider that the trend is getting stronger (up-trend or down-trend). Otherwise, if the VHF line is decreasing, we consider that the trend is weakening (going sideways or even ranging) as the market is getting calmer
CALCULATION :
The level of trend activity is calculated as the ratio between the distance from the highest to the lowest value (on the last N days) and the movement of the closing price.
VHF = ( highest (high) – lowest (low) ) / sum( close – previous close)
SETTINGS :
VHF length : Length of the vertical horizontal filter (28 or 18 recommended)
VHF source : Source of the vertical horizontal filter (close recommended)
VHF smoothing length : Extra smoothing applied on the VHF line to filter noise (1 or 6 or 9 or 14 recommended)
Display ranging market rectangles : Display rectangles on the chart around the area where VHF is decreasing (ranging market)
Display trending market rectangles : Display rectangles on the chart around the area where VHF is increasing (trending market up or down)
Minimum rectangle size : Hide rectangles that are smaller than X candles
Display signal line : Display circles at the bottom of the chart with the raw VHF direction (green if increasing /red if decreasing)
Display VHF tops and bottoms : Display triangles if the VHF line is reaching a new high or new low over the last 100 candles. When consecutive triangles appear, it may be a sign that the current market conditions are ending. Green triangles mean the possible end of the ranging market and red triangles mean the possible end of the trending market.
VISUALIZATIONS :
This indicator has 3 possible visualizations :
Rectangles : the rectangles are drawn on areas where the VHF is decreasing (red) or increasing (green) for a minimum number of consecutive candles. The first candles of an area may not be representative of the market conditions as the VHF line is still in extreme values but going slowly in the opposite direction. The market conditions (ranging or trending) get stronger with the VHF line keeping the same direction.
Signal line : The signal line is the VHF raw data : the red circle is a decreasing VHF line, and the green circle is an increasing VHF line.
Tops and bottoms : The tops and bottoms are signals indicating that the VHF line is reaching extreme values, there is a high probability that the market conditions are going to change after that.
USAGE :
This indicator can be used as a filter for strategies based on other technical analysis indicators.
If you are using trending indicators like moving averages, you should consider using them only when the market is trending. You can use VHF increasing to confirm that the market is not ranging.
If you are using oscillating indicators like stochastic or commodity channel index, you may prefer using them when the market is ranging as trending indicators may not be useful. You can use the VHF decreasing to confirm that the market is ranging.
Ehlers Distance Coefficient Filter [CC]The Distance Coefficient Filter was created by John Ehlers and this is one of his more unknown moving averages. It works well because in an uptrend or downtrend it behaves more like a trailing stop system but it also deals with issues like pullbacks pretty quickly. I think it works well with the default values but let me know if you find a more profitable system. Buy when the indicator turns green and sell when it turns red.
Let me know if there are any other indicators you would like to see me publish!

Volume, Momentum and Volatility weighted moving averageMoving averages are filters on price data. This moving average creates a filter which factors in:
- the price RSI or it's Momentum
- the volume RSI
- the RVI or Volatility
Each factor is put through a least squares filter to smooth them first.
Then the factors are used to build a coefficient for an exponentially weighted average.
The chart above shows a comparison of standard average types with this script.
This is useful if you are looking for a moving average based trigger and do not wish to react to candle noise price action.

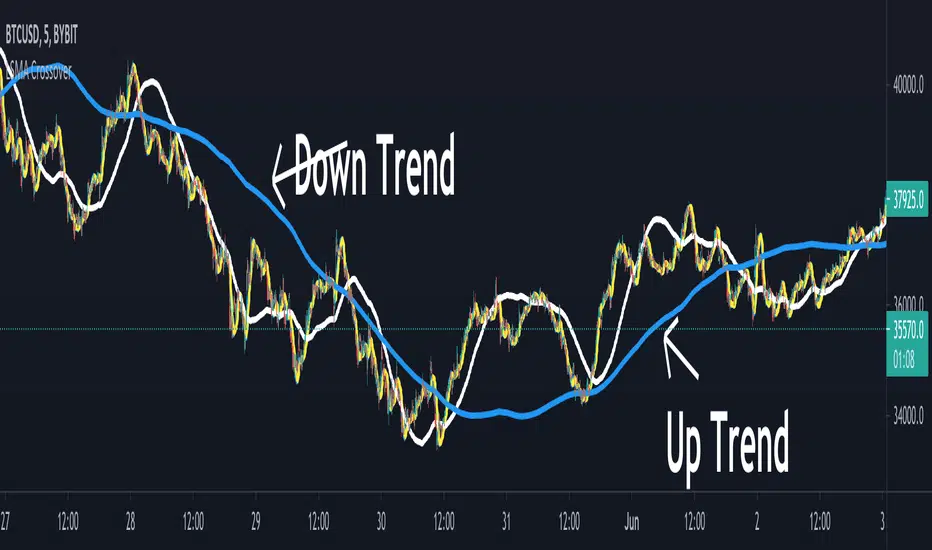
LSMA CrossoverThis is a simple script designed to help filter out bad trades. LSMA is a trend king and by using the 21,200 and 1000 length lines traders can get a clear view of where price action is travelling. This indicator is the perfect companion to the LSMA Wave Rider indicator. Once a pullback is discovered (price action crosses under blue or white line) Traders can use LSMA Wave Rider to locate perfect entry point.
Least Squares Moving Average follows these rules:
When price crosses over it signals a bull trend.
When price crosses under it signals bear trend.
When price stays close or on the line sideways action is to be expected.
The direction of the line shows the direction of the trend.
Here is an example of finding good trades. Price action pulls below white or blue line.
Another example of what a pullback looks like.
This example shows how to find trend using crossovers.
Another example how trend can be found but by using line direction.
LSMA Wave Rider can be found here: