High Breakout PRO Huy Hoang Trader
High Breakout PRO - Strategy Description
## 🚀 Overview
**High Breakout PRO** is a professional-grade Trend Following strategy designed to capture major market moves while strictly managing risk. Built on the core philosophy of "Price Action Breakouts," this script enhances the classic Donchian Channel breakout method with modern risk management tools like the **Hybrid Exit** and **EMA Trend Filter**.
This strategy is optimized for **Gold (XAUUSD)**, **Bitcoin (BTC)**, and **Major Stocks (AAPL, AMZN)** on **H4 and Daily** timeframes.
## 💎 Key Features
1. **Trend Filter (EMA):** Only takes long positions when the price is above the 200-period EMA. This filters out counter-trend noise and significantly improves winning probability.
2. **Hybrid Exit Mechanism ("Holy Grail"):** A unique dynamic trailing stop that combines:
* **Price Structure:** Uses the lowest low of the last Y bars (Donchian Support).
* **Volatility:** Uses ATR-based trailing (Chandelier Exit logic).
* *Logic:* The system automatically chooses the **tighter** (higher) stop level between the two, ensuring you lock in profits rapidly during strong volatility while giving the trade room to breathe during accumulation.
3. **Professional Visuals:** A refined "Wealth & Earth" themes (Gold/Silver/Brown) specifically designed to reduce eye strain and provide clear, professional signal visibility without chart clutter.
## 🛠 Strategy Logic
### entry rules
* **Breakout:** Price closes above the Highest High of the last `X` bars (Default: 20).
* **Trend Confirmation:** Closing Price > EMA 200 (Configurable).
### Exit Rules
* **Dynamic Stop Loss:** The trade is closed when price breaches the **Hybrid Trailing Stop**.
* The Trailing Stop never moves down. It only moves up as price increases.
* It effectively adapts to both slow-grinding trends and explosive spikes.
## ⚙️ Best Settings (Recommended)
* **Timeframe:** H4 (Swing Trading) or Daily (Position Trading).
* **Entry Period (X):** 20
* **Exit Period (Y):** 10
* **Trend Filter:** ON (EMA 200)
* **Risk Management:** Hybrid Mode (ATR Multiplier 3.0)
## ⚠️ Disclaimer
This strategy follows trends. It may experience drawdowns during choppy/sideways markets. Always use proper risk management (position sizing) and backtest on your specific asset before live trading.
---
*Developed by Huy Hoang Trader. Empowering traders with institutional-grade tools.*
Contact for work: www.facebook.com
Following

High Breakout PRO - Huy Hoang Trader
# High Breakout PRO - Huy Hoang Trader - Strategy Description
## 🚀 Overview
**High Breakout PRO** is a professional-grade Trend Following strategy designed to capture major market moves while strictly managing risk. Built on the core philosophy of "Price Action Breakouts," this script enhances the classic Donchian Channel breakout method with modern risk management tools like the **Hybrid Exit** and **EMA Trend Filter**.
This strategy is optimized for **Gold (XAUUSD)**, **Bitcoin (BTC)**, and **Major Stocks (AAPL, AMZN)** on **H4 and Daily** timeframes.
## 💎 Key Features
1. **Trend Filter (EMA):** Only takes long positions when the price is above the 200-period EMA. This filters out counter-trend noise and significantly improves winning probability.
2. **Hybrid Exit Mechanism ("Holy Grail"):** A unique dynamic trailing stop that combines:
* **Price Structure:** Uses the lowest low of the last Y bars (Donchian Support).
* **Volatility:** Uses ATR-based trailing (Chandelier Exit logic).
* *Logic:* The system automatically chooses the **tighter** (higher) stop level between the two, ensuring you lock in profits rapidly during strong volatility while giving the trade room to breathe during accumulation.
3. **Professional Visuals:** A refined "Wealth & Earth" themes (Gold/Silver/Brown) specifically designed to reduce eye strain and provide clear, professional signal visibility without chart clutter.
## 🛠 Strategy Logic
### entry rules
* **Breakout:** Price closes above the Highest High of the last `X` bars (Default: 20).
* **Trend Confirmation:** Closing Price > EMA 200 (Configurable).
### Exit Rules
* **Dynamic Stop Loss:** The trade is closed when price breaches the **Hybrid Trailing Stop**.
* The Trailing Stop never moves down. It only moves up as price increases.
* It effectively adapts to both slow-grinding trends and explosive spikes.
## ⚙️ Best Settings (Recommended)
* **Timeframe:** H4 (Swing Trading) or Daily (Position Trading).
* **Entry Period (X):** 20
* **Exit Period (Y):** 10
* **Trend Filter:** ON (EMA 200)
* **Risk Management:** Hybrid Mode (ATR Multiplier 3.0)
## ⚠️ Disclaimer
This strategy follows trends. It may experience drawdowns during choppy/sideways markets. Always use proper risk management (position sizing) and backtest on your specific asset before live trading.
---
*Developed by Antigravity. Empowering traders with institutional-grade tools.*
Contact for work: www.facebook.com

MA12 x MA80 Bands Signals - JAMMALMA12 × MA80 Bands Signal – Trend Assistant | Jammal
This script provides a clean and simple entry-timing assistant based on the interaction between MA12 and dynamic bands around MA80.
It helps visualize potential trend-based entry points with clear and non-intrusive signals.
The MA80 bands are fully adjustable, allowing you to customize the sensitivity based on the market and timeframe.
Features:
Trend-based entry assistance
MA12 cross with MA80 dynamic bands
Adjustable MA80 bands (user-controlled offset)
Clear triangles, labels, and short horizontal levels
Works on all markets and all timeframes
Helps visualize trend interaction and entry timing
Designed for traders who want a simple, clean, and supportive trading tool.
Supporting tool only – not a complete trading system.
Enjoy and happy trading!
Jammal

AI-Enhanced MSS HunterAI-Enhanced MSS Hunter
This indicator is a hybrid trading system that merges Mechanical Price Action (ICT Concepts) with Statistical Machine Learning (K-Nearest Neighbors). It is designed to assist traders in identifying high-probability reversals after liquidity sweeps, as well as trend-continuation entries during specific "Kill Zone" sessions.
How It Works
The script operates on a strict 3-step validation process to filter out false signals during choppy market conditions.
1. Liquidity Sweep (The Trigger) The system automatically plots the Previous Day High (PDH) and Previous Day Low (PDL).
The logic begins only when price "sweeps" (breaks) one of these key levels.
State Persistence: Once a level is swept, the system remembers this event for the remainder of the session (or until a signal fires), waiting for the market to reverse.
2. Market Structure Shift (The Setup) After a sweep, the indicator hunts for a Market Structure Shift (MSS).
It tracks dynamic Swing Highs and Swing Lows.
A signal is prepared only if price breaks a recent structural swing point in the opposite direction of the sweep (e.g., Sweep PDL -> Break Swing High).
3. AI / Machine Learning Filter (The Confirmation) To reduce false positives, the signal must be confirmed by a K-Nearest Neighbors (KNN) algorithm.
The Logic: The script analyzes the current values of RSI (14), CCI (14), and ROC (10).
The Comparison: It looks back at the last ~1,000 bars of history to find similar market conditions (neighbors).
The Prediction: If the majority of those historical "neighbors" resulted in a favorable move, the AI confirms the trade. If historical data suggests chop or reversal, the signal is blocked.
Key Features
🎯 Primary Reversal Signals (Circles)
Green Circle: Price swept PDL + Bullish MSS + AI Confirmation.
Red Circle: Price swept PDH + Bearish MSS + AI Confirmation.
♻️ Golden Zone Re-Entries (Triangles) Once a Primary Signal is active, the script tracks the new trend leg.
It automatically draws a dynamic Golden Zone (0.5 – 0.618 Fibonacci Retracement).
If price pulls back into this zone and forms a new MSS, a Re-Entry Triangle is plotted.
Invalidation: If the pullback breaks the original setup's low/high, the zone is removed to prevent bad trades.
⏰ Kill Zone Time Filters Signals are filtered by time to ensure you are trading during high-volume sessions.
Default AM Session: 08:30 – 10:00 (New York Time)
Default PM Session: 14:00 – 15:00 (New York Time)
Fully customizable in settings.
Settings Guide
Key Levels: Toggle PDH/PDL lines and customize colors.
Kill Zones: Enable/Disable time filtering and highlight background colors.
AI Settings:
K-Nearest Neighbors (k): Number of historical neighbors to compare (Default: 5).
Training Window: How far back the AI looks for patterns (Default: 1000 bars).
Visuals: Turn on/off the Golden Zone fib clouds or text labels.
Disclaimer
This tool is for educational purposes only. The "AI" component is a statistical classification algorithm based on historical momentum and does not guarantee future results. Always manage risk and use this indicator as part of a comprehensive trading plan.

Smart Money Flow Signals [QuantAlgo]🟢 Overview
The Smart Money Flow Signals indicator synthesizes significant volume-price dynamics through multi-component analysis to identify potential accumulation and distribution phases driven by substantial market participants. It combines Money Flow Index momentum, Chaikin Money Flow accumulation patterns, volume-weighted price momentum, and buying/selling pressure metrics into a unified composite oscillator that quantifies periods of concentrated capital movement, helping traders and investors identify conditions where significant volume participants may be actively positioning across multiple market conditions and timeframes.
🟢 How It Works
The indicator's core methodology lies in its weighted composite approach, where multiple volume-price components are calculated sequentially and then integrated to create a comprehensive significant flow activity signal.
First, the Money Flow Index (MFI) is calculated to measure buying and selling pressure by incorporating volume into price momentum analysis:
raw_money_flow = source * volume
positive_flow = source >= source ? raw_money_flow : 0
negative_flow = source < source ? raw_money_flow : 0
positive_money_flow = math.sum(positive_flow, mfi_period)
negative_money_flow = math.sum(negative_flow, mfi_period)
money_flow_index = 100 - 100 / (1 + positive_money_flow / negative_money_flow)
This creates an RSI-style momentum indicator that tracks whether money (price × volume) is flowing into or out of the asset, with values ranging from 0 to 100 where readings above 50 suggest buying pressure dominance.
Then, Chaikin Money Flow (CMF) is computed to evaluate accumulation and distribution by analyzing where prices close within each bar's range, weighted by volume:
money_flow_multiplier = high != low ? (close - low - (high - close)) / (high - low) : 0
money_flow_volume = money_flow_multiplier * volume
volume_sma = ta.sma(volume, trend_period)
chaikin_money_flow = volume_sma != 0 ? ta.sma(money_flow_volume, trend_period) / volume_sma : 0
Positive CMF values indicate accumulation (closes near the high of the range), while negative values indicate distribution (closes near the low of the range), with volume weighting emphasizing periods of significant participation.
Next, Volume Analysis is performed to quantify current volume intensity relative to historical averages:
volume_average = ta.sma(volume, trend_period)
volume_strength = volume_average != 0 ? volume / volume_average : 1
volume_weight = math.log(volume_strength + 1)
The logarithmic transformation creates a volume weight that amplifies signals during high-volume periods while preventing extreme volume spikes from overwhelming the composite calculation.
Following this, Buy/Sell Pressure is quantified by comparing cumulative volume during bullish versus bearish candles:
buying_pressure = math.sum(volume * (close >= open ? 1 : 0), trend_period)
selling_pressure = math.sum(volume * (close < open ? 1 : 0), trend_period)
pressure_ratio = (buying_pressure - selling_pressure) / (buying_pressure + selling_pressure) * 100
This creates a directional pressure ratio that reveals whether significant participants are predominantly buying or selling, expressed as a percentage between -100 (all selling) and +100 (all buying).
Then, Volume-Weighted Momentum is calculated through an exponential smoothing channel that adjusts price deviation based on volume intensity:
exponential_smooth_average = ta.ema(source, momentum_channel_period)
deviation = ta.ema(math.abs(source - exponential_smooth_average), momentum_channel_period)
channel_index = deviation != 0 ? (source - exponential_smooth_average) / (0.015 * deviation) * (1 + volume_weight * 0.5) : 0
This channel index measures how far price has deviated from its exponential average relative to typical deviation, with the volume weight multiplier (1 + volume_weight * 0.5) amplifying the signal when significant volume accompanies the price movement.
Finally, the Composite Wave is constructed by combining all components with specific weighting to create the final oscillator:
momentum_wave = ta.ema(channel_index, trend_period)
money_flow_wave = (money_flow_index - 50) * 1.2
chaikin_flow_wave = chaikin_money_flow * 100
composite_wave = momentum_wave * 0.5 + chaikin_flow_wave * 0.3 + money_flow_wave * 0.2
smoothed_wave = ta.sma(composite_wave, signal_smoothing)
This creates a multi-dimensional volume flow oscillator that combines price-volume momentum, accumulation-distribution patterns, and buying-selling pressure into a single signal, providing traders with probabilistic insights into periods of concentrated market activity and directional bias based on weighted component convergence.
🟢 Signal Interpretation
▶ Positive Values (Above Zero, Green): Composite money flow above equilibrium indicating net accumulation pressure, positive buying volume dominance, and bullish volume-price alignment = Favorable conditions for long positions, significant capital flowing into the asset = Buy/hold opportunities
▶ Negative Values (Below Zero, Red): Composite money flow below equilibrium indicating net distribution pressure, negative selling volume dominance, and bearish volume-price alignment = Unfavorable conditions for long positions, significant capital flowing out of the asset = Sell/short opportunities
▶ Extreme Overbought Zone: Excessive bullish money flow indicating potential accumulation exhaustion, where buying pressure may have reached unsustainable levels with elevated reversal risk = Caution on new longs, potential distribution phase beginning, profit-taking zone for existing positions
▶ Extreme Oversold Zone: Excessive bearish money flow indicating potential distribution exhaustion, where selling pressure may have reached unsustainable levels with elevated reversal risk = Caution on new shorts, potential accumulation phase beginning, buying opportunity zone for contrarian entries
▶ Smoothed Trend Line (White) Alignment: When the smoothed trend line confirms the composite wave direction, it validates the underlying volume-price trend and filters false signals caused by short-term noise
▶ Volume Intensity Correlation: Gradient intensity (color saturation) reflects combined wave strength, volume participation, and directional alignment, where darker/more saturated colors indicate stronger concentrated activity and higher-probability directional moves
🟢 Features
▶ Preconfigured Presets: Three optimized parameter configurations accommodate different trading styles, timeframes, and market analysis approaches.
1. "Default" provides balanced volume flow measurement suitable for swing trading on 4-hour and daily charts, offering moderate responsiveness to money flow shifts with standard RSI-equivalent MFI period and moderate smoothing for most market conditions.
2. "Fast Response" delivers heightened sensitivity optimized for active intraday trading and scalping on 1-minute to 1-hour charts, using compressed calculation periods across all components and minimal smoothing to capture rapid volume flow changes and quick trend shifts as they develop, ideal for early entry/exit opportunities with acceptance of increased signal frequency during consolidation.
3. "Smooth Trend" offers conservative extreme identification ideal for position trading and long-term analysis on daily to weekly charts, employing extended periods across all money flow components with substantial smoothing to filter short-term noise and isolate only strong, sustained accumulation and distribution phases driven by significant volume participants.
▶ Built-in Alerts: Seven alert conditions enable comprehensive automated monitoring of significant money flow transitions and extreme market states.
1. "Bullish Flow" triggers when the composite wave crosses above zero, signaling the shift from distribution to accumulation and concentrated buying activity beginning.
2. "Bearish Flow" activates when the composite wave crosses below zero, signaling the shift from accumulation to distribution and concentrated selling activity starting.
3. "Any Flow Direction Change" provides a combined notification for either bullish or bearish crossover regardless of direction, useful for general money flow momentum shifts.
4. "Extreme Overbought" alerts when the composite wave reaches or exceeds the overbought threshold (default +60), indicating excessive buying pressure and potential exhaustion.
5. "Extreme Oversold" notifies when the composite wave reaches or falls below the oversold threshold (default -60), indicating excessive selling pressure and potential capitulation.
6. "Overbought Reversal" triggers specifically when the wave crosses back down through the overbought level after being extended, signaling the beginning of distribution from extreme levels.
7. "Oversold Reversal" activates when the wave crosses back up through the oversold level after being extended, signaling the beginning of accumulation from extreme levels.
▶ Color Customization: Six visual themes (Classic, Aqua, Cosmic, Ember, Neon, plus Custom) accommodate different chart backgrounds and visual preferences, ensuring optimal contrast and immediate identification of bullish versus bearish volume flow conditions across various devices and screen sizes. Optional bar coloring provides instant visual context of current significant volume activity intensity and direction without switching between the price pane and indicator pane, enabling traders and investors to immediately assess volume-price positioning dynamics while analyzing price action.

Axis-Pro System | Trend Structure + Fibonacci Pullbacks Axis-Pro System is a comprehensive Trend Following strategy designed to trade high-probability pullbacks. Unlike indicators that merely chase price, this system patiently waits for market structure alignment before seeking an entry.
The system is built on the premise of "Quality over Quantity", utilizing volatility and structure filters to avoid choppy markets (ranges) and false breakouts.
🧠 Strategy Logic
The system makes decisions based on a strict 4-step hierarchy:
Higher Timeframe (HTF) Bias:
Analyzes the trend on a higher timeframe to ensure we are trading in the direction of the dominant flow.
Structure & BOS (Break of Structure):
Identifies clear impulses that break previous highs or lows. Once a BOS is confirmed, the system "arms" the trade and waits.
Fibonacci Zone Pullback:
It does not chase the breakout. Instead, it waits for a pullback into the "Discount Zone" (Golden Zone, configurable between 0.382 and 0.618) to improve the Risk/Reward ratio.
Validation & Trigger:
Uses an ATR expansion check to filter out low-volatility periods.
Requires candle confirmation and alignment with fast EMAs before pulling the trigger.
🛡️ Risk Management
The system incorporates advanced position management using a split execution model (50/50):
Dynamic Stop Loss: Automatically calculated using an ATR multiplier or the recent Swing High/Low (whichever offers better protection).
TP1 (Take Profit 1): Closes 50% of the position at a fixed R-multiple (e.g., 1.5R) to lock in profit and moves the Stop Loss to Break-Even.
TP2 (Runner): The remaining 50% is left to run for higher targets (e.g., 3.0R) or until the trend bends, maximizing gains during strong moves.
Trailing Stop: Optional feature to trail price with a fast EMA once the first target is hit.
⚙️ Settings & Features
The script is highly customizable for different assets (Crypto, Forex, Indices):
Date Range Filter: Includes a date selector to perform precise Backtesting on specific periods (e.g., testing specifically during a Bear Market vs. Bull Market).
Auto Trendlines: Automatically draws relevant trendlines for visual support.
Quality Filters: Options to toggle the EMA 200 filter and breakout buffers.
⚠️ Disclaimer
This strategy is a tool for analysis and backtesting purposes. Past performance does not guarantee future results. It is highly recommended to test the strategy on a Demo account first and adjust parameters according to the volatility of the specific asset being traded. Always use responsible risk management.

Bar-Close Confirmed SupertrendOverview
This indicator is a Supertrend-style trend follower that confirms direction changes only after a bar closes. Trend flips are determined using the previous bar’s close relative to the bands, which helps avoid intrabar changes during live candles.
How it works
Computes ATR (Average True Range)
Builds upper/lower bands using ATR and a multiplier
Updates trend direction only when a prior candle confirms a break of the band
Confirmation logic (bar-close based)
Trend direction is updated using conditions based on the previous candle, such as:
close > upper → confirm uptrend
close < lower → confirm downtrend
Because signals are confirmed on the prior bar, trend changes and markers are displayed only when confirmation exists.
Signals
Uptrend confirmation: prior candle closes above the upper band → bullish marker
Downtrend confirmation: prior candle closes below the lower band → bearish marker
Inputs
ATR Length (default 10)
ATR Multiplier (default 3.0)
Notes
This script is intended for bar-close workflows. Behavior and responsiveness may differ across markets and timeframes depending on volatility and chosen settings.

Quality-Controlled Trend StrategyOverview
This strategy demonstrates a clean, execution-aware trend framework with fully isolated risk management.
Entry conditions and risk logic are intentionally separated so risk parameters can be adjusted without altering signal behavior.
All calculations are evaluated on confirmed bars to ensure backtest behavior reflects real-time execution.
Design intent
Many scripts mix entries and exits in ways that make results fragile or misleading.
This strategy focuses on structural clarity by enforcing:
confirmed-bar logic only
fixed and transparent risk handling
consistent indicator calculations
one position at a time
It is intended as a baseline framework rather than an optimized system.
Trading logic (high level)
Trend context
EMA 50 vs EMA 200 defines directional bias
Entry
Price alignment with EMA 50
RSI used as a momentum confirmation, not as an overbought/oversold signal
Risk management
Stop-loss based on ATR
Fixed risk–reward structure
Risk logic is isolated from entry logic
Editing risk without affecting signals
All stop-loss and take-profit calculations are handled in a dedicated block.
Users can adjust:
ATR length
stop-loss multiplier
risk–reward ratio
without modifying entry conditions.
This allows controlled experimentation while preserving signal integrity.
Usage notes
Results vary by market, timeframe, and volatility conditions.
This script is provided for testing and educational purposes and should be validated across multiple symbols and forward-tested before use in live environments.

LogTrend Retest EngineLogTrend Retest Engine (LTRE)
LogTrend Retest Engine (LTRE) is an advanced trend-continuation overlay designed to identify high-probability breakout retests using logarithmic regression , volatility-adjusted deviation bands , and market regime filtering .
Unlike traditional channels or moving averages, LTRE models price behavior in log space , allowing it to adapt naturally to exponential market moves common in crypto, indices, and long-term trends.
🔹 How It Works
Logarithmic Regression Core
Performs linear regression on log-transformed price and time
Produces a structurally accurate trend midline that scales with price growth
Volatility-Adjusted Deviation Bands
Dynamic upper and lower zones based on statistical deviation
ATR weighting expands or contracts bands as volatility changes
Adaptive Lookback (Optional)
Automatically adjusts regression length using volatility pressure
Faster response in high-volatility environments, smoother in consolidation
🔹 Market Regime Detection
LTRE actively filters conditions using:
R² trend strength (trend quality, not just slope)
Volatility compression vs expansion
User-defined minimum trend strength threshold
Signals are disabled during ranging or low-quality conditions .
🔹 Breakout → Retest Signal Logic
LTRE does not chase breakouts.
Signals trigger only when:
1. Price breaks cleanly outside the deviation band
2. Market regime is confirmed as trending
3. Price performs a controlled retest within a user-defined tolerance
BUY
Break above upper band → retest → trend confirmed
SELL
Break below lower band → retest → trend confirmed
This structure is designed to reduce false breakouts and late entries.
🔹 Visual & Projection Tools
Clean midline and deviation bands
Optional filled zones
Optional future trend projection for forward structure planning
On-chart statistics for trend strength and volatility compression
🔹 Best Use Cases
Trend continuation & pullback strategies
Crypto, Forex, Indices, and equities
Works best on 15m and higher timeframes
⚠️ Disclaimer
LTRE is a decision-support tool , not a complete trading system. Always use proper risk management and confirm signals with additional structure, volume, or higher-timeframe context.
Built for traders who wait for structure — not noise.

EDUVEST UTBOT ADJ - Adaptive ATR Trailing StopEDUVEST UTBOT ADJ - Adaptive ATR Trailing Stop with Session-Based Sensitivity
━━━━━━━━━━━━━━━━━━━━━━━━━━━━━━━━━━━━━━━━━━━━━━━━
█ ORIGINALITY
This indicator is an enhanced version of the classic UT Bot concept, featuring automatic session-based ATR sensitivity adjustment. Unlike the original UT Bot which uses a fixed sensitivity value, this version dynamically adapts to different trading sessions (Tokyo, London, New York) and automatically detects asset characteristics to optimize signal generation.
━━━━━━━━━━━━━━━━━━━━━━━━━━━━━━━━━━━━━━━━━━━━━━━━
█ WHAT IT DOES
- Generates BUY and SELL signals based on ATR trailing stop crossovers with a moving average
- Automatically adjusts sensitivity based on current trading session (Tokyo/London/NY)
- Auto-detects asset type and applies optimized parameters for each instrument
- Displays real-time session information and volatility status
- Provides alert functionality with customizable cooldown periods
━━━━━━━━━━━━━━━━━━━━━━━━━━━━━━━━━━━━━━━━━━━━━━━━
█ HOW IT WORKS
【Core Logic: ATR Trailing Stop】
The indicator calculates an ATR-based trailing stop using the formula:
Trailing Stop = Price ± (Sensitivity × ATR)
When price is above the trailing stop and rising, the stop trails below price.
When price is below the trailing stop and falling, the stop trails above price.
【Signal Generation】
- BUY Signal: Price crosses above the trailing stop AND Moving Average crosses above the trailing stop
- SELL Signal: Price crosses below the trailing stop AND Moving Average crosses below the trailing stop
【Session-Based Sensitivity Adjustment】
The indicator adjusts ATR sensitivity based on trading session (JST timezone):
- Tokyo (08:00-15:00): Lower sensitivity (reduced by adjustment value) - typically quieter markets
- London (15:00-23:00): Base sensitivity - moderate volatility
- New York (23:00-08:00): Higher sensitivity (increased by adjustment value) - higher volatility
【Dynamic ATR Adjustment】
When enabled, the indicator compares current ATR to its smoothed average:
- ATR Ratio = Current ATR / SMA(ATR, smoothing period)
- Volatility Multiplier = 1.0 + (Sensitivity × (2.0 - ATR Ratio))
This reduces sensitivity during high volatility (fewer false signals) and increases sensitivity during low volatility (faster response).
【Auto Asset Detection】
The indicator automatically detects the traded instrument and applies optimized parameters:
- Stable pairs (USDJPY, EURUSD, USDCHF): Base sensitivity 1.5-1.8
- Moderate pairs (AUDUSD, USDCAD, EURJPY): Base sensitivity 2.0-2.3
- Volatile pairs (GBPUSD): Base sensitivity 2.8
- Commodities (GOLD/XAUUSD): Base sensitivity 3.5
- Indices (NASDAQ/NAS100): Base sensitivity 4.0
━━━━━━━━━━━━━━━━━━━━━━━━━━━━━━━━━━━━━━━━━━━━━━━━
█ HOW TO USE
【Recommended Settings】
- Timeframe: 15 minutes or higher (15M, 1H, 4H recommended)
- Best performance on: Forex majors, Gold, NASDAQ
- Enable "Auto Asset Detection" for optimized parameters
【Entry Rules】
- BUY: Enter long when green BUY label appears
- SELL: Enter short when pink SELL label appears
【Session Panel】
The top-right panel displays:
- Current trading session (Tokyo/London/NY)
- Volatility status (High Chance/Medium Chance/Caution)
- Mode (AUTO/MANUAL)
【Alert Setup】
1. Enable "Viewer Alert Display" in settings
2. Set cooldown period (default: 15 minutes) to avoid signal spam
3. Create alert with "Any alert() function call" condition
【Important Notes】
- This indicator does not repaint - signals are confirmed at bar close
- Lower timeframes (1M, 5M) may generate excessive signals
- Always use proper risk management and confirm with other analysis
━━━━━━━━━━━━━━━━━━━━━━━━━━━━━━━━━━━━━━━━━━━━━━━━
█ SETTINGS OVERVIEW
🎯 Alert Settings
- Viewer Alert Display: Enable/disable alert labels
- Cooldown Function: Prevent rapid consecutive signals
- Cooldown Time: Minutes between alerts (5-60)
🔧 Dynamic ATR Settings
- Enable Dynamic ATR: Auto-adjust based on volatility
- ATR Period: Calculation period (default: 14)
- ATR Smoothing: Smoothing period for ratio calculation
- Volatility Sensitivity: How much to adjust (0.1-1.0)
🕐 Session ATR Adjustment
- Enable Time Adjustment: Session-based sensitivity
- Show Session Info: Display session panel
📊 Asset Settings
- Auto Asset Detection: Automatically optimize for instrument
- Manual settings available when auto-detection is disabled
━━━━━━━━━━━━━━━━━━━━━━━━━━━━━━━━━━━━━━━━━━━━━━━━
█ CREDITS
Based on the original UT Bot concept by QuantNomad.
Enhanced with session-based adaptation and auto-asset detection by EduVest.
License: Mozilla Public License 2.0

MDZ Strategy v4.2 - Multi-factor trend strategyWhat This Strategy Does
MDZ (Momentum Divergence Zones) v4.2 is a trend-following strategy that enters long positions when multiple momentum and trend indicators align. It's designed for swing trading on higher timeframes (2H-4H) and uses ATR-based position management.
The strategy waits for strong trend confirmation before entry, requiring agreement across five different filters. This reduces trade frequency but aims to improve signal quality.
Entry Logic
A long entry triggers when ALL of the following conditions are true:
1. EMA Stack (Trend Structure)
Price > EMA 20 > EMA 50 > EMA 200
This "stacked" alignment indicates a strong established uptrend
2. RSI Filter (Momentum Window)
RSI between 45-75 (default)
Confirms momentum without entering overbought territory
3. ADX Filter (Trend Strength)
ADX > 20 (default)
Ensures the trend has sufficient strength, not a ranging market
4. MACD Confirmation
MACD line above signal line
Histogram increasing (momentum accelerating)
5. Directional Movement
+DI > -DI
Confirms bullish directional pressure
Exit Logic
Positions are managed with ATR-based levels:
ParameterDefaultDescriptionStop Loss2.5 × ATRBelow entry priceTake Profit6.0 × ATRAbove entry priceTrailing Stop2.0 × ATROptional, activates after entry
The default configuration produces a 1:2.4 risk-reward ratio.
Presets
The strategy includes optimized presets based on historical testing:
PresetTimeframeNotes1H Standard1 HourMore frequent signals2H Low DD2 HourConservative settings3H Optimized3 HourBalanced approach4H Swing4 HourWider stops for swing tradesCustomAnyFull manual control
Select "Custom" to adjust all parameters manually.
Inputs Explained
EMAs
Fast EMA (20): Short-term trend
Slow EMA (50): Medium-term trend
Trend EMA (200): Long-term trend filter
RSI
Length: Lookback period (default 14)
Min/Max: Entry window to avoid extremes
ADX
Min ADX: Minimum trend strength threshold
Risk
Stop Loss ATR: Multiplier for stop distance
Take Profit ATR: Multiplier for target distance
Trail ATR: Trailing stop distance (if enabled)
Session (Optional)
Filter entries by time of day
Recommended OFF for 3H+ timeframes
What's Displayed
Info Panel (Top Right)
Current preset
Trend status (Strong/Wait)
ADX, RSI, MACD readings
Position status
Risk-reward ratio
Stats Panel (Top Left)
Net P&L %
Total trades
Win rate
Profit factor
Maximum drawdown
Chart
EMA lines (20 blue, 50 orange, 200 purple)
Green background during strong uptrend
Triangle markers on entry signals
Important Notes
⚠️ This is a long-only strategy. It does not take short positions.
⚠️ Historical results do not guarantee future performance. Backtests show what would have happened in the past under specific conditions. Markets change, and any strategy can experience drawdowns or extended losing periods.
⚠️ Risk management is your responsibility. The default settings risk 100% of equity per trade for backtesting purposes. In live trading, appropriate position sizing based on your risk tolerance is essential.
⚠️ Slippage and commissions matter. The backtest includes 0.02% commission and 1 tick slippage, but actual execution costs vary by broker and market conditions.
Best Practices
Test on your specific market — Results vary significantly across different instruments
Use appropriate position sizing — Never risk more than you can afford to lose
Combine with your own analysis — No indicator replaces understanding market context
Paper trade first — Validate the strategy matches your trading style before risking capital
Alerts
Two alerts are available:
MDZ Long Entry: Fires when all entry conditions are met
Uptrend Started: Fires when EMA stack first aligns bullish
Methodology
This strategy is based on the principle that trend continuation has better odds than reversal when multiple timeframe momentum indicators agree. By requiring five independent confirmations, it filters out weak setups at the cost of fewer total signals.
The ATR-based exits adapt to current volatility rather than using fixed pip/point targets, which helps the strategy adjust to different market conditions.
Questions? Leave a comment below.

ML-Inspired Adaptive Momentum Strategy (TradingView v6)This strategy demonstrates an adaptive momentum approach using volatility-normalized trend strength. It is designed for educational and analytical purposes and uses deterministic, fully transparent logic compatible with Pine Script v6.
ML-Inspired Concept (Educational Context)
Pine Script cannot train or execute real machine-learning models.
Instead, this strategy demonstrates ML-style thinking by:
Converting price data into features
Normalizing features to account for volatility differences
Producing a bounded confidence score
Applying thresholds for decision making
This is not predictive AI and does not claim forecasting capability.
Strategy Logic
EMA is used to measure directional bias
EMA slope represents momentum change
ATR normalizes the slope (feature scaling)
A clamped score between −1 and +1 is generated
Trades trigger only when the score exceeds defined thresholds
Risk & Execution
Position size capped at 5% equity
Commission and slippage included for realistic testing
Signals are calculated on closed bars only
Purpose
This script is intended to help traders explore adaptive momentum concepts and understand how feature normalization can be applied in systematic trading strategies.

Strategy: HMA 50 + Supertrend SniperHMA 50 + Supertrend Confluence Strategy (Trend Following with Noise Filtering)
Description:
Introduction and Concept This strategy is designed to solve a common problem in trend-following trading: Lag vs. False Signals. Standard Moving Averages often lag too much, while price action indicators can generate false signals during choppy markets. This script combines the speed of the Hull Moving Average (HMA) with the volatility-based filtering of the Supertrend indicator to create a robust "Confluence System."
The primary goal of this script is not just to overlay two indicators, but to enforce a strict rule where a trade is only taken when Momentum (HMA) and Volatility Direction (Supertrend) are in perfect agreement.
Why this combination? (The Logic Behind the Mashup)
Hull Moving Average (HMA 50): We use the HMA because it significantly reduces lag compared to SMA or EMA by using weighted calculations. It acts as our primary Trend Direction detector. However, HMA can be too sensitive and "whipsaw" during sideways markets.
Supertrend (ATR-based): We use the Supertrend (Factor 3.0, Period 10) as our Volatility Filter. It uses Average True Range (ATR) to determine the significant trend boundary.
How it Works (Methodology) The strategy uses a boolean logic system to filter out low-quality trades:
Bullish Confluence: The HMA must be rising (Slope > 0) AND the Close Price must be above the Supertrend line (Uptrend).
Bearish Confluence: The HMA must be falling (Slope < 0) AND the Close Price must be below the Supertrend line (Downtrend).
The "Choppy Zone" (Noise Filter): This is a unique feature of this script. If the HMA indicates one direction (e.g., Rising) but the Supertrend indicates the opposite (e.g., Downtrend), the market is considered "Choppy" or indecisive. In this state, the script paints the candles or HMA line Gray and exits all positions (optional setting) to preserve capital.
Visual Guide & Signals To make the script easy to interpret for traders who do not read Pine Script, I have implemented specific visual cues:
Green Cross (+): Indicates a LONG entry signal. Both HMA and Supertrend align bullishly.
Red Cross (X): Indicates a SHORT entry signal. Both HMA and Supertrend align bearishly.
Thick Line (HMA): The main line changes color based on the trend.
Green: Bullish Confluence.
Red: Bearish Confluence.
Gray: Divergence/Choppy (No Trade Zone).
Thin Step Line: This is the Supertrend line, serving as your dynamic Trailing Stop Loss.
Strategy Settings
HMA Length: Default is 50 (Mid-term trend).
ATR Factor/Period: Default is 3.0/10 (Standard for trend catching).
Exit on Choppy: A toggle switch allowing users to decide whether to hold through noise or exit immediately when indicators disagree.
Risk Warning This strategy performs best in trending markets (Forex, Crypto, Indices). Like all trend-following systems, it may experience drawdown during prolonged accumulation/distribution phases. Please backtest with your specific asset before using it with real capital.

Qullamagi EMA Breakout Autotrade (Crypto Futures L+S)Title: Qullamagi EMA Breakout – Crypto Autotrade
Overview
A crypto-focused, Qullamagi-style EMA breakout strategy built for autotrading on futures and perpetual swaps.
It combines a 5-MA trend stack (EMA 10/20, SMA 50/100/200), volatility contraction boxes, volume spikes and an optional higher-timeframe 200-MA filter. The script supports both long and short trades, partial take profit, trailing MA exits and percent-of-equity position sizing for automated crypto futures trading.
Key Features (Crypto)
Qullamagi MA Breakout Engine – trades only when price is aligned with a strong EMA/SMA trend and breaks out of a tight consolidation range. Longs use: Close > EMA10 > EMA20 > SMA50 > SMA100 > SMA200. Shorts are the mirror condition with all MAs sloping in the trend direction.
Strict vs Loose Modes – Strict (Daily) is designed for cleaner swing trades on 1H–4H (full MA stack, box+ATR and volume filters, optional HTF filter). Loose (Intraday) focuses on 10/20/50 alignment with relaxed filters for more frequent 15m–30m signals.
Volatility & Volume Filters for Crypto – ATR-based box height limit to detect volatility contraction, wide-candle filter to avoid chasing exhausted breakouts, and a volume spike condition requiring current volume to exceed an SMA of volume.
Higher-Timeframe Trend Filter (Optional) – uses a 200-period SMA on a higher timeframe (default: 1D). Longs only when HTF close is above the HTF 200-SMA, shorts only when it is below, helping avoid trading against dominant crypto trends.
Autotrade-Oriented Trade Management – position size as % of equity, initial stop anchored to a chosen MA (EMA10 / EMA20 / SMA50) with optional buffer, partial take profit at a configurable R-multiple, trailing MA exit for the remainder, and an optional cooldown after a full exit.
Markets & Timeframes
Best suited for BTC, ETH and major altcoin futures/perpetuals (Binance, Bybit, OKX, etc.).
Strict preset: 1H–4H charts for classic Qullamagi-style trend structure and fewer fake breakouts.
Loose preset: 15m–30m charts for higher trade frequency and more active intraday trading.
Always retune ATR length, box length, volume multiplier and position size for each symbol and exchange.
Strategy Logic (Quick Summary)
Long (Strict): MA stack in bullish alignment with all MAs sloping up → tight volatility box (ATR-based) → volume spike above SMA(volume) × multiplier → breakout above box high (close or intrabar) → optional HTF close above 200-SMA.
Short: Mirror logic: bearish MA stack, tight box, volume spike and breakdown below box low with optional HTF downtrend.
Best Practices for Crypto
Backtest on each symbol and timeframe you plan to autotrade, including commissions and slippage.
Start on higher timeframes (1H/4H) to learn the behavior, then move to 15m–30m if you want more signals.
Use the higher-timeframe filter when markets are strongly trending to reduce counter-trend trades.
Keep position-size percentage conservative until you fully understand the drawdowns.
Forward-test / paper trade before connecting to live futures accounts.
Webhook / Autotrade Integration
Designed to work with TradingView webhooks and external crypto trading bots.
Alert messages include structured fields such as: EVENT=ENTRY / SCALE_OUT / EXIT, SIDE=LONG / SHORT, STRATEGY=Qullamagi_MA.
Map each EVENT + SIDE combination to your bot logic (open long/short, partial close, full close, etc.) on your preferred exchange.
Important Notes & Disclaimer
Crypto markets are highly volatile and can change regime quickly. Backtest and forward-test thoroughly before using real capital. Higher timeframes generally produce cleaner MA structures and fewer fake breakouts.
This strategy is for educational and informational purposes only and does not constitute financial advice. Trading leveraged crypto products involves substantial risk of loss. Always do your own research, manage risk carefully, and never trade with money you cannot afford to lose.

EMA Cross + RSI + ADX - Autotrade Strategy V2Overview
A versatile trend-following strategy combining EMA 9/21 crossovers with RSI momentum filtering and optional ADX trend strength confirmation. Designed for both cryptocurrency and traditional futures/options markets with built-in stop loss management and automated position reversals.
Key Features
Multi-Market Compatibility: Works on both crypto futures (Bitcoin, Ethereum) and traditional markets (NIFTY, Bank NIFTY, S&P 500 futures, equity options)
Triple Confirmation System: EMA crossover + RSI filter + ADX strength (optional)
Automated Risk Management: 2% stop loss with wick-touch detection
Position Auto-Reversal: Opposite signals automatically close and reverse positions
Webhook Ready: Six distinct alert messages for automation (Entry Buy/Sell, Close Long/Short, SL Hit Long/Short)
Performance Metrics
NIFTY Futures (15min): 50%+ win rate with ADX filter OFF
Crypto Markets: Requires extensive backtesting before live deployment
Optimal Timeframes: 15-minute to 1-hour charts (patience required for higher timeframes)
Strategy Logic
Entry Signals:
LONG: EMA 9 crosses above EMA 21 + RSI > 55 + ADX > 20 (if enabled)
SHORT: EMA 9 crosses below EMA 21 + RSI < 45 + ADX > 20 (if enabled)
Exit Signals:
Opposite EMA crossover (auto-closes current position)
Stop loss hit at 2% from entry price (tracks candle wicks)
Technical Indicators:
Fast EMA: 9-period (short-term trend)
Slow EMA: 21-period (primary trend)
RSI: 14-period with 55/45 thresholds (momentum confirmation)
ADX: 14-period with 20 threshold (trend strength filter - optional)
Market-Specific Settings
Traditional Markets (NIFTY, Bank NIFTY, S&P Futures, Options)
Recommended Settings:
ADX Filter: Turn OFF (less choppy, cleaner trends)
Timeframe: 15-minute chart
Win Rate: 50%+ on NIFTY Futures
Why No ADX: Traditional markets have more institutional participation and smoother price action, making ADX unnecessary
Cryptocurrency Markets (BTC, ETH, Altcoins)
Recommended Settings:
ADX Filter: Turn ON (ADX > 20)
Timeframe: 15-minute to 1-hour
Extensive backtesting required before live trading
Why ADX: Crypto markets are highly volatile and prone to false breakouts; ADX filters low-quality chop
Best Practices
✅ Backtest thoroughly on your specific instrument and timeframe
✅ Use larger timeframes (1H, 4H) for higher quality signals and better risk/reward
✅ Adjust RSI thresholds based on market volatility (try 52/48 for more signals, 60/40 for fewer but stronger)
✅ Monitor ADX effectiveness - disable for traditional markets, enable for crypto
✅ Proper position sizing - adjust default_qty_value based on your capital and instrument price
✅ Paper trade first - test for 2-4 weeks before risking real capital
Risk Management
Fixed 2% stop loss per trade (adjustable)
Stop loss tracks candle wicks for accurate execution
Positions auto-reverse on opposite signals (no manual intervention needed)
0.075% commission built into backtest (adjust for your broker)
Customization Options
All parameters are adjustable via inputs:
EMA periods (default: 9/21)
RSI length and thresholds (default: 14-period, 55/45 levels)
ADX length and threshold (default: 14-period, 20 threshold)
Stop loss percentage (default: 2%)
Webhook Automation
This strategy includes six distinct alert messages for automated trading:
"Entry Buy" - Long position opened
"Entry Sell" - Short position opened
"Close Long" - Long position closed on opposite crossover
"Close Short" - Short position closed on opposite crossover
"SL Hit Long" - Long stop loss triggered
"SL Hit Short" - Short stop loss triggered
Compatible with Delta Exchange, Binance Futures, 3Commas, Alertatron, and other webhook platforms.
Important Notes
⚠️ Crypto markets require extensive backtesting - volatility patterns differ significantly from traditional markets
⚠️ Higher timeframes = better results - 15min works but 1H/4H provide cleaner signals
⚠️ ADX toggle is critical - OFF for traditional markets, ON for crypto
⚠️ Not financial advice - always conduct your own research and use proper risk management
⚠️ Past performance ≠ future results - backtest results may not reflect live trading conditions
Disclaimer
This strategy is for educational and informational purposes only. Trading futures and options involves substantial risk of loss. Always backtest thoroughly, start with paper trading, and never risk more than you can afford to lose. The author assumes no responsibility for any trading losses incurred using this strategy.

EMA + RSI Autotrade Webhook - VarunOverview
The EMA + RSI Autotrade Webhook is a powerful trend-following indicator designed for automated crypto futures trading. This indicator combines the reliability of Exponential Moving Average (EMA) crossovers with RSI momentum filtering to generate high-probability buy and sell signals optimized for webhook integration with crypto exchanges like Delta Exchange, Binance Futures, and Bybit.Key Features
Simple & Effective: Uses proven EMA 9/21 crossover strategy
RSI Momentum Filter: Eliminates low-probability trades in ranging markets
Webhook Ready: Two clean alerts (LONG Entry, SHORT Entry) for seamless automation
Exchange Compatible: Works with Delta Exchange, 3Commas, Alertatron, and other webhook platforms
Zero Lag Signals: Real-time alerts on crossover confirmation
Visual Clarity: Clean chart markers for easy signal identification
How It Works
Entry Signals:
LONG Entry: Triggers when EMA 9 crosses above EMA 21 AND RSI is above 52 (bullish momentum confirmed)
SHORT Entry: Triggers when EMA 9 crosses under EMA 21 AND RSI is below 48 (bearish momentum confirmed)
Technical Components:
Fast EMA: 9-period (tracks short-term price action)
Slow EMA: 21-period (identifies primary trend)
RSI: 14-period (confirms momentum strength)
RSI Long Threshold: 52 (filters weak bullish signals)
RSI Short Threshold: 48 (filters weak bearish signals)
Best Use Cases
Crypto Futures Trading: Bitcoin, Ethereum, Altcoin perpetual contracts
Automated Trading Bots: Integration with Delta Exchange webhooks, TradingView alerts
Timeframes: Optimized for 15-minute charts (works on 5min-1H)
Markets: Trending crypto markets with clear directional moves
Risk Management: Best used with 1-2% stop loss per trade (managed externally)
Webhook Automation Setup
Add indicator to your TradingView chart
Create alerts for "LONG Entry" and "SHORT Entry"
Configure webhook URL from your exchange (Delta Exchange, Binance, etc.)
Use alert message: Entry LONG {{ticker}} @ {{close}} or Entry SHORT {{ticker}} @ {{close}}
Exchange automatically reverses positions on opposite signals
Advantages
✅ No manual trading required - fully automated
✅ Eliminates emotional trading decisions
✅ Catches trending moves early with EMA crossovers
✅ RSI filter reduces whipsaws in choppy markets
✅ Works 24/7 without monitoring
✅ Simple two-alert system (easy to manage)
✅ Compatible with multiple exchanges via webhooksStrategy Philosophy
This indicator follows a trend-following with momentum confirmation approach. By waiting for both EMA crossover AND RSI confirmation, it ensures you're entering trades with genuine momentum behind them, not just random price noise. The tight RSI thresholds (52/48) keep you aligned with the prevailing trend.Recommended Settings
Timeframe: 15-minute (primary), 5-minute (scalping), 1-hour (swing)
Markets: BTC/USDT, ETH/USDT, high-liquidity altcoin perpetuals
Position Sizing: 100% capital per signal (exchange manages reversals)
Stop Loss: 2% (managed via exchange or external bot)
Leverage: 1-2x for conservative approach, up to 5x for aggressive
Important Notes
⚠️ This indicator generates entry signals only - position reversals are handled automatically by your exchange
⚠️ Always backtest on historical data before live trading
⚠️ Use proper risk management and position sizing
⚠️ Best performance in trending markets; may generate false signals in tight ranges
⚠️ Requires TradingView Premium or higher for webhook functionalityTags
cryptocurrency futures automated-trading ema-crossover rsi webhook delta-exchange tradingview-alerts trend-following momentum bitcoin ethereum crypto-bot algo-trading 15-minute-strategy

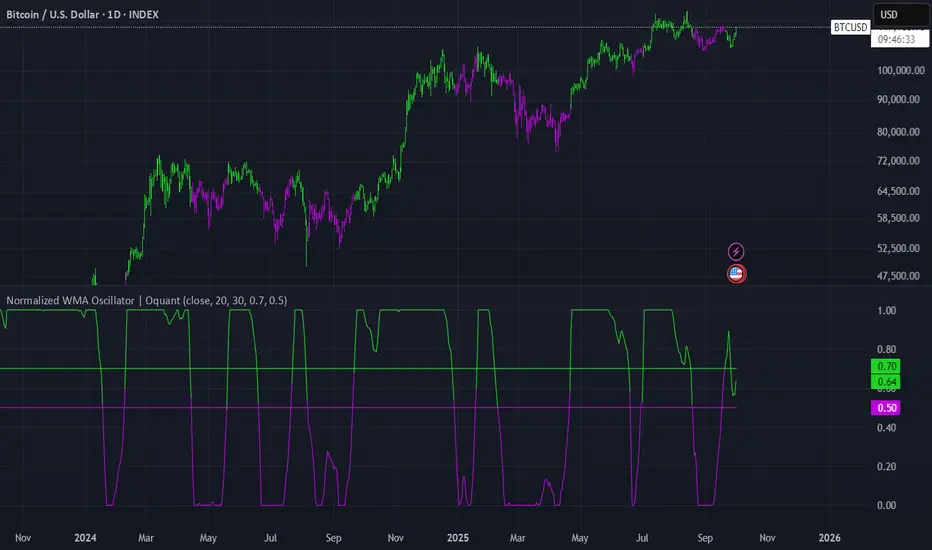
Normalized WMA Oscillator | OquantNormalized WMA Oscillator | Oquant
The Normalized WMA Oscillator is a trend-momentum indicator designed to help traders visualize the relative position of a Weighted Moving Average (WMA) within its recent price range.
What is a WMA and How It Works:
A Weighted Moving Average (WMA) is a type of moving average that gives more weight to recent price data, making it more responsive to price changes compared to a simple moving average. Each price point in the lookback period is multiplied by a weighting factor, with the most recent prices having the highest weights. The WMA helps traders identify potential trends more quickly.
This indicator applies min-max normalization to the standard WMA, scaling its values between 0 and 1 over a configurable lookback period. This allows traders to see whether the WMA is near its recent highs, lows, or midpoint, regardless of the absolute price level.
Key Features:
WMA Source Input: Choose price source for wma calculation.
Customizable WMA Length: Adjust the sensitivity of the WMA.
Min-Max Normalization Length: Smooth the scaling of WMA values between 0 and 1.
Signal Thresholds: Configurable upper and lower thresholds to indicate potential entries.
Visual Alerts: Color-coded oscillator and candles plot for bullish (green) and bearish (purple) signals.
Alerts Ready: Built-in alert conditions for crossovers and crossunders of the oscillator.
How It Works:
Calculate the WMA on the selected source.
Normalize its value using the minimum and maximum WMA values over the specified lookback period.
Generate long signals when the normalized WMA moves above the upper threshold, and short signals when it moves below the lower threshold.
Plot the oscillator and candles in green for bullish signals and purple for bearish signals.
Inputs:
Source: Data used for WMA calculation.
WMA Length: Period for Weighted Moving Average.
Min-Max Length: Lookback period for min-max scaling.
Upper Threshold: Level above which a long signal is considered.
Lower Threshold: Level below which a short signal is considered.
⚠️ Disclaimer: This indicator is intended for educational and informational purposes only. Trading/investing involves risk, and past performance does not guarantee future results. Always test and evaluate indicators/strategies before applying them in live markets. Use at your own risk.
Bollinger Adaptive Trend Navigator [QuantAlgo]🟢 Overview
The Bollinger Adaptive Trend Navigator synthesizes volatility channel analysis with variable smoothing mechanics to generate trend identification signals. It uses price positioning within Bollinger Band structures to modify moving average responsiveness, while incorporating ATR calculations to establish trend line boundaries that constrain movement during volatile periods. The adaptive nature makes this indicator particularly valuable for traders and investors working across various asset classes including stocks, forex, commodities, and cryptocurrencies, with effectiveness spanning multiple timeframes from intraday scalping to longer-term position analysis.
🟢 How It Works
The core mechanism calculates price position within Bollinger Bands and uses this positioning to create an adaptive smoothing factor:
bbPosition = bbUpper != bbLower ? (source - bbLower) / (bbUpper - bbLower) : 0.5
adaptiveFactor = (bbPosition - 0.5) * 2 * adaptiveMultiplier * bandWidthRatio
alpha = math.max(0.01, math.min(0.5, 2.0 / (bbPeriod + 1) * (1 + math.abs(adaptiveFactor))))
This adaptive coefficient drives an exponential moving average that responds more aggressively when price approaches Bollinger Band extremes:
var float adaptiveTrend = source
adaptiveTrend := alpha * source + (1 - alpha) * nz(adaptiveTrend , source)
finalTrend = 0.7 * adaptiveTrend + 0.3 * smoothedCenter
ATR-based volatility boundaries constrain the final trend line to prevent excessive movement during volatile periods:
volatility = ta.atr(volatilityPeriod)
upperBound = bollingerTrendValue + (volatility * volatilityMultiplier)
lowerBound = bollingerTrendValue - (volatility * volatilityMultiplier)
The trend line direction determines bullish or bearish states through simple slope comparison, with the final output displaying color-coded signals based on the synthesis of Bollinger positioning, adaptive smoothing, and volatility constraints (green = long/buy, red = short/sell).
🟢 Signal Interpretation
Rising Trend Line (Green): Indicates upward direction based on Bollinger positioning and adaptive smoothing = Potential long/buy opportunity
Falling Trend Line (Red): Indicates downward direction based on Bollinger positioning and adaptive smoothing = Potential short/sell opportunity
Built-in Alert System: Automated notifications trigger when bullish or bearish states change, allowing you to act on significant development without constantly monitoring the charts
Candle Coloring: Optional feature applies trend colors to price bars for visual consistency
Configuration Presets: Three parameter sets available - Default (standard settings), Scalping (faster response), and Swing Trading (slower response)

RSI Trend Navigator [QuantAlgo]🟢 Overview
The RSI Trend Navigator integrates RSI momentum calculations with adaptive exponential moving averages and ATR-based volatility bands to generate trend-following signals. The indicator applies variable smoothing coefficients based on RSI readings and incorporates normalized momentum adjustments to position a trend line that responds to both price action and underlying momentum conditions.
🟢 How It Works
The indicator begins by calculating and smoothing the RSI to reduce short-term fluctuations while preserving momentum information:
rsiValue = ta.rsi(source, rsiPeriod)
smoothedRSI = ta.ema(rsiValue, rsiSmoothing)
normalizedRSI = (smoothedRSI - 50) / 50
It then creates an adaptive smoothing coefficient that varies based on RSI positioning relative to the midpoint:
adaptiveAlpha = smoothedRSI > 50 ? 2.0 / (trendPeriod * 0.5 + 1) : 2.0 / (trendPeriod * 1.5 + 1)
This coefficient drives an adaptive trend calculation that responds more quickly when RSI indicates bullish momentum and more slowly during bearish conditions:
var float adaptiveTrend = source
adaptiveTrend := adaptiveAlpha * source + (1 - adaptiveAlpha) * nz(adaptiveTrend , source)
The normalized RSI values are converted into price-based adjustments using ATR for volatility scaling:
rsiAdjustment = normalizedRSI * ta.atr(14) * sensitivity
rsiTrendValue = adaptiveTrend + rsiAdjustment
ATR-based bands are constructed around this RSI-adjusted trend value to create dynamic boundaries that constrain trend line positioning:
atr = ta.atr(atrPeriod)
deviation = atr * atrMultiplier
upperBound = rsiTrendValue + deviation
lowerBound = rsiTrendValue - deviation
The trend line positioning uses these band constraints to determine its final value:
if upperBound < trendLine
trendLine := upperBound
if lowerBound > trendLine
trendLine := lowerBound
Signal generation occurs through directional comparison of the trend line against its previous value to establish bullish and bearish states:
trendUp = trendLine > trendLine
trendDown = trendLine < trendLine
if trendUp
isBullish := true
isBearish := false
else if trendDown
isBullish := false
isBearish := true
The final output colors the trend line green during bullish states and red during bearish states, creating visual buy/long and sell/short opportunity signals based on the combined RSI momentum and volatility-adjusted trend positioning.
🟢 Signal Interpretation
Rising Trend Line (Green): Indicates upward momentum where RSI influence and adaptive smoothing favor continued price advancement = Potential buy/long positions
Declining Trend Line (Red): Indicates downward momentum where RSI influence and adaptive smoothing favor continued price decline = Potential sell/short positions
Flattening Trend Lines: Occur when momentum weakens and the trend line slope approaches neutral, suggesting potential consolidation before the next move
Built-in Alert System: Automated notifications trigger when bullish or bearish states change, sending "RSI Trend Bullish Signal" or "RSI Trend Bearish Signal" messages for timely entry/exit
Color Bar Candles Option: Optional candle coloring feature that applies the same green/red trend colors to price bars, providing additional visual confirmation of the current trend direction

Smart Structure Breaks & Order BlocksOverview (What it does)
The indicator “Smart Structure Breaks & Order Blocks” detects market structure using swing highs and lows, identifies Break of Structure (BOS) events, and automatically draws order blocks (OBs) from the origin candle. These zones extend to the right and change color/outline when mitigated or invalidated. By formalizing and automating part of discretionary analysis, it provides consistent zone recognition.
Main Components
Swing Detection: ta.pivothigh/ta.pivotlow identify confirmed swing points.
BOS Detection: Determines if the recent swing high/low is broken by close (strict mode) or crossover.
OB Creation: After a BOS, the opposite candle (bearish for bullish BOS, bullish for bearish BOS) is used to generate an order block zone.
Zone Management: Limits the number of zones, extends them to the right, and tracks tagged (mitigated) or invalidated states.
Input Parameters
Left/Right Pivot (default 6/6): Number of bars required on each side to confirm a swing. Higher values = smoother swings.
Max Zones (default 4): Maximum zones stored per direction (bull/bear). Oldest zones are overwritten.
Zone Confirmation Lookback (default 3): Ensures OB origin candle validity by checking recent highs/lows.
Show Swing Points (default ON): Displays triangles on swing highs/lows.
Require close for BOS? (default ON): Strict BOS (close required) vs loose BOS (line crossover).
Use candle body for zones (default OFF): Zones drawn from candle body (ON) or wick (OFF).
Signal Definition & Logic
Swing Updates: Latest confirmed pivots update lastHighLevel / lastLowLevel.
BOS (Break of Structure):
Bullish – close breaks last swing high.
Bearish – close breaks last swing low.
Only one valid BOS per swing (avoids duplicates).
OB Detection:
Bullish BOS → previous bearish candle with lowest low forms the OB.
Bearish BOS → previous bullish candle with highest high forms the OB.
Zones: Bull = green, Bear = red, semi-transparent, extended to the right.
Zone States:
Mitigated: Price touches the zone → border highlighted.
Invalidated:
Bull zone → close below → turns red.
Bear zone → close above → turns green.
Chart Appearance
Swing High: red triangle above bar
Swing Low: green triangle below bar
Bull OB: green zone (border highlighted on touch)
Bear OB: red zone (border highlighted on touch)
Invalid Zones: Bull zones turn reddish, Bear zones turn greenish
Practical Use (Trading Assistance)
Trend Following Entries: Buy pullbacks into green OBs in uptrends, sell rallies into red OBs in downtrends.
Focus on First Touch: First mitigation after BOS often has higher reaction probability.
Confluence: Combine with higher timeframe trend, volume, session levels, key price levels (previous highs/lows, VWAP, etc.).
Stops/Targets:
Bull – stop below zone, partial take profit at swing high or resistance.
Bear – stop above zone, partial take profit at swing low or support.
Parameter Tuning (per market/timeframe)
Pivot (6/6 → 4/4/8/8): Lower for scalping (3–5), medium for day trading (5–8), higher for swing trading (8–14). Increase to reduce noise.
Strict Break: ON to reduce false breaks in ranging markets; OFF for earlier signals.
Body Zones: ON for assets with long wicks, OFF for cleaner OBs in liquid instruments.
Zone Confirmation (default 3): Increase for stricter OB origin, fewer zones.
Max Zones (default 4 → 6–10): Increase for higher volatility, decrease to avoid clutter.
Strengths
Standardizes BOS and OB detection that is usually subjective.
Tracks mitigation and invalidation automatically.
Adaptable: allows body/wick zone switching for different instruments.
Limitations
Pivot-based: Signals appear only after pivots confirm (slight lag).
Zones reflect past balance: Can fail after new events (news, earnings, macro data).
Range-heavy markets: More false BOS; consider stricter settings.
Backtesting: This script is for drawing/visual aid; trading rules must be defined separately.
Workflow Example
Identify higher timeframe trend (4H/Daily).
On lower TF (15–60m), wait for BOS and new OB.
Enter on first mitigation with confirmation candle.
Stop beyond zone; targets based on R multiples and swing points.
FAQ
Q: Why are zones invalidated quickly?
A: Flow reversal after BOS. Adjust pivots higher, enable Strict mode, or switch to Body zones to reduce noise.
Q: What does “tagged” mean?
A: Price touched the zone once = mitigated. Implies some orders in that zone may have been filled.
Q: Body or Wick zones?
A: Wick zones are fine in clean markets. For volatile pairs with long wicks, body zones provide more realistic areas.
Customization Tips (Code perspective)
Zone storage: Currently ring buffer ((idx+1) % zoneLimit). Could prioritize keeping unmitigated zones.
Automated testing: Add strategy.entry/exit for rule-based backtests.
Multi-timeframe: Use request.security() for higher timeframe swings/BOS.
Visualization: Add labels for BOS bars, tag zones with IDs, count touches.
Summary
This indicator formalizes the cycle Swing → BOS → OB creation → Mitigation/Invalidation, providing consistent structure analysis and zone tracking. By tuning sensitivity and strictness, and combining with higher timeframe context, it enhances pullback/continuation trading setups. Always combine with proper risk management.

Gann Swing PointsIndicator Logic
This is a GANN-style swing indicator that classifies bars based on their high/low structure relative to the previous bar.
I strongly encourage you to replay bars on Tradingview using this indicator to get a sense of how it creates pivot (or swing) points
Bar Classification:
Up-Bar (direction: 'up'): Higher High and Higher Low (HH/HL)
Down-Bar (direction: 'down'): Lower High and Lower Low (LH/LL)
Outside-Bar (generates 2 directions):
Green: 'down' then 'up'
Red: 'up' then 'down'
Inside-Bar: No direction generated (HL/LH)
Swing Line Logic
The swing line continues in the current direction until n opposite directions are detected.
n is the "n-direction" parameter (commonly set to 2, so 2 consecutive opposite direction is needed to turn the swing)
When n opposing directions occur, the swing turns, creating a pivot point
Inside bar is ignored, so e.g up-bar -> inside-bar -> up-bar generates "up", "up" direction
A top pivot is formed when the swing turns down
A bottom pivot is formed when it turns up
Note: This swing logic is inherently lagging — it only confirms tops/bottoms after the fact
This swing structure gives the system a clear and noise-resistant way to identify pivot points (swing-points)

DEMA Trend Oscillator Strategy📌 Overview
The DEMA Trend Oscillator Strategy is a dynamic trend-following approach based on the Normalized DEMA Oscillator SD.
It adapts in real-time to market volatility with the goal of improving entry accuracy and optimizing risk management.
⚠️ This strategy is provided for educational and research purposes only.
Past performance does not guarantee future results.
🎯 Strategy Objectives
The main goal of this strategy is to respond quickly to sudden price movements and trend reversals,
by combining momentum-based signals with volatility filters.
It is designed to be user-friendly for traders of all experience levels.
✨ Key Features
Normalized DEMA Oscillator: A momentum indicator that normalizes DEMA values on a 0–100 scale, allowing intuitive identification of trend strength
Two-Bar Confirmation Filter: Requires two consecutive bullish or bearish candles to reduce noise and enhance entry reliability
ATR x2 Trailing Stop: In addition to fixed stop-loss levels, a trailing stop based on 2× ATR is used to maximize profits during strong trends
📊 Trading Rules
Long Entry:
Normalized DEMA > 55 (strong upward momentum)
Candle low is above the upper SD band
Two consecutive bullish candles appear
Short Entry:
Normalized DEMA < 45 (downward momentum)
Candle high is below the lower SD band
Two consecutive bearish candles appear
Exit Conditions:
Take-profit at a risk-reward ratio of 1.5
Stop-loss triggered if price breaks below (long) or above (short) the SD band
Trailing stop activated based on 2× ATR to secure and extend profits
💰 Risk Management Parameters
Symbol & Timeframe: Any (AUDUSD 5M example)
Account size (virtual): $3000
Commission: 0.4PIPS(0.0004)
Slippage: 2 pips
Risk per trade: 5%
Number of trades (backtest):534
All parameters can be adjusted based on broker specifications and individual trading profiles.
⚙️ Trading Parameters & Considerations
Indicator: Normalized DEMA Oscillator SD
Parameter settings:
DEMA Period (len_dema): 40
Base Length: 20
Long Threshold: 55
Short Threshold: 45
Risk-Reward Ratio: 1.5
ATR Multiplier for Trailing Stop: 2.0
🖼 Visual Support
The chart displays the following visual elements:
Upper and lower SD bands (±2 standard deviations)
Entry signals shown as directional arrows
🔧 Strategy Improvements & Uniqueness
This strategy is inspired by “Normalized DEMA Oscillator SD” by QuantEdgeB,
but introduces enhancements such as a two-bar confirmation filter and an ATR-based trailing stop.
Compared to conventional trend-following strategies, it offers superior noise filtering and profit optimization.
✅ Summary
The DEMA Trend Oscillator Strategy is a responsive and practical trend-following method
that combines momentum detection with adaptive risk management.
Its visual clarity and logical structure make it a powerful and repeatable tool
for traders seeking consistent performance in trending markets.
⚠️ Always apply appropriate risk management. This strategy is based on historical data and does not guarantee future results.

Moving Average Shift WaveTrend StrategyMoving Average Shift WaveTrend Strategy
🧭 Overview
The Moving Average Shift WaveTrend Strategy is a trend-following and momentum-based trading system designed to be overlayed on TradingView charts. It executes trades based on the confluence of multiple technical conditions—volatility, session timing, trend direction, and oscillator momentum—to deliver logical and systematic trade entries and exits.
🎯 Strategy Objectives
Enter trades aligned with the prevailing long-term trend
Exit trades on confirmed momentum reversals
Avoid false signals using session timing and volatility filters
Apply structured risk management with automatic TP, SL, and trailing stops
⚙️ Key Features
Selectable MA types: SMA, EMA, SMMA (RMA), WMA, VWMA
Dual-filter logic using a custom oscillator and moving averages
Session and volatility filters to eliminate low-quality setups
Trailing stop, configurable Take Profit / Stop Loss logic
“In-wave flag” prevents overtrading within the same trend wave
Visual clarity with color-shifting candles and entry/exit markers
📈 Trading Rules
✅ Long Entry Conditions:
Price is above the selected MA
Oscillator is positive and rising
200-period EMA indicates an uptrend
ATR exceeds its median value (sufficient volatility)
Entry occurs between 09:00–17:00 (exchange time)
Not currently in an active wave
🔻 Short Entry Conditions:
Price is below the selected MA
Oscillator is negative and falling
200-period EMA indicates a downtrend
All other long-entry conditions are inverted
❌ Exit Conditions:
Take Profit or Stop Loss is hit
Opposing signals from oscillator and MA
Trailing stop is triggered
🛡️ Risk Management Parameters
Pair: ETH/USD
Timeframe: 4H
Starting Capital: $3,000
Commission: 0.02%
Slippage: 2 pips
Risk per Trade: 2% of account equity (adjustable)
Total Trades: 224
Backtest Period: May 24, 2016 — April 7, 2025
Note: Risk parameters are fully customizable to suit your trading style and broker conditions.
🔧 Trading Parameters & Filters
Time Filter: Trades allowed only between 09:00–17:00 (exchange time)
Volatility Filter: ATR must be above its median value
Trend Filter: Long-term 200-period EMA
📊 Technical Settings
Moving Average
Type: SMA
Length: 40
Source: hl2
Oscillator
Length: 15
Threshold: 0.5
Risk Management
Take Profit: 1.5%
Stop Loss: 1.0%
Trailing Stop: 1.0%
👁️ Visual Support
MA and oscillator color changes indicate directional bias
Clear chart markers show entry and exit points
Trailing stops and risk controls are transparently managed
🚀 Strategy Improvements & Uniqueness
In-wave flag avoids repeated entries within the same trend phase
Filtering based on time, volatility, and trend ensures higher-quality trades
Dynamic high/low tracking allows precise trailing stop placement
Fully rule-based execution reduces emotional decision-making
💡 Inspirations & Attribution
This strategy is inspired by the excellent concept from:
ChartPrime – “Moving Average Shift”
It expands on the original idea with advanced trade filters and trailing logic.
Source reference:
📌 Summary
The Moving Average Shift WaveTrend Strategy offers a rule-based, reliable approach to trend trading. By combining trend and momentum filters with robust risk controls, it provides a consistent framework suitable for various market conditions and trading styles.
⚠️ Disclaimer
This script is for educational purposes only. Trading involves risk. Always use proper backtesting and risk evaluation before applying in live markets.
