Footprint IQ Pro [TradingIQ]Hello Traders!
Introducing "Footprint IQ Pro"!
Footprint IQ Pro is an all-in-one Footprint indicator with several unique features.
Features
Calculated delta at tick level
Calculated delta ratio at tick level
Calculated buy volume at tick level
Calculated sell volume at tick level
Imbalance detection
Stacked imbalance detection
Stacked imbalance alerts
Value area and POC detection
Highest +net delta levels detection
Lowest -net delta levels detection
CVD by tick levels
Customizable values area percentage
The image above thoroughly outlines what each metric in the delta boxes shows!
Metrics In Delta Boxes
"δ:", " δ%:", " ⧎: ", " ◭: ", " ⧩: "
δ Delta (Difference between buy and sell volume)
δ% Delta Ratio (Delta as a percentage of total volume)
⧎ Total Volume At Level (Total volume at the price area)
◭ Total Buy Volume At Level (Total buy volume at the price area)
⧩ Total Sell Volume At Level (total sell volume at the price area)
Each metric comes with a corresponding symbol.
That said, until you become comfortable with the symbol, you can also turn on the descriptive labels setting!
The image above exemplifies the feature.
The image above shows Footprint IQ's full power!
Additionally, traders with an upgraded TradingView plan can make use of the "1-Second" feature Footprint IQ offers!
The image above shows each footprint generated using 1-second volume data. 1-second data is highly granular compared to 1-minute data and, consequently, each footprint is exceptionally more accurate!
Imbalance Detection
Footprint IQ pro is capable of detecting user-defined delta imbalances.
The image above further explains how Footprint IQ detects imbalances!
The imbalance percentage is customizable in the settings, and is set to 70% by default.
Therefore,
When net delta is positive, and the positive net delta constitutes >=70% of the total volume, a buying imbalance will be detected (upwards triangle).
When net delta is negative, and the negative net delta constitutes >=70% of the total volume, a buying imbalance will be detected (downwards triangle).
Stacked Imbalance Detection
In addition to imbalance detection, Footprint IQ Pro can also detect stacked imbalances!
The image above shows Footprint IQ Pro detecting stacked imbalances!
Stacked imbalances occur when consecutive imbalances at sequential price areas occur. Stacked imbalances are generally interpreted as significant price moves that are supported by volume, rather than a significant result with disproportionate effort.
The criteria for stacked imbalance detection (how many imbalances must occur at sequential price areas) is customizable in the settings.
The default value is three. Therefore, when three imbalances occur at sequential price areas, golden triangles will begin to print to show a stacked imbalance.
Additionally, traders can set alerts for when stacked imbalances occur!
Highest +Delta and Highest -Delta Levels
In addition to being a fully-fledged Footprint indicator, Footprint IQ Pro goes one step further by detecting price areas where the greater +Delta and -Delta are!
The image above shows price behavior near highest +Delta price areas detected by Footprint IQ!
These +Delta levels are considered important as there has been strong interest from buyers at these price areas when they are traded at.
It's expected that these levels can function as support points that are supported by volume.
The image above shows a similar function for resistance points!
Blue lines = High +Delta Detected Price Areas
Red lines = High -Delta Detected Price Areas
Value Area Detection
Similar to traditional volume profile, Footprint IQ Pro displays the value area per bar.
Green lines next to each footprint show the value area for the bar. The value area % is customizable in the settings.
CVD Levels
Footprint IQ Pro is capable of storing historical volume delta information to provide CVD measurements at each price area!
The image above exemplifies this feature!
When this feature is enabled, you will see the CVD of each price area, rather than the net delta!
And that's it!
Thank you so much to TradingView for offering the greatest charting platform for everyone to create on!
If you have any feature requests you'd like to see for Footprint IQ, please feel free to share them with us!
Thank you!
Footprintchart

Volatility Footprint CandlesVolatility Footprint is an innovative volume profile indicator that dynamically adapts to real-time market conditions, providing traders with a powerful tool to visualize and interpret market structure, order flow, and potential areas of support and resistance.
At its core, Volatility Footprint combines the concepts of market profile, volume analysis, and volatility measurement to create a unique and adaptive charting experience. The indicator intelligently adjusts its display based on the current market volatility, ensuring that traders always have a clear and readable chart, regardless of the instrument or timeframe they are analyzing.
The footprint chart is composed of a series of color-coded boxes, each representing a specific price level. The color of the box indicates whether there is a net buying or selling pressure at that level, while the opacity reflects the relative strength of the volume. This intuitive visualization allows traders to quickly identify areas of high and low volume, as well as potential imbalances in order flow.
In addition to the individual box volumes, Volatility Footprint also calculates and displays the cumulative volume delta. This running total of buy and sell volumes across all price levels provides valuable insight into the overall market sentiment and potential trends.
One of the key features of Volatility Footprint is its ability to identify and highlight the Point of Control (POC). The POC represents the price level with the highest volume concentration and serves as a key reference point for potential support or resistance. By drawing attention to this crucial level, the indicator helps traders make more informed decisions about potential entry and exit points.
Volatility Footprint is designed to be highly customizable, allowing traders to tailor the appearance of the footprint chart to their specific preferences. Users can easily modify the colors, opacity, and size of the boxes, labels, and POC marker to enhance readability and clarity.
The indicator's versatility makes it suitable for a wide range of trading styles and strategies. Whether you are a scalper looking for short-term opportunities or a swing trader aiming to identify potential trend reversals, Volatility Footprint can provide valuable insights into market dynamics.
By combining Volatility Footprint with other forms of analysis, such as price action, key levels, and technical indicators, traders can gain a more comprehensive understanding of market behavior and make better-informed trading decisions.
Volatility Footprint's adaptive approach to volume profile analysis sets it apart from traditional fixed-resolution volume profile indicators. By dynamically adjusting to the unique characteristics of each instrument and timeframe, the indicator ensures that traders always have a clear and meaningful representation of market structure and order flow.
Volatility Footprint is a powerful tool that traders can incorporate into their market analysis and decision-making process. By providing a dynamic, visual representation of volume and order flow at different price levels, this indicator offers valuable insights into market structure, sentiment, and potential areas of support and resistance. Let's explore how traders might effectively utilize Volatility Footprint in their trading approach.
1. Identifying Key Levels:
One of the primary uses of Volatility Footprint is to identify key price levels where significant trading activity has occurred. The color-coded boxes allow traders to quickly spot areas of high volume concentration, which may indicate potential support or resistance zones. For example, if a trader notices a cluster of boxes with high opacity at a specific price level, they may interpret this as a strong support or resistance area, depending on the prevailing market context. By paying attention to these key levels, traders can make more informed decisions about potential entry and exit points, as well as placement of stop-loss orders and profit targets.
2. Assessing Market Sentiment:
The cumulative volume delta feature of Volatility Footprint provides traders with a valuable gauge of overall market sentiment. By analyzing the running total of buy and sell volumes across all price levels, traders can gain insight into the dominant market forces at play. If the cumulative delta is significantly positive, it may suggest a bullish sentiment, as buying pressure has been consistently outpacing selling pressure. Conversely, a negative cumulative delta may indicate a bearish sentiment. Traders can use this information to confirm or question their bias and adjust their trading plan accordingly.
3. Confirming Breakouts and Trend Reversals:
Volatility Footprint can be particularly useful in confirming the strength and validity of breakouts and potential trend reversals. When a price level is breached, traders can refer to the footprint chart to assess the volume and order flow characteristics around that level. If the breakout is accompanied by a surge in volume and a clear imbalance between buying and selling pressure, it may suggest a strong and sustainable move. On the other hand, if the volume is relatively low or evenly distributed, the breakout may be less reliable. By using Volatility Footprint to confirm breakouts, traders can make more informed decisions about whether to enter or exit a trade, or to adjust their position size.
4. Detecting Imbalances and Potential Reversals:
Imbalances between buying and selling pressure at specific price levels can often precede significant market moves or reversals. Volatility Footprint makes it easy for traders to spot these imbalances visually. For instance, if a trader observes a price level with a significantly larger number of sell boxes compared to buy boxes, it may indicate a potential exhaustion point for a bullish trend, and a reversal might be imminent. Traders can use this information in conjunction with other technical analysis tools, such as trendlines, moving averages, or momentum oscillators, to identify high-probability trading opportunities.
5. Adapting to Market Conditions:
One of the key strengths of Volatility Footprint is its ability to dynamically adapt to the unique volatility characteristics of different instruments and timeframes. This adaptability ensures that the indicator remains relevant and informative across a wide range of market conditions. Traders can use Volatility Footprint to gauge the relative volatility and volume of a particular instrument or timeframe, and adjust their trading approach accordingly. For example, in a highly volatile market, traders may opt for wider stop-loss levels and smaller position sizes to account for the increased risk.
Incorporating Volatility Footprint into a trading strategy requires a combination of technical analysis, market understanding, and risk management. Traders should use this indicator as part of a comprehensive approach, combining it with other forms of analysis, such as price action, key levels, and technical indicators. By doing so, traders can gain a more complete picture of market dynamics and make better-informed trading decisions.
It's important to note that while Volatility Footprint provides valuable insights, it should not be relied upon as a standalone trading signal. Traders should always consider the broader market context, their risk tolerance, and their overall trading plan when making decisions based on the information provided by this indicator.
In conclusion, Volatility Footprint offers traders a dynamic and visually intuitive way to analyze market structure, volume, and order flow. By identifying key levels, assessing market sentiment, confirming breakouts, detecting imbalances, and adapting to market conditions, traders can leverage this powerful tool to make more informed and confident trading decisions. As with any technical analysis tool, Volatility Footprint should be used in conjunction with sound risk management principles and a well-defined trading strategy to maximize its effectiveness.

Footprint Chart + Volume ProfileFootprint charts provide volume information to candlestick charts. This indicator specifically provides the quantity of Market Orders executed on each side of the Order Book, thereby showing you the number of contracts that had hit the bid or the offer - and it does so on each bar.
In addition, it visualises a Volume Profile for each bar, providing you an even better visualisation, contrasted to that which renders the numbers alone.
This Footprint Chart calculates executed orders by getting the change in volume for every price move and pooling them on their corresponding "tick bucket". Their specific "tick bucket" is calculated on the nearest "tick", the size of which you will provide by setting the "Tick Size/ Increment" to whichever tick size you need .
For instance, volume changes on a price of 10.4 on a 1 tick Footprint Chart will be recorded as part of the nearest whole number(10), while on a 3 tick Footprint Chart, it will be recorded as part of 9 as it is the nearest multiple of 3.
Calculating the "tick bucket" this way is most conservative, however, if you would like it calculated differently — Having the volume changes recorded on the succeeding tick, e.g. Recording 10.4 as 12 on a 3 tick Footprint Chart. Simply set the "Tick Basket Assignment" to "Next Tick", While setting the same to "Previous Tick" records volume changes on the preceding tick. Default is "Nearest Tick".
How to read the Footprint Chart?
This Footprint Chart depicts a portion of the Depth of Market, arranged in such a way that the left side represents the bid, while the right side represents the ask. It is therefore natural that orders hitting the bid (Market Sells) are to be placed on the Left Side of the chart while orders hitting the ask (Market Buys) are to be placed on the Right Side. This way, you can visualise how the current price came to be, as well as observe with the several order flow analysis concepts and ideas you can apply. In summary, numbers on the Left represents Sell Orders and numbers on the Right represents Buy Orders.
If, however, you wish to see only the total volume that transacted within the bar, you may do so by toggling the "Split Buy and Sell" option.
Footprint Chart showing only the total volume:
Furthermore, this chart has its own candles, the width of which can be adjusted accordingly.
Volume Profile
This Footprint Chart offers a Stacked Volume Profile and an Unstacked Volume Profile, the former renders a Volume Profile which compares the buys from the sells, the better to visualise levels of activity, the latter renders a standard Volume Profile which shows the total volume that transacted on a price tick.
The type of Volume Profile that this Footprint Chart renders is similar to that of a Periodic Volume Profile, which renders Volume Profiles for every bar on the chart. Furthermore, the width of each Volume Profile bar of this Footprint Chart is relative to the largest volume transacted on the current session, the session beginning from the point you have opened the Footprint Chart until the 500th bar, capped for optimisational purposes, and shall adjust the session start accordingly once this limit had been reached. The Volume Profile bars' width will therefore change agreeably to each significant volume update, and sized relatively with that of the others.
Optimisation
This Footprint Chart utilises several drawings and calculations for attaining its visuals, the arrangement of which makes it more pleasing and easier to understand. Several optimisations have been implemented within the code, e.g. utilising queues, however, if you wish for it to be even more optimised, you can use an "Unstacked" Volume Profile, using larger tick sizes, as well as using 0 decimal placements for the Footprint Chart.
Furthermore, deselecting "Use Stacked Bars" will allow more boxes to be drawn, and will double the amount of boxes the volume profile can use.
Limitations
No historical tick data have yet been made available for use and so this Footprint Chart only has realtime data at its disposal. Historical footprints are therefore not rendered, the boundary of which is delineated by a vertical broken line.
Tips
This Footprint Chart is best viewed on a chart of its own, and it is therefore ideal to clear the chart of other candles by hiding them or utilising a line chart alternatively . In addition, stretch the time scale to its utmost capacity, the better to see properly the Volume Profile, as well as stretch the price scale to a proper height, the better to read the footprint volumes inscribed on the indicator.
Warnings
Changing settings may cause the Footprint Chart to reset. If, in case you have been accumulating Footprint Charts and wish to change some settings for the benefit of your charting, it is best to take a snapshot of your chart prior, for recent changes may cause resets to occur.

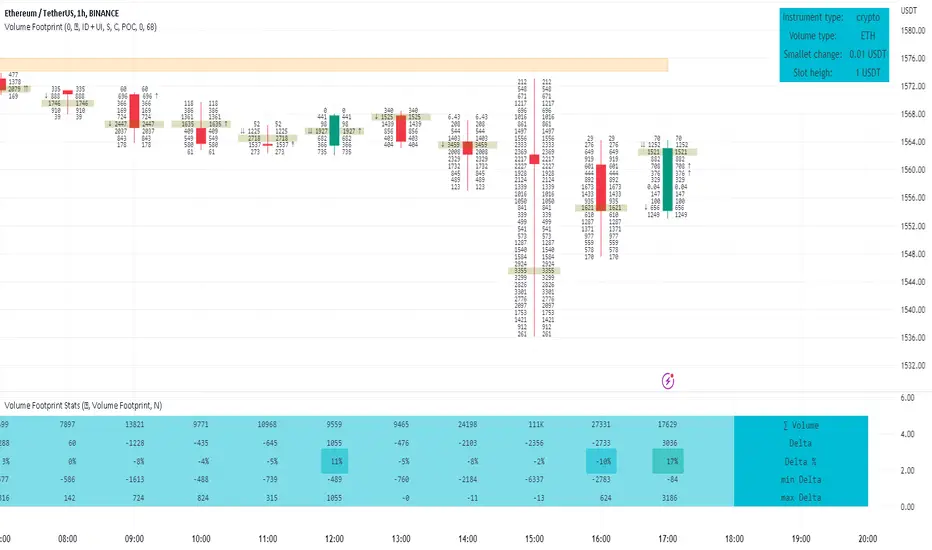
Footprint ClassicThe Volume Footprint chart is analyzing volume data contained within candles and split it into two components - Up and Down volume. This analysis is similar to how Volume Profile evaluates volume data from a portion of the chart.
This script can be used by any user. You do not need to have PRO or PREMIUM account to use it.
As a user, you have the flexibility to select the desired level of data precision for the Volume Footprint analysis. We highly recommend using the highest precision possible, as it provides the most accurate results. However, it's important to keep in mind that Trading View has several limitations and not all levels of precision are available on all intervals. The higher the precision, the shorter the history of available data.
If, after adding the script or changing the precision, you encounter an error message stating "'The study references too many candles in history'", it may be necessary to reduce the precision level in the script settings to resolve the issue.
This script is a part of the "Volume Footprint" toolkit, which includes:
I. Footprint chart visualization scripts in two variants:
⠀⠀Volume Footprint - Presenting volume data on both sides of the candle.
⠀⠀Volume Footprint Classic - Presenting volume data on the right side of the candle.
II. Supporting tools:
⠀⠀Volume Footprint Statistics - Script presents, in tabular form, basic statistics calculated from candle volume data, such as Delta, min Delta, max Delta and more. It can support both Volume Footprint and Volume Footprint Classic.
⠀⠀Volume Footprint Candles - Tool drawing candles adapted for footprint chart scripts.
III. Tools dedicated to more detailed analysis:
⠀⠀Volume Delta - A candle chart illustrating changes in delta values.
⠀⠀Volume Cumulative Delta - A candle chart ilustrating changes in cumulative delta values.
⠀⠀Volume Delta In Candle - A line chart showing changes in delta values over a period equal to the chart interval.
⠀⠀Volume Cumulative Delta in Interval - A line chart showing changes in cumulative delta over a period equal to the chart interval.
Script with limited access, contact author to get authorization
User Interface:
The script groups Up and Down volume into slots based on price. The height of the slots is controlled by the "Slot height" parameter in the settings. Each slot has the following configurable features:
Text - A label that displays the value. You can choose from:
⠀- - Hidden
⠀V - Slot Volume (UP + Down)
⠀V% - Slot volume as percentage of Candle volume
⠀UD - Up and Down volume
⠀UDI - Up and Down volume + Imbalance symbols.
⠀Δ - Delta (Up - Down Volume)
⠀Δ% - Delta as percent of slot volume (from -100% to 100%)
Border - Highlight slots with border color. You can chose from:
⠀- - Hidden
⠀C - Constant color
⠀POC - Slot with biggest volume
⠀V - Slot volume compared to other slots in that candle
⠀VA - Value area, highlights slots forming the value area
⠀Δ - Delta is the slot.
Background - Highlight slots with background color. You can pick one of:
⠀- - Hidden
⠀C - Constant color
⠀POC - Slot with biggest volume
⠀V - Slot volume compared to other slots in that candle
⠀VA - Value area, highlights slots forming the value area
⠀Δ - Delta is the slot.
Imbalances symbols:
Before the Down Volume, the following imbalance symbols may appear:
⠀↓ - 3 times
⠀↡ - 5 times
⠀⇊ - 10 times
After the Up Volume the following imbalance symbols may appear:
⠀↑ - 3 time
⠀↟ - 5 times
⠀⇈ - 10 times
Above the candle, the following basic statistics can be shown:
"V:" - Row with volume statistics:
⠀∑ - Total volume ,
⠀Δ - Difference between Up and Down Volume .
⠀min Δ - The smallest difference between Up and Down Volume in that candle
⠀max Δ - the biggest difference between Up and Down Volume in that candle
Script settings:
Slot height = 10^ - Price slot height on the chart, recorded as a power of 10, which means:
⠀ 0 - 1$
⠀ 1 - 10$
⠀ 2 - 100$
⠀ 3 - 1000$
⠀-1 - 0.1$
⠀-2 - 0.01$
⠀-3 - 0.001$
Data precision - One of 6 standard levels of data precision: ▉▇▆▅▃▁, where ▉ means the highest precision and ▁ the lowest available precision and two special values "W" and "M" dedicated for biggest intervals. The highest precision should be available for 15-minute chart, but for a 1D chart, it may hit TradingView limitations and the script will not be launched by the platform with error: "'The study references too many candles in history'". The general recommendation is to use the highest available precision for a given instrument and interval.
Precise warnings - An option to show warnings about missing volume in candle footprint (warning connected with one of TradingView limitations).
Text - Picking what king of info is on label:
⠀- - Hidden
⠀V - Total slot Volume
⠀V% - Slot volume as % of Candle volume
⠀UD - Up and Down volume
⠀UDI - Up and Down volume + Imbalance symbols.
⠀Δ - Delta
⠀Δ% - Delta as percent of slot volume
Centered - If checked volume labels are stick to candle (centered), if not they are alligned to right.
Border, Background:
⠀- - Hidden
⠀C - Color1
⠀POC - Slot with biggest volume
⠀V - Slot volume compared to other slots in that candle
⠀VA - Value area, highlights the slots forming the value area
⠀Δ - Delta is the slot, color1 is used when volume Up is at least 10% bigger, color2 is used when Volume Down is at least 10% bigger
Filter - Filtering option than allow hinding labels with small values:
⠀0 - filter turned off.
⠀1-5 - filtering with transparency
⠀6-10 - Filtering with hiding values
Show zeros - Option to show zeros or leave empty spaces
Draw candles - Option to draw candles that fit the volume labels, and 2 fields to choose the color of up and down candles. It is recommended to hide chart candles and use candles adapted to the footprint chart. TradingView has a bug and candles are drawn under the slots. If you choose a non-transparent background or border, they may be invisible. If possible (free accounts have a limit of 3 scripts), it is recommended to use Volume Footprint Candles script to draw thin candles over the slots.
Show stats - Showing stats over the candle: ∑, Δ, min Δ, max Δ. It's recommended to use 'Volume Footprint Statistics' script instead
Font size - Used to draw stats over the chart: T(iny), S(mall), N(ormal), L(arge)
Instrument and Volume status - A dialog showing basic chart information: Instrument type, Volume type, Smallest change, slot height.
Value area - Value area is the smallest group set of neighboring slots that have at least n(param) % of candle volume.
⠀ Value Area Minimal Volume (%) - Value area size as % of candle volume
⠀ Track - Option to track value areas, potencial support-resistance zones.
⠀ Only active - Option to hide areas that were crossed by the price.
⠀ Show Values - Opiton to show volume value over tracked value areas.
Alerts:
⠀ One alert per Bar - Emits no more than one alert per bar.
⠀ Add value area to tracking - Emits an alert about a new VA beeing added to the tracking list.
⠀ Remove value area from tracking - Emits an alert when a VA is removed from the tracking list.
Troubleshooting:
In case of any problems, please send error details to the author of the script.
Known issues:
"The study references too many candles in history" - If you encounter this issue, try changing "Data precision" setting to a lower value.

Volume FootprintThe Volume Footprint chart is analyzing volume data from inside the candle and split them into Up and Down Volume in the same way as Volume Profile analyzes the volume data from a fragment of the chart.
The visualization is little different:
Down Volume (sells) are shown on the left side of a candle.
Up Volume (Buys) are shown on the right side of a candle.
User can pick data precision used by Volume Footprint. We recomend to use the highest possible precision.
Unfortunatelly Trading View has many limitations.
If after adding script nothing is visible with error: "'The study references too many candles in history'" you need to use lower precision - It can be changed in script settings.
This script is a part of a toolkit called "Volume Footprint", containing few tools:
Volume Footprint - Scripts drawing Volume Footprint chart.
Volume Footprint Statistics - Script showing table with basic statistics about Up and Down volume inside the candles.
Volume Delta In Candle - Chart showing history of delta (difference between Up and Down volume) changes inside the current candle.
Volume Cumulative Delta - Chart showing history of cumulative delta (sum of difference between Up and Down volume in trading period equal to chart interval).
This script can be used by any user. You do not need to have PRO or PREMIUM account to use it.
Script with limited access, contact author to get authorization
User Interface:
Script is grouping Up and Down Volume into slots based on price. Slots height is controled by "Slot height" param in settings.
On left side of a candle Down Volume is shown and on right side Up Volume is shown.
Before Down Volume may appear imbalance symbols:
⠀↓ - 3 times
⠀↡ - 5 times
⠀⇊ - 10 times
After Up Volume may appear imbalance symbols:
⠀↑ - 3 time
⠀↟ - 5 times
⠀⇈ - 10 times
Above the candle we can show some basic statistics of that candle:
"V:" - Row with volume statistics:
⠀∑ - Total volume,
⠀Δ - Difference between Up and Down Volume.
⠀min Δ - Smallest difference between Up and Down Volume in that candle
⠀max Δ - Biggest difference between Up and Down Volume in that candle
Script settings:
Slot height = 10^ - Price slot height on the chart:
⠀ 0 - 1$
⠀ 1 - 10$
⠀ 2 - 100$
⠀ 3 - 1000$
⠀-1 - 0.1$
⠀-2 - 0.01$
⠀-3 - 0.001$
Data precision - One of 6 levels of data precision: ▉▇▆▅▃▁, where ▉ means the highest precision and ▁ the lowest available precision. On 15 minute chart highest precision should be available, but on 1D it will probably hit TradingView limitations and script will not be even launched by the platform with error: "'The study references too many candles in history'". The general recommendation is to use the highest available precision for a given instrument and interval.
Precise warnings - Option to show precise warnings about missing volume in candle footprint (warning connected with one of TradingView limitations).
Draw candles - Option of drawing candles fiting to volume labels and 2 fields for picking colors of up and down candles. The general recommendation is to hide chart candles and turn on this option.
Show stats - Showing stats over the candle: ∑, Δ, min Δ, max Δ. You can use 'Volume Footprint Statistics' script instead
Font size - Used to draw all the data over the chart: T(iny), S(mall), N(ormal), L(arge)
Centered - If checked volume labels are stick to candle (centered).
Color values - Option to draw labels with use of Up or Down color, depending which value (Volume Up or Volume Down) is bigger in the price slot.
Filter - Filtering option than allow hinding labels with small values:
⠀0 - filter turned off.
⠀1-5 - filtering with transparency
⠀6-10 - Filtering with hiding values.
Show zeros - It can show zeros or leave empty places
Highlight biggest slot - Option to highlight price slot with biggest volume in the candle.
Imbalances - Showing imbalance symbols before Down or after Up Volume
Only over average - Showing imbalances symbols only for volume not smaller than the average value.
Value area - Option to identify group of slots with biggest volume in each candle. A group is a smallest set of neighboring slots that have at least n(param) % of candle volume .
⠀ Value Area Minimal Volume (%) - Value area size as % of candle volume .
⠀ Color - Color of the Value area.
⠀ Show borders - Showing border lines of value areas over the candle.
⠀ Track - Option to track value areas. Potencial Support-Resistance zones.
⠀ Only active - Hide areas that were crossed by the price.
Show Values - Show volume value over tracked value areas.
Troubleshooting:
In case of any problems, send error details to the author of the script.
Known issues:
"The study references too many candles in history" - Change "Data precision" settings to some lower value.
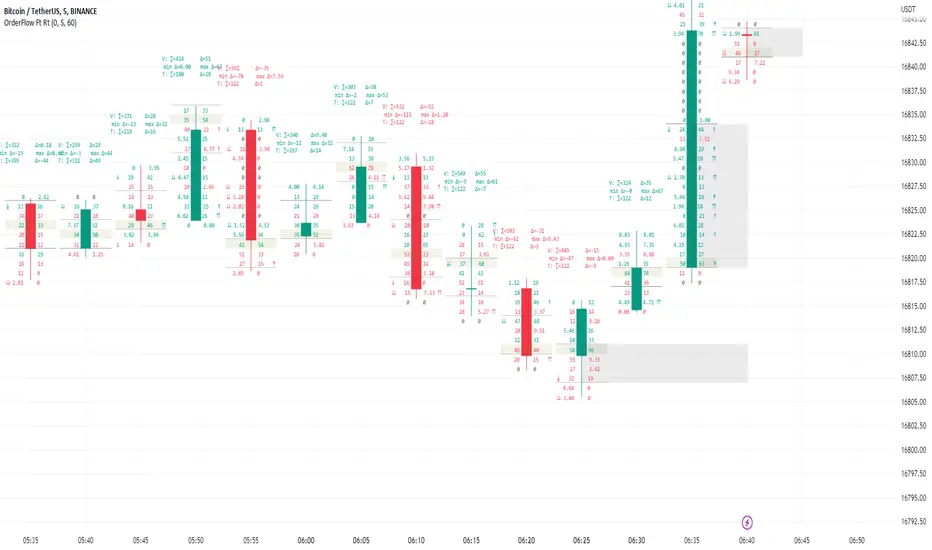
Order Flow Footprint Real-timeOrder Flow Footprint Real-time chart (also known as Cluster chart, bid/ask profile, bid/ask cluster, numbered bars) is a concept of drawing candle internal structure and showing bid and ask transactions inside the candle.
Values on left side of a candle are bids - Transactions done by active sellers with passive buyers.
Values on right side of a candle are asks - Transactions done by active buyers with passive sellers.
This script is a part of a toolkit called "Order Flow":
Order Flow Register - Register showing list of recently done transactions with clasification on bids and asks.
Order Flow Footprint Realtime - Tool showing bid and ask structure of transactions inside realtime candles.
Order Flow Footprint Estimation - Tool showing estimated bid and ask structure based on historical data.
This tool requires frequently updated real-time data to work efficiently. It cannot analyze historic charts. If you need footprint of historic data just use Order Flow Footprint Estimation instead.
Warning !
TradingView has a data delay feature on many exchanges (10-30 minutes) and real-time data are extra paid in that case. Missing real-time data source will limit the functionality of the script to educational purposes only.
User Interface:
Script is drawing volume values grouped into price slots. Price slots height is controled by slot height param in settings.
Volume values are clasified as bids and asks and draw on opposite sides of a candle. On left side of a candle bid volume values are shown and on right side ask volume values are shown.
Before bid values may appear symbols of sellers aggressiveness compared with buyers:
↓ - 3 times
↡ - 5 times
⇊ - 10 times
After ask values may appear symbol of buyers aggressiveness compared with sellers:
↑ - 3 time
↟ - 5 times
⇈ - 10 times
Above the candle we have some statistics of that candle:
"V:" - Row with volume statistics: ∑ - Total volume, Δ - Difference between asks and bids (typically negative in down trend and positive in up trend). Below the smallest and largest delta values recorded during this candle.
"T:" - Row with transaction estimations: ∑ - Estimation of total transactions, Δ - Difference between number of ask and bid transaction estimations
Script settings:
Slot height = 10^ - Price slot height on the chart:
0 - 1$
1 = 10$
2 = 100$
3 = 1000$
-1 = 0.1$
-2 = 0.01$
-3 = 0.001$
Font size - Font size used to draw all the data over the chart: Tiny, Small, Normal, Large
Centered - If checked volume labels are stick to candle
Draw bars - Option of drawing candles fiting to volume labels and 2 fields for picking colors of up and down candles.
Underline biggest slot - Option to underline price slot with biggest volume in the candle.
Color values - Option to draw labels with use of Ask and Bid colors, depending on which value is bigger in the price slot.
Troubleshooting:
In case of any problems, please send error details to the author of the script.
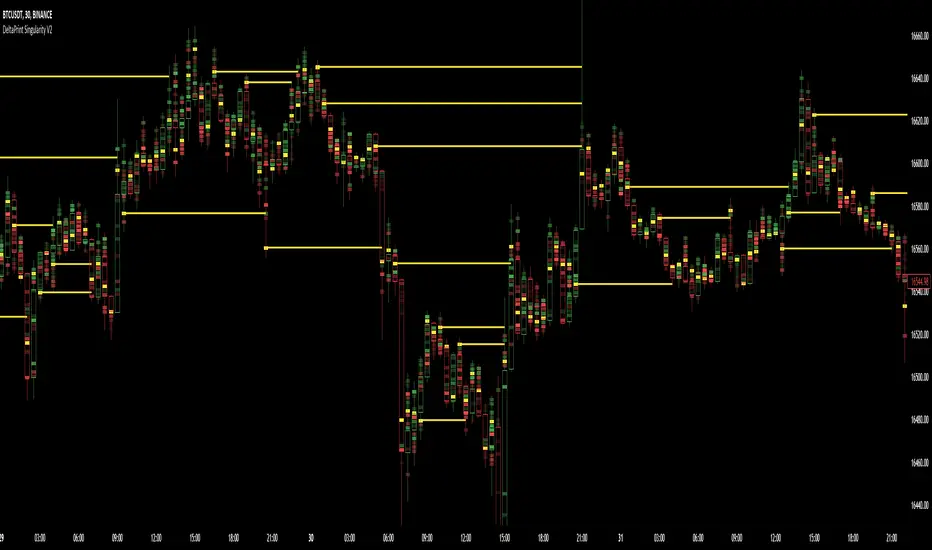
DeltaPrint SingularityDeltaPrint Singularity
DeltaPrint Singularity is a method of bringing a previous DeltaPrint Candles with less granularity but greater historical reference.
The advantages is the ease of use with existing charts and indicators without adjusting for low tf chart for UI Space this is all handled on the same timeframe using intrabar data.
The benefit of such candles is providing users additional data as to location of potentially trapped traders via late entry into positions e.g. late longing a range high or VAH.
Or to provide credence to traders who look for momentum plays seeing momentum drop off likely leading to a period of consolidation or pull back.
The logic used here is different to the previous rendition of the indicator but works well with any and all charts that allow some reference to volume.
This indicator aims to provide users the insight into how traders are positioning and where they are positioning. The indicator comes with a few initial features:
Singular Coloring
Delta Coloring
POC Highlighting
Singular Coloring is useful by providing a minimalist view into volume execution points.
Delta Coloring breaks this down further by providing an estimate into ask:bid (although delta print will be stronger at this)
POC highlighting provides only the volume POC and not Delta POC.
Planned Updates
Delta Weighting
POC Level Extensions
Alerts
Delta Continuum SpaceManBTCDelta Continuum SpaceManBTC
This is a tool that ive made with a brand new code base, to assist traders of all timeframes.
The new version of this tool makes use of the intra data to collect the tick for tick data that can be provided, this allows the provisioning of orderflow on tradingview.
Using a calculation of pure tick data and volume calculations, the display is created allowing the means to display a bid and ask seperation functionality to show the trades taking place in a market.
Taking account for this real time data it can show the exact moments a market participant is taking a trade.
This tool is an advanced way of determining the levels of which point is being interacted with to display the points at which a seller has stepped in to interact with a level, providing additional confluences when taking a trade.
Typically the best use case for this indicator is to see when their is a point of trapped traders in the trade, e.g. late longing resistance or late shorting support. Works best on futures contracts due to the high levels of execution volume in comparison.
Highly recommend dialing the ticksize manually. The ticksize for this indicator is best used manually as it allows for greater consistency when seeing who is participating at what level, as auto ticksize,
focuses on the volatility of the previous candle to display some data for the current candle. Now this will make it easier to use, it can reduce the consistency of the indicator when providing data.
Autoticksize will still be useful and will provide some confluence to the new flow traders.
to generate the data the candle must be the realtime candle and will not generate for historical candles, however this data for the real time candle will be only generated from the exact point in time to which the candle is loaded.
The indicator can show both the bid/ask split but alternatively the user can choose to just show the delta instead for ease of viewing.
TO DO:
Release the ticksize candles, to allow for tickbased charts and not just time based.

Footprint
What is it?
The classic Market Footprint chart for realtime bars (; at least the closest I could get it to anyway).
The tool has 3 modes, which display different volume data for the traded prices of each bar: (1) Up/Down Volume Footprint: At-price Up Volume and At-price Down Volume ; (2) Total Volume Footprint: Total volume transacted at each price; and, (3) Delta Volume Footprint: Difference between At-price Up Volume and At-price Down Volume . You can choose which mode you want from Settings. Each at-price value is color-coded based on its strength/weakness.
Maximum at-price volume for a bar can be chosen to be displayed in a separate color. This will serve (and be shown) as the VPOC ( Volume Point of Control). Note: This is not technically precise as VPOC is a slightly different concept. (But should be the same for most candles).
Below the bars (or above, depending on how you configure it), are displayed the following:(1) Net Delta Volume for the bar; (2) Total Volume for the bar; (3) Cumulative Delta Volume for bars plotted up till this point (i.e., from the time the tool started collecting realtime data); (4) Buy Volume for the bar as a percentage of the total volume for the bar; and, (5) Sell Volume for the bar as a percentage of the total volume for the bar. Each value here is color-coded as well.
In addition, a custom candle option has been provided. These are ON by default and displays 'thinner' candles for, arguably, good readability with Footprint in Up/Down Volume Mode. With custom candles, Tradingview's default candles will be rendered redundant and can be disabled. If you wish to switch to Tradingview's candles, it is recommended that you use either hollow candle mode or bar mode to view the footprint properly. (Filled-body candles will hide the values). Note that with the Footprint chart in either "Total Volume" or "Delta Volume" mode, you are better off using Tradingview's hollow candles or bars.
Almost all labels/colors etc. are configurable to suit your aesthetics.
All data are ONLY AVAILABLE FOR REAL-TIME BARS. The longer you keep a chart open with the study enabled, the more data it collects and displays, and the better your analysis can potentially be. Note that the data gets reset every time (a) any of the options is changed, (b) the market is switched, (c) the browser is refreshed, or (d) the script is reloaded
DATA ISN'T STORED. I.e., every time a new symbol is loaded, the previous symbol's data is lost. So if you intend to monitor a symbol closely, you would need to keep it loaded all the time (and without tinkering with any of the Settings in between).
Who is it for?
For ultra short term traders who are used to looking at short term auction orderflow (and price action) to catch buy/sell anomalies and accurate trade entries
For traders looking to get into footprint chart reading and who wish to give it a go and learn before investing in expensive platforms/tools.
For traders (, irrespective of their method of trading,) who wish to understand what is happening under the hood when a certain price action unfolds.
Who is in control, who got trapped, what does liquidity or the lack thereof look like, etc.
Mode 2: Total Volume Footprint. This also shows how Tradingvoew's hollow candles can be used with the tool.
Mode 3: Delta Volume Footprint

DeltaPrint Candles SpacemanBTCDeltaPrint Candles SpacemanBTC
This is a tool that ive made that will be very useful to all types of traders. Orderflow based or price action based by providing a means to deliver both on tradingview.
Using a calculation of time volume and ticks, the display is created with a bid and ask for display functionality to show the influence of players in the market.
The tool will be a useful way to determine the levels of which a point is interacted with by the number of traders participating at that level.
This will help determine with a statistical representation in numerical form, the number of buyers and sellers being stopped out or trapped at any level specifically key support and resistance areas.
Ticksize is used to determine the amount of data generated, the lower the more information will be provided on the current candle. Using AutoTickSize will do this automatically accounting for recent volatility.
Therefore when using and new, use auto, to switch between charts with ease. On charts that you always keep open it is recommended to manually tune ticksize to your choosing.
To generate the data the candle is show on the left of the footprint in normal candle stick form but then displays the statistical values to the side to show relative participation.
The logic is to provide a better method to show the importance of potential levels, regularly works really well on swing highs and lows/liquidity sweeps.
The indicator also has the ability to show only the delta if that is your preference, the above is to show the full capabilities of generating data.
TO DO:
One more display type, similar to the delta ladder.
Increased Look back period with stacks.
