PSP with Color ThemesEnglish Description
The PSP with Color Themes indicator is a sophisticated tool for detecting price swing divergences between the current trading instrument and a selected reference asset. This indicator implements PSP (Price Swing Divergence) logic to identify moments when price movements between two correlated assets diverge from their typical relationship. Traders can select from multiple professionally designed color themes or customize their own color scheme, with adjustable opacity for optimal chart visibility. The core functionality compares candlestick patterns between the current chart and the reference symbol, highlighting bullish signals when the current asset rises while the reference falls (or vice versa in inverse mode). This divergence detection helps identify potential momentum shifts and trading opportunities before they become apparent in single-asset analysis. The indicator offers flexible configuration including inverse correlation mode for negatively correlated pairs and a clean visual presentation that doesn't clutter the price chart while providing immediate visual cues through colored candlesticks.
Русское описание
Индикатор PSP с цветовыми темами представляет собой продвинутый инструмент для обнаружения дивергенций колебаний цены между текущим торговым инструментом и выбранным эталонным активом. Этот индикатор реализует логику PSP (Price Swing Divergence) для выявления моментов, когда движения цен между двумя коррелирующими активами отклоняются от их типичной взаимосвязи. Трейдеры могут выбирать из нескольких профессионально разработанных цветовых тем или настраивать собственную цветовую схему с регулируемой прозрачностью для оптимальной видимости на графике. Основная функция сравнивает свечные модели между текущим графиком и эталонным символом, выделяя бычьи сигналы, когда текущий актив растет, а эталонный падает (или наоборот в инверсном режиме). Это обнаружение дивергенций помогает выявить потенциальные сдвиги импульса и торговые возможности до того, как они станут очевидными при анализе одного актива. Индикатор предлагает гибкую настройку, включая режим обратной корреляции для отрицательно коррелированных пар, и чистое визуальное представление, которое не загромождает ценовой график, обеспечивая при этом мгновенные визуальные подсказки через окрашенные свечи.
Forex-trading

Session AnchorsDescription
This indicator highlights the four main global trading sessions — London, New York AM, New York PM, and Asia — as color-coded boxes on the chart. Each session is defined by fixed start/end times (New York time) and dynamically updates with the evolving high and low during that interval. This provides a clear view of how volatility and structure shift as trading activity passes from one region to another.
How to use
• Works on any timeframe.
• Toggle sessions on/off based on your trading hours.
• Observe price behavior as one session closes and another opens.
• Use session boxes as context for liquidity, volatility, and structure analysis.
Originality
This script delivers a clean, customizable visualization of global market hours and session ranges, avoiding extra overlays so traders can isolate session-based behavior without distraction.
⚠️ Disclaimer
This indicator does not generate signals. It provides a structural mapping of global sessions for contextual analysis only.


Session P4L SNIPERSsession separator only for the operation of the academy. by its time margin. added the asian range for a power of three

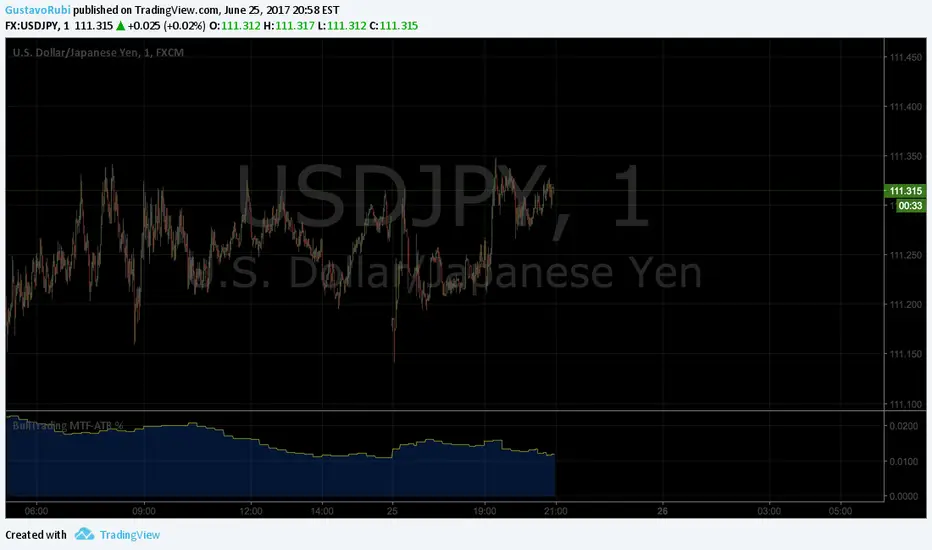
BullTrading MultiTimeFrame ATR %Good afternoon traders.
Have you ever got trapped on the middle of a consolidation? Well, it just happened to me trading the 1 minute chart last friday!
So, I coded this script to display a percentage of ATR for a given resolution.
Now, how can you benefit using this information?
For example:
Using the standard settings (resolution is calibrated 15 minutes in order to trade 1minute charts), just draw your prefered support and resistance. Then measure the number of pips between support and resistance. This number should be approximately the same the indicator is displaying. If the indicator is displaying a lower value, maybe it will be a good idea to tighten your support/resistance levels (if the price goes against you, you will have confidence and probability on your side to open an opposite position and reach your Take profit before a new reversal take place.
Change colors and resolution for your desired timeframe until you find your particular "sweet spot"
Have a nice trading week.