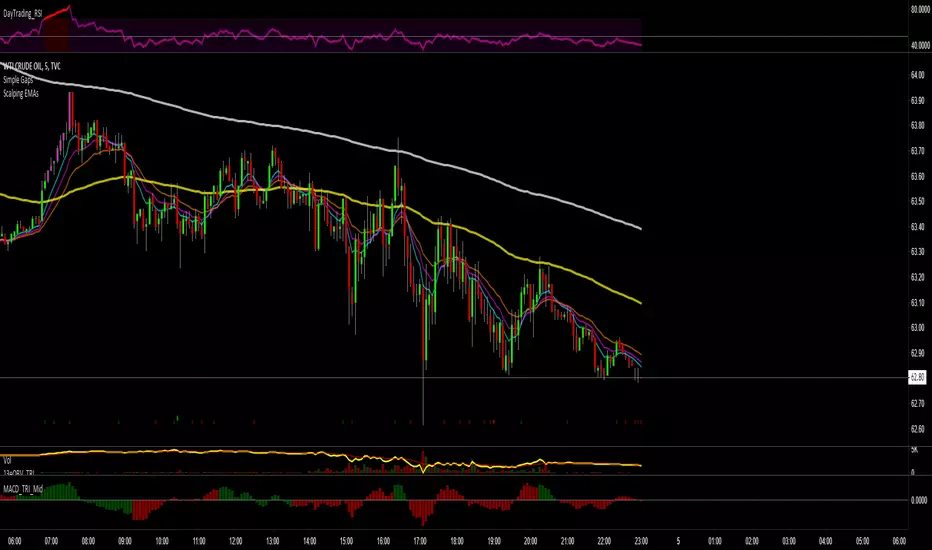
Scalping EMAs for ForexMoving averages for 5m time frame. The 96 and 252 are the 8 and 21 on 1h
Inspired by this simple scalping strategy
Forex
Forex Correlations HeatmapHello friends,
This tool is built for forex traders who want a clean, visual way to understand how currency pairs move together. It builds a color-coded correlation matrix between your current chart symbol and a customizable list of forex pairs, helping you quickly spot strong positive or negative relationships across majors, crosses, and extended FX watchlists.
🛠️ How It Works
You provide a comma-separated watchlist of forex tickers (e.g., EURUSD,USDJPY,GBPUSD,...). The script then:
Filters this list based on your selected Display Mode (All pairs, or only AUD, CAD, CHF, EUR, GBP, JPY, NZD, or USD-related pairs).
Paginates long watchlists into pages of up to 40 tickers , so you can scroll through large FX universes without overloading the chart.
For each pair on the current page, it calculates the Pearson correlation over a user-defined lookback window, using your chosen price source (close, HL2, HLC3, etc. via the custom source selector).
The resulting correlations are plotted as a heatmap: each cell's color and intensity reflect the strength and direction of the relationship.
You can switch between multiple professional color palettes to better match your visual preferences and quickly distinguish strong positive, strong negative, and neutral correlations.
🔥 Key Features
Custom watchlist input via a simple text area (paste or type your pairs)
Pagination support - view up to 40 symbols per page for smoother performance
Flexible Display Modes : All pairs, or focused views like AUD pairs, EUR pairs, USD pairs, etc.
Configurable correlation lookback period
Customizable correlation source via an advanced source selector module
Multiple professional color palettes : Blue/Red, Blue/White/Red, Green/Pink, Green/Red, Green/Yellow/Red, Purple/Orange, Spectral, Viridis
Clear visual mapping of correlation strength and sign through color intensity
👋 Good luck and happy trading!
Skrip berbayar

PpSignal Step Moving AverageStep Moving Average
The indicator calculates the moving average and draws price movement in steps. To some extent, it is similar to a Renko chart, because a new horizontal line is drawn after the prices moves a fixed distance in any direction.

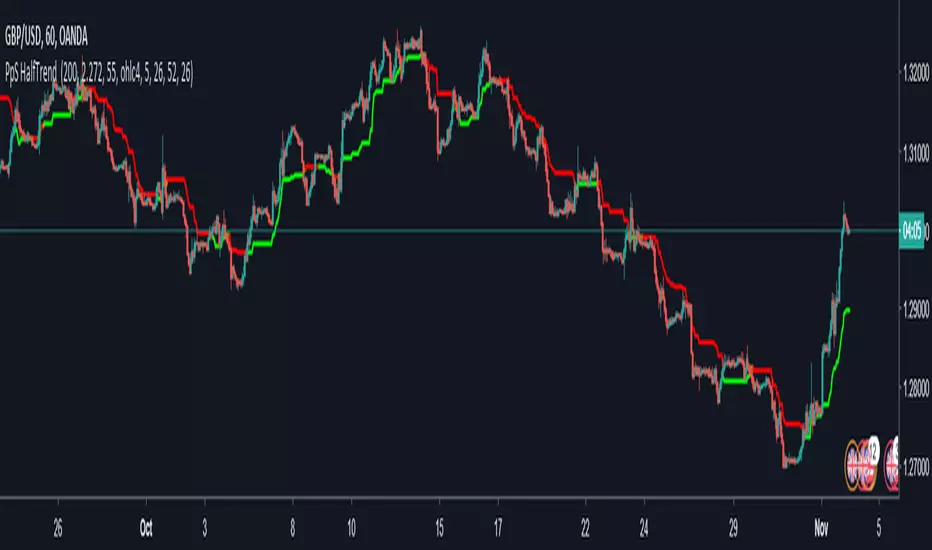
PpSignal HalfTrend 1.18Multi-trend advisor is based on the classic indicators Exponential Moving Average (EMA) with optional parameters and filter to confirm the order opening the indicator Relative Strength Index (RSI) on the signal and selectively EMA. Orders are opened while crossing at a slow fast EMA EMA or vice versa, a confirmation signal filtering.
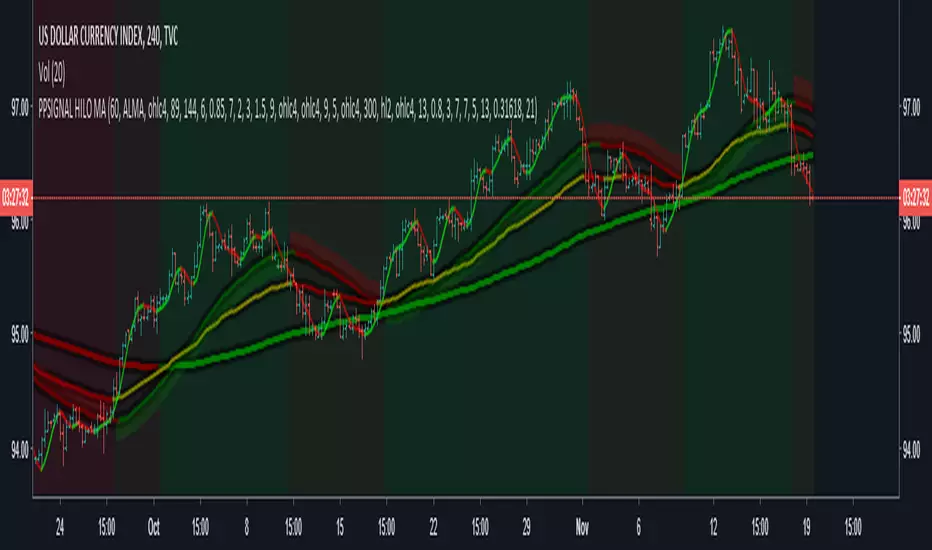
PpSignal HILO MA Trima ATRThis indicator combines Moving Average (MA) and Average True Range (ATR) to visualize potential trade signals

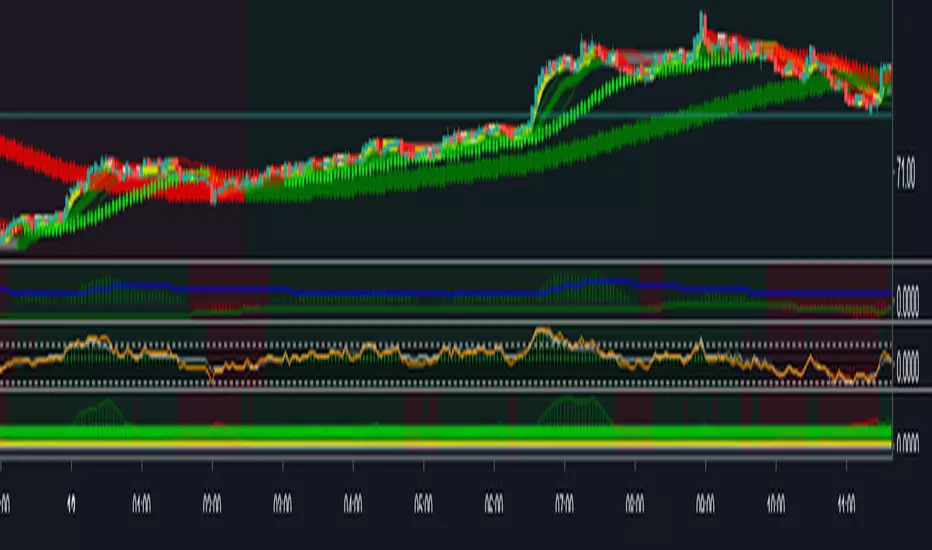
Hades Indicator by ZekisHades Indicator is a good swing indicator based on trends
The base of Hades Indicator is calculated from crossing of two moving averages to establish the trend and another two moving averages for entries and exits or longs and shorts.
The rules are simple: go long when background turns green and exit when turns yellow and go short when backgroun turns red and exit when turns yellow
When background is yellow is not a good idea to jump in
There are 5 moving averages to choose from: DEMA, EMA, SMA, VWMA and WMA
Also you can choose to trade only for Longs, only for Shorts or both
Alerts are added
Enjoy!
@ Zekis

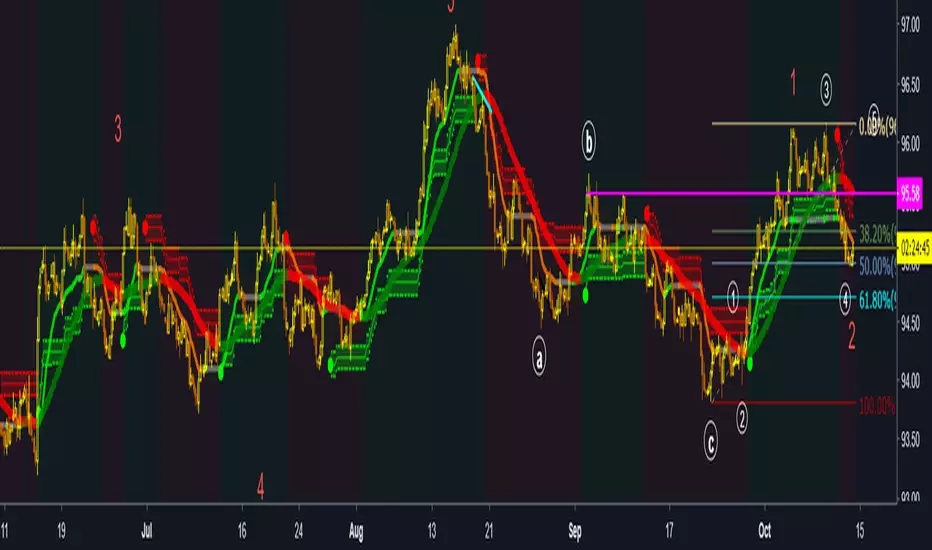
Dionysus Indicator by ZekisDionysus is a good swing indicator with nice results in any timeframe
Easy to use, you need to adjust the lenght for your needs
Percentlines added for Take Profits and Stop Loss for best results (you can change them as you wish)
Yellow line is the transition from long to shot or entries and exits points
Alerts are enabled
Enjoy!
@ Zekis

PpSignal Variable Index Dynamic AverageThe Variable Index Dynamic Average (VIDYA) was developed by Tushar Chande. The calculation of this indicator is analogous to that of the Exponential Moving Average (EMA) with a dynamically adjusted lookback period that depends on relative price volatility. The higher the volatility, the higher the emphasis on price becomes and the faster VIDYA adapts to price changes. Volatility is measured through the Chande Momentum Oscillator (CMO). This indicator can be used as any moving average, to identify and trade trends. Traders often use it in combination with other signals and analysis techniques.

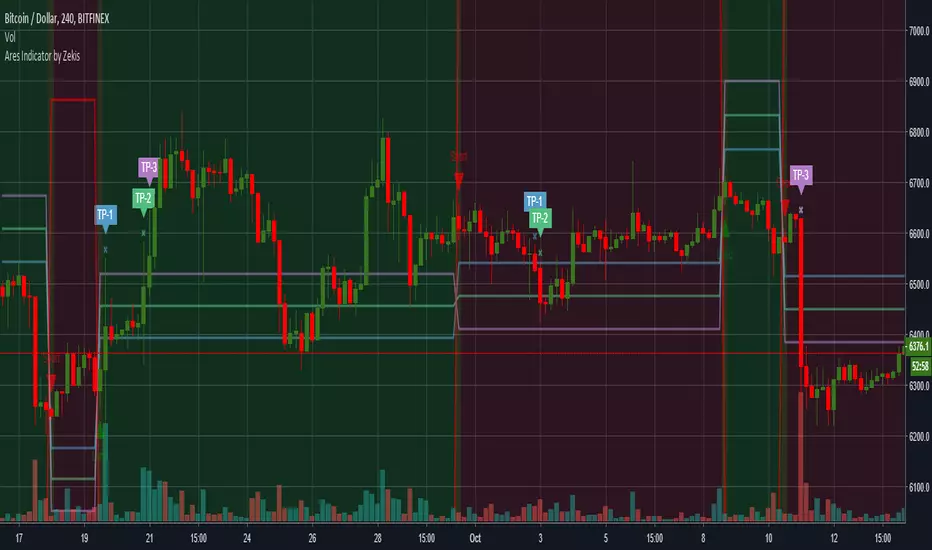
Ares Indicator by ZekisAres Indicator
System Algorithm based on historical price probabilities, with moving averages modified for optimal results.
Buy/Long when background turns green.
Sell/Short when background turns red.
There are 3 Take Profits and a Stop Loss, marked with lines for a better view and with symbols when it get there.
You can set them as you want to meet your requirements.
Alerts are added.
Enjoy!
@ Zekis
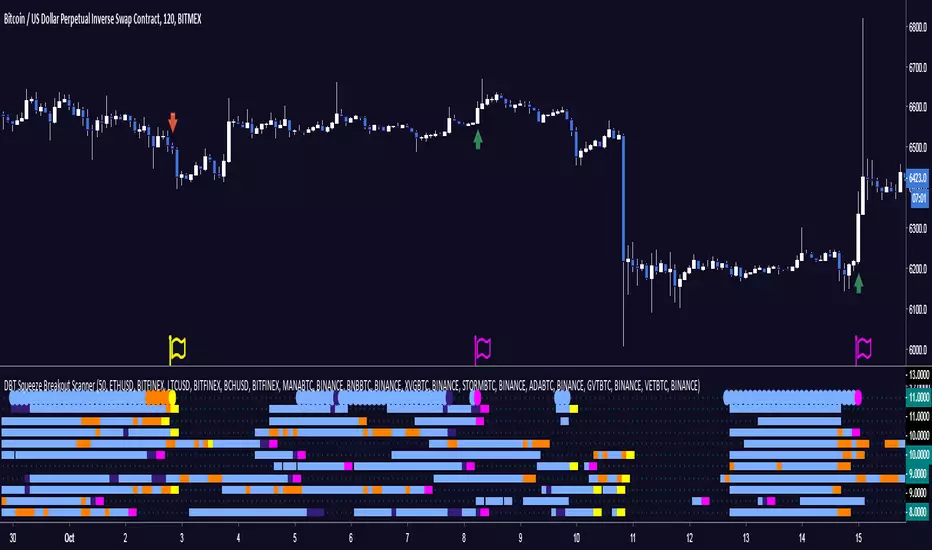
DBT Squeeze Breakout ScannerThe DBT Squeeze Scanner helps you keep an eye on 10 instruments at the same time. It uses a modified version of the DBT Squeeze strategy and scans this strategy against 10 instruments at the same time.
The scanner looks for areas of low volatility signified by a Bollinger Band squeeze and a light blue coloring on the scanner. Once it is squeezing it looks for potential breakout or breakdown opportunities
The scanner has warning signals for both long and short (sell for non margin exchanges) signals, these warning signals are shown as follows:
Light Blue = Bollinger Band Squeeze
Purple = Get ready for a Breakout
Pink = Squeeze has let go and a Breakout is Incoming
Orange = Get ready for a Breakdown
Yellow = Squeeze has let go and a Breakdown is Incoming
All of these signals have their own TradingView alerts. Alerts can be set for anyone of the 10 chosen instruments. Over 10 different kinds of alerts can be setup all at the same time.
This indicator is designed specifically for trending markets, and can be used in many different markets including: Equities, Futures, Commodities, Forex, and Cryptocurrencies. it will give significantly different signals in ranging markets. This indicator is also designed to be 100% preference, PLEASE make sure to choose which 10 instruments you want to watch, the defaults are just some of the major Cryptocurrencies.
Use at your own risk. This is not financial advise and this indicator is not guaranteed to make you profits. Please message me if you have any questions or feedback. Enjoy.
MADE BY GYROMATICAL
RSI Multi Time Frame [Jigga]This indicator simply displays RSI on 4 time frames. You can configure individual RSI lengths as well. The first two RSIs are more visible to prevent clustering. It is possible to define oversold / overbought areas and the script displays the middle line as well.
A couple of use cases:
Comparison of 7, 12, 18 and 24 RSIs on a given time frame
Comparison of 14 RSI on 30m, 1h, 2h and 3h time frame (Default settings)
Please, always use a proper stop loss and risk management.
Here you can see it in action:
BTC - BitMex
BTC - BitMex

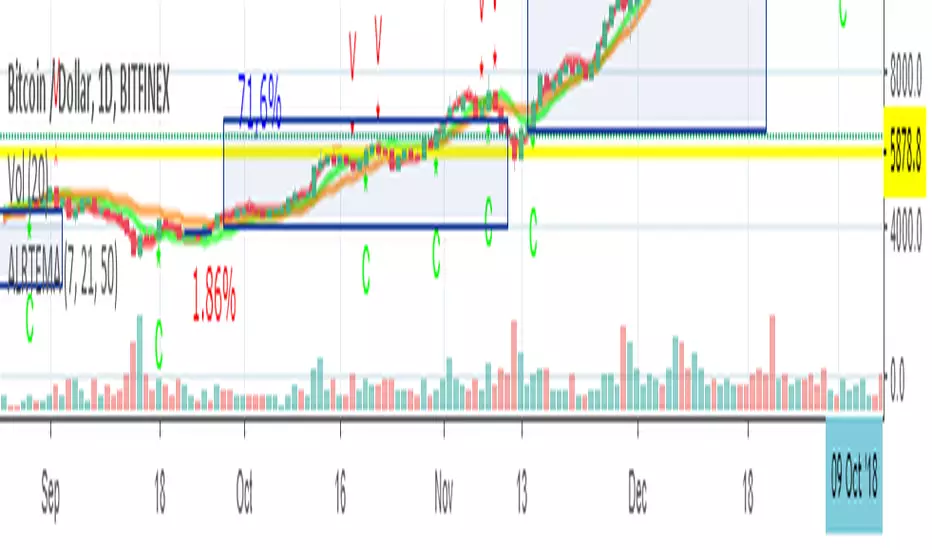
BullTrading Intraday StopHunt Indicator Phycologically traders tend to sell on lows and buy on highs. BullTrading Intraday StopHunt Indicator is designed to help you avoid such situations by monitoring the market for intraday trading setups.
The indicator plots a "Fractal Envelope © " containing the most significant Support and Resistance levels for analysis and entry level selection.
Trend filtering is provided by a MTF P-SAR (SAR will avoid repainting false signals).
The BullTrading Chaos Trend Wave is used instead the Alligator to trade fractals.
BullTrading Intraday StopHunt Indicator will provide 3 types of signals:
First one is a swing/intraday signal, it will alert you when the price is located at a very sensitive level (buy or sell) filtered by trend. If you check the indicator after the close of the day you can even know this exact level in advance (plot Red or Lime color).
Second signal will alert you the Chaos Trend Wave Moving Average Crossovers filtered by price position (related to the Fractal Envelope) and mayor trend.
Third signal is a scalping signal, it will alert you all the fractal breakouts filtered by price position (related to the Fractal Envelope) and mayor trend.
You will be amazed the huge amount of trade opportunities for a given week trading only one financial instrument.
Obviously the indicator is not perfect and will plot few false signals on mayor trend reversals or big price manipulations. AVOID THE TRAP BY WAITING THE PRICE USING BUY LIMIT AND SELL LIMIT ORDERS.
NOTE: This indicator works on any timeframe, but standard settings are calibrated for 15' charts.

CLY 4.20 OscillatorWhen the indicator value is above 4.20 the trend is up, below the trend is down. Watch out for ranging markets.

PpSignal ALMA ADXAlma ADX is a ADX and dmi oscillator in histogram format with alma and linreg internal calculation, yo have 3 line, green not trade, withe transition zone and lime trade zone.

Top 10 Forex Swing Screener V 1.0
Top 10 Forex Swing Screener
Options:
Left-bars and Right-bars look back to find Top | Bottom point.
Set Alarm: After add script on your chart, click on add alarm and select the scrip name below your chart symbol, then select alarm you need and add.
Guide for colors and shapes:
Green: Price Cross Over high swing.
Red: Price Cross Under low swing.
Orange: Price Cross Over low swing or Price Cross Under high swing.
Green Triangle Up: pivot High in symbol.
Red Triangle Down: pivot Low in symbol.
Note: The script operates independently of the chart you in. for use this script, you can favorite it and then apply to any chart.

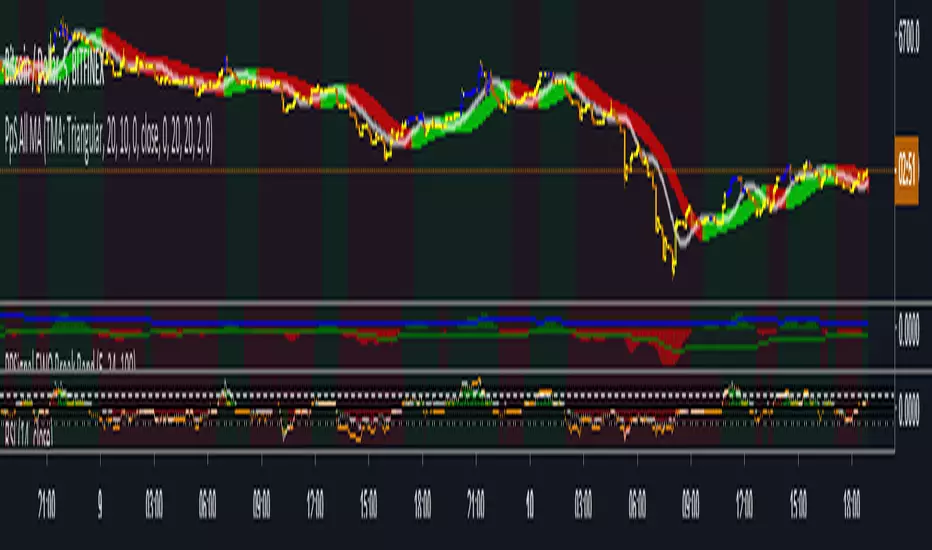
PpSignal ALL MOve Average 1.0Different moving average, Kaufman Adaptive Moving Average, Wilder's Moving Average, Triangular Moving Average , ZLEMA, EMA, SMA , HULL, ALMA, TEMA, ETC. -
BITFINEX:BTCUSD