Smart Trader, Episode 03, by Ata Sabanci, Candles and TradelinesA volume-based multi-block analysis system designed for educational purposes. This indicator helps traders understand their current market situation through aggregated block analysis, volumetric calculations, trend detection, and an AI-style narrative engine.
━━━━━━━━━━━━━━━━━━━━━━━━━━━━━━━━━━━━━━━━━━━
DESIGN PHILOSOPHY: CLEAN CHART, RICH DASHBOARD
Traditional indicators often clutter charts with dozens of support/resistance lines, making it difficult to see price action clearly. This indicator takes a different approach:
The Chart:
Displays only the most meaningful, nearest levels (1 up, 1 down) that have not been consumed by price. This keeps your chart clean and focused on what matters right now.
The Dashboard:
Contains all detailed metrics, calculations, and analysis. Instead of drawing 20 lines on your chart, you get comprehensive data in an organized table format.
Why this approach?
• A clean chart allows you to see price action without visual noise
• Fewer but more meaningful levels help focus attention on immediate reference points
• The dashboard provides depth without sacrificing chart clarity
• Beginners can learn chart reading with an uncluttered view while accessing detailed analysis when needed
━━━━━━━━━━━━━━━━━━━━━━━━━━━━━━━━━━━━━━━━━━━
1. BLOCK SEGMENTATION
What it does:
Divides the analysis window into fixed-size blocks. Each block contains multiple bars that are analyzed as a single unit.
Why:
Individual bars contain noise. A single red candle in an uptrend might cause unnecessary concern, but when you view 5-10 bars as one block, the overall direction becomes clear. Block segmentation filters out bar-to-bar noise and reveals the underlying structure.
Benefit:
• Clearer view of market structure at a higher aggregation level
• Enables comparison between time periods (Block 1 vs Block 2 vs Block 3)
• Creates the foundation for composite candles and trend detection
• Reduces emotional reaction to single-bar movements
━━━━━━━━━━━━━━━━━━━━━━━━━━━━━━━━━━━━━━━━━━━
2. COMPOSITE CANDLES (FRACTAL CONCEPT)
What it does:
Each block generates a "ghost candle" representing aggregated OHLC:
• Open: First bar's open in the block
• High: Highest high across all bars in the block
• Low: Lowest low across all bars in the block
• Close: Last bar's close in the block
Why:
This is essentially a FRACTAL view of the market. The same candlestick patterns that appear on a daily chart also appear on hourly charts, and on 5-minute charts. By aggregating bars into composite candles, you create a synthetic higher timeframe view without changing your actual timeframe.
Benefit:
• See higher timeframe patterns while staying on your preferred timeframe
• Identify block-level candlestick patterns (Doji, Hammer, Marubozu, Engulfing, etc.)
• Compare composite candle relationships: Does Block 1 engulf Block 2? Is Block 1 an inside bar relative to Block 2?
• Recognize patterns that individual bars obscure due to noise
Fractal Nature:
A hammer pattern means the same thing whether it appears on a 1-minute chart or a weekly chart: price tested lower levels and was rejected. Composite candles let you see these patterns at your chosen aggregation level, providing a multi-scale view of market behavior.
━━━━━━━━━━━━━━━━━━━━━━━━━━━━━━━━━━━━━━━━━━━
3. VOLUME ENGINE
What it does:
This indicator is 100% VOLUME-BASED. It separates total volume into buying volume and selling volume using two methods:
Method 1 - Geometric (Approximation):
• Buy Volume = Total Volume × ((Close - Low) / Range)
• Sell Volume = Total Volume × ((High - Close) / Range)
Method 2 - Intrabar LTF (Precise):
Uses actual tick-level or lower timeframe data to determine real buy/sell distribution.
Why:
Raw volume tells you HOW MUCH was traded, but not WHO was aggressive. A large volume bar could mean heavy buying, heavy selling, or both. By separating buy and sell volume, you can identify which side is driving the market.
Benefit:
• Identify whether buyers or sellers are more aggressive
• Detect when volume contradicts price direction (divergence)
• Measure accumulation (buying into weakness) vs distribution (selling into strength)
• Quantify the delta (buy minus sell) to see net pressure
Why Delta Matters:
If price is rising but delta is negative, sellers are actually more aggressive despite the price increase. This divergence often precedes reversals because the price movement lacks volume confirmation.
━━━━━━━━━━━━━━━━━━━━━━━━━━━━━━━━━━━━━━━━━━━
4. PIN ANALYSIS (WICK MEASUREMENT)
What it does:
Calculates average upper pin (wick) and lower pin sizes for each block, then tracks how these change across consecutive blocks.
Why:
Upper pins represent price levels that were tested but rejected by sellers. Lower pins represent price levels that were tested but rejected by buyers. The size and direction of pins reveal rejection strength at specific price zones.
Benefit:
• Large upper pins = strong selling pressure at higher levels
• Large lower pins = strong buying support at lower levels
• Increasing upper pins across blocks = intensifying selling pressure
• Decreasing lower pins across blocks = weakening buying support
Why Track Pin Changes:
Pin behavior often changes before price direction changes. If lower pins are shrinking while price is still rising, the buying support that was defending dips is weakening. This is observable data, not prediction.
━━━━━━━━━━━━━━━━━━━━━━━━━━━━━━━━━━━━━━━━━━━
5. TREND CHANNEL DETECTION
What it does:
Identifies trend direction using block-level price structure:
• UPTREND: Block highs are higher than previous block highs, AND block lows are higher than previous block lows (HH/HL pattern)
• DOWNTREND: Block highs are lower than previous block highs, AND block lows are lower than previous block lows (LH/LL pattern)
• RANGE: No consistent directional pattern
Once detected, the system draws upper and lower channel boundaries by connecting extreme points within each trend segment.
Why:
HH/HL and LH/LL are the classical definitions of trend. By applying this logic to composite candles (blocks) rather than individual bars, the trend detection becomes more stable and less prone to whipsaws from single-bar noise.
Benefit:
• Clear visual boundaries showing the current trend channel
• Upper channel line = dynamic resistance based on actual price structure
• Lower channel line = dynamic support based on actual price structure
• Channel angle indicates trend strength (steeper = stronger)
• Channel width indicates volatility
Why Lock Trend States:
Once a block's trend classification is determined, it locks and does not change on subsequent recalculations. Without locking, the same block could flip between UP and DOWN repeatedly, creating inconsistent analysis. Locking ensures stability.
Why Project Lines Forward:
Channel lines can be projected into the future to show where support/resistance would be if the current trend continues at the same angle. This is not a prediction; it is a visual reference showing the trend's trajectory.
━━━━━━━━━━━━━━━━━━━━━━━━━━━━━━━━━━━━━━━━━━━
6. CORE LEVELS: POC, MAX BUY, MAX SELL
What it does:
Identifies key price levels within each block based on volume data:
POC (Point of Control):
The price level where the highest total volume occurred within the block.
MAX BUY Level:
The bar with the highest buying volume. The HIGH of this bar marks the level.
MAX SELL Level:
The bar with the highest selling volume. The LOW of this bar marks the level.
MIN BUY/SELL Levels:
Optional levels showing where minimum buy/sell volume occurred.
Why:
High volume at a specific price means many participants entered positions there. These participants have a vested interest in that price level. If price returns to that area, those same participants may act to defend their positions.
Benefit:
• POC acts as a volume-based magnet; price tends to revisit high-volume areas
• MAX BUY level shows where buyers committed most aggressively
• MAX SELL level shows where sellers committed most aggressively
• These levels are based on actual transaction data, not arbitrary calculations
Why Consumed Levels Disappear:
When price crosses through a level, that level has been "tested." Keeping consumed levels on the chart creates visual clutter and suggests they are still relevant when they may no longer be. Removing them keeps focus on levels that have not yet been tested.
Why Show Only Nearest Levels:
If you have 20 blocks, you could have 60+ potential levels (POC, MAX BUY, MAX SELL for each). Displaying all of them makes the chart unreadable. Showing only the nearest untested level above and below current price keeps the chart clean while providing immediate reference points.
━━━━━━━━━━━━━━━━━━━━━━━━━━━━━━━━━━━━━━━━━━━
7. QUALITY SCORE AND TREND INTELLIGENCE
What it does:
Calculates a quality score (0-100) for the current trend based on multiple factors:
• Angle steepness (stronger trends have steeper angles)
• Delta consistency (does volume support the trend direction?)
• Volume momentum (is participation increasing or decreasing?)
• Body expansion (are candle bodies growing or shrinking?)
• Pin alignment (do pins support the trend direction?)
• Contradiction count (how many factors disagree?)
Why:
Not all trends are equal. A trend with consistent volume support, expanding bodies, and aligned pins is healthier than a trend with contradicting signals. The quality score quantifies this.
Benefit:
• HIGH quality (80+): Multiple factors confirm the trend
• MEDIUM quality (60-79): Some factors confirm, some neutral
• LOW quality (below 60): Multiple contradictions exist
• Strength rating based on channel angle: VERY STRONG, STRONG, MODERATE, WEAK
━━━━━━━━━━━━━━━━━━━━━━━━━━━━━━━━━━━━━━━━━━━
8. NARRATIVE ENGINE
What it does:
Generates a text-based market analysis by synthesizing all calculated data into readable sentences.
How it works:
1. Analyzes current candle: pattern type (Doji, Hammer, Marubozu, etc.), body/wick ratios, range vs ATR
2. Analyzes composite candle: Block 1 pattern and relationship to Block 2 (Engulfing, Inside, Outside)
3. Evaluates trend context: direction, duration, quality, transitions
4. Examines volume data: delta, dominance, momentum direction
5. Checks proximity to key levels: channel boundaries, POC, core levels
6. Identifies divergences: when price and volume directions contradict
7. Produces a coherent narrative describing the current situation
Why:
Numbers and charts require interpretation. The narrative engine translates calculated data into plain language, helping traders understand what the data means in context. This is especially valuable for beginners learning to read charts.
Benefit:
• Synthesizes multiple data points into a coherent story
• Explicitly flags divergences and contradictions
• Describes the current situation without making predictions
• Educational: shows how different factors relate to each other
What the Narrative Does NOT Do:
The narrative describes what IS, not what WILL BE. It does not predict future price movement. It reports the current candle pattern, the current trend state, the current volume situation, and the current proximity to levels.
━━━━━━━━━━━━━━━━━━━━━━━━━━━━━━━━━━━━━━━━━━━
9. SMART DASHBOARD
What it does:
Displays all metrics in an organized table with multiple sections.
Sections:
• Volume Engine: Calculation method, data availability, current candle buy/sell/delta
• Trend Volumetrics: Aggregated buy/sell/delta across the current trend, trend type
• Pressure and Momentum: Average pins, pin change percentages, body expansion status
• Trend Channel Boundaries: Upper/lower levels with exact prices, distances, percentages
• Trend Intelligence: Quality score, confidence level, strength rating, volume momentum
Why:
All the detailed calculations need to live somewhere without cluttering the chart. The dashboard provides comprehensive data in a structured format.
Benefit:
• All metrics in one place
• Organized by category for easy reference
• Hover over any label to see a tooltip explaining that metric
• No need to draw dozens of lines on the chart
TIP: Hover over dashboard headers and labels to see tooltips explaining each metric.
━━━━━━━━━━━━━━━━━━━━━━━━━━━━━━━━━━━━━━━━━━━
10. LANGUAGE SUPPORT
The indicator supports three languages:
• English
• Türkçe (Turkish)
• हिन्दी (Hindi)
Why only three languages?
Each additional language requires duplicate strings throughout the code, increasing memory usage and compilation time. To keep the script optimized and responsive, language options are limited to these three.
━━━━━━━━━━━━━━━━━━━━━━━━━━━━━━━━━━━━━━━━━━━
11. DATA ACCURACY AND LIMITATIONS
This indicator is 100% VOLUME-BASED and requires Lower Timeframe (LTF) intrabar data for accurate calculations.
DATA ACCURACY LEVELS:
• 1T (Tick): Most accurate, real volume distribution per tick
• 1S (1 Second): Reasonably accurate approximation
• 15S (15 Seconds): Good approximation, longer historical data available
• 1M (1 Minute): Rough approximation, maximum historical data range
BACKTEST AND REPLAY LIMITATIONS:
• Replay mode results may differ from live trading due to data availability
• For longer backtest periods, use higher LTF settings (15S or 1M)
• Not all symbols/exchanges support tick-level data
• Crypto and Forex typically have better LTF data availability than stocks
A NOTE ON DATA ACCESS:
Higher TradingView plans provide access to more historical intrabar data, which directly impacts the accuracy of volume-based calculations. More precise volume data leads to more reliable calculations.
━━━━━━━━━━━━━━━━━━━━━━━━━━━━━━━━━━━━━━━━━━━
12. SETTINGS OVERVIEW
Main Settings:
• Window Bars: Total bars to analyze
• Group Count: Number of blocks to create
• Calculation Basis: Current bar (live updates) or Closed bar (stable, no repaint)
Block Analytics:
• Show Composite Candle: Toggle ghost candles on/off
• Composite Candle Transparency: Adjust visibility
• Dim Original Candles: Fade original candles when composites are shown
Volume Engine:
• Calculation Method: Geometric (approx) or Intrabar (precise)
• Lower Timeframe: Select LTF for intrabar calculations
Multi-Segment Trend:
• Enable Trend Detection: Toggle trend channels on/off
• Range Angle Threshold: Angle below which trend is classified as RANGE
• Line colors, width, and style
• Project to Future: Extend trend lines forward
Core Calculation:
• Enable Core Calculation: Toggle POC and core levels
• Show POC Nearest Up/Down: Display nearest untested POC levels
• Include MAX/MIN Buy/Sell Levels: Toggle extremes display
• Nearest Only: Show only the closest level above and below price
Market Narrative:
• Enable Market Narrative: Toggle narrative text
• Language selection
• Show Educational Disclaimer: Toggle disclaimer in dashboard
━━━━━━━━━━━━━━━━━━━━━━━━━━━━━━━━━━━━━━━━━━━
EDUCATIONAL PURPOSE
This indicator is designed to help traders:
1. Understand their current market situation at a glance
2. Learn chart reading through block analysis and composite candles
3. See how volume relates to price movement
4. Recognize when technical factors align or contradict
5. Focus on meaningful levels without chart clutter
Whether you are a beginner learning to read charts or an experienced trader seeking a cleaner analytical view, this tool provides structured data to support your analysis.
━━━━━━━━━━━━━━━━━━━━━━━━━━━━━━━━━━━━━━━━━━━
IMPORTANT DISCLAIMER
This indicator is for EDUCATIONAL PURPOSES ONLY and does not constitute investment advice. Always conduct your own research and consult with a qualified financial advisor before making investment decisions.
This disclaimer is also displayed within the indicator itself. If you prefer a cleaner chart, you can disable it in Settings under Market Narrative by unchecking Show Educational Disclaimer.
Fractalstrategy

Fractal Support and Resistance [BigBeluga]🔵 OVERVIEW
The Fractal Support and Resistance indicator automatically identifies high-probability support and resistance zones based on repeated fractal touches. When a defined number of fractal highs or lows cluster around the same price zone, the indicator plots a clean horizontal level and shaded zone, helping traders visualize structurally important areas where price may react.
🔵 CONCEPTS
Fractal Points: Swing highs and lows based on user-defined left and right range (length). A valid fractal forms only when the center candle is higher or lower than its neighbors.
Zone Validation: A level is only confirmed when the price has printed the specified number of fractals (e.g., 3) within a narrow ATR-defined range.
Dynamic Zone Calculation: The plotted level can be based on the average of clustered fractals or on the extreme value (min or max), depending on the user’s choice.
Support/Resistance Zones: Once a zone is validated, a horizontal line and shaded box are drawn and automatically extended into the future until new valid clusters form.
Auto-Clean & Reactivity: Each zone persists until replaced by a new fractal cluster, ensuring the chart remains uncluttered and adaptive.
🔵 FEATURES
Detects swing fractals using adjustable left/right range.
Confirms zones when a defined number of fractals occur near the same price.
Plots horizontal level and shaded box for visual clarity.
Choice between average or min/max logic for level calculation.
Distinct color inputs for support (green) and resistance (orange) zones.
Adaptive auto-extension keeps valid zones projected into the future.
Displays optional triangle markers above/below bars where fractals form.
Clean design optimized for structural S/R analysis.
🔵 HOW TO USE
Use support zones (from low fractals) to look for potential long entries or bounce points .
Use resistance zones (from high fractals) to look for short setups or rejections .
Adjust the Fractals Qty to make zones more or less strict—e.g., 3 for higher reliability, 2 for quicker responsiveness.
Combine with liquidity indicators or break/retest logic to validate zone strength.
Toggle between average and min/max mode to fit your style (average for balance, extremes for aggression).
🔵 CONCLUSION
Fractal Support and Resistance offers a robust way to identify hidden levels that the market respects repeatedly. By requiring multiple fractal confirmations within a zone, it filters out noise and highlights clean structural areas of interest. This tool is ideal for traders who want automatic, adaptive, and reliable S/R levels grounded in raw market structure.

Fractal Breakout Trend Following StrategyOverview
The Fractal Breakout Trend Following Strategy is a trend-following system which utilizes the Willams Fractals and Alligator to execute the long trades on the fractal's breakouts which have a high probability to be the new uptrend phase beginning. This system also uses the normalized Average True Range indicator to filter trades after a large moves, because it's more likely to see the trend continuation after a consolidation period. Strategy can execute only long trades.
Unique Features
Trend and volatility filtering system: Strategy uses Williams Alligator to filter the counter-trend fractals breakouts and normalized Average True Range to avoid the trades after large moves, when volatility is high
Configurable Trading Periods: Users can tailor the strategy to specific market windows, adapting to different market conditions.
Flexible Risk Management: Users can choose the stop-loss percent (by default = 3%) for trades, but strategy also has the dynamic stop-loss level using down fractals.
Methodology
The strategy places stop order at the last valid fractal breakout level. Validity of this fractal is defined by the Williams Alligator indicator. If at the moment of time when price breaking the last fractal price is higher than Alligator's teeth line (8 period SMA shifted 5 bars in the future) this is a valid breakout. Moreover strategy has the additional volatility filtering system using normalized ATR. It calculates the average normalized ATR for last user-defined number of bars and if this value lower than the user-defined threshold value the long trade is executed.
When trade is opened, script places the stop loss at the price higher of two levels: user defined stop-loss from the position entry price or down fractal validation level. The down fractal is valid with the rule, opposite as the up fractal validation. Price shall break to the downside the last down fractal below the Willians Alligator's teeth line.
Strategy has no fixed take profit. Exit level changes with the down fractal validation level. If price is in strong uptrend trade is going to be active until last down fractal is not valid. Strategy closes trade when price hits the down fractal validation level.
Risk Management
The strategy employs a combined approach to risk management:
It allows positions to ride the trend as long as the price continues to move favorably, aiming to capture significant price movements. It features a user-defined stop-loss parameter to mitigate risks based on individual risk tolerance. By default, this stop-loss is set to a 3% drop from the entry point, but it can be adjusted according to the trader's preferences.
Justification of Methodology
This strategy leverages Williams Fractals to open long trade when price has broken the key resistance level to the upside. This resistance level is the last up fractal and is shall be broken above the Williams Alligator's teeth line to be qualified as the valid breakout according to this strategy. The Alligator filtering increases the probability to avoid the false breakouts against the current trend.
Moreover strategy has an additional filter using Average True Range(ATR) indicator. If average value of ATR for the last user-defined number of bars is lower than user-defined threshold strategy can open the long trade according to open trade condition above. The logic here is following: we want to open trades after period of price consolidation inside the range because before and after a big move price is more likely to be in sideways, but we need a trend move to have a profit.
Another one important feature is how the exit condition is defined. On the one hand, strategy has the user-defined stop-loss (3% below the entry price by default). It's made to give users the opportunity to restrict their losses according to their risk-tolerance. On the other hand, strategy utilizes the dynamic exit level which is defined by down fractal activation. If we assume the breaking up fractal is the beginning of the uptrend, breaking down fractal can be the start of downtrend phase. We don't want to be in long trade if there is a high probability of reversal to the downside. This approach helps to not keep open trade if trend is not developing and hold it if price continues going up.
Backtest Results
Operating window: Date range of backtests is 2023.01.01 - 2024.05.01. It is chosen to let the strategy to close all opened positions.
Commission and Slippage: Includes a standard Binance commission of 0.1% and accounts for possible slippage over 5 ticks.
Initial capital: 10000 USDT
Percent of capital used in every trade: 30%
Maximum Single Position Loss: -3.19%
Maximum Single Profit: +24.97%
Net Profit: +3036.90 USDT (+30.37%)
Total Trades: 83 (28.92% win rate)
Profit Factor: 1.953
Maximum Accumulated Loss: 963.98 USDT (-8.29%)
Average Profit per Trade: 36.59 USDT (+1.12%)
Average Trade Duration: 72 hours
These results are obtained with realistic parameters representing trading conditions observed at major exchanges such as Binance and with realistic trading portfolio usage parameters.
How to Use
Add the script to favorites for easy access.
Apply to the desired timeframe and chart (optimal performance observed on 4h and higher time frames and the BTC/USDT).
Configure settings using the dropdown choice list in the built-in menu.
Set up alerts to automate strategy positions through web hook with the text: {{strategy.order.alert_message}}
Disclaimer:
Educational and informational tool reflecting Skyrex commitment to informed trading. Past performance does not guarantee future results. Test strategies in a simulated environment before live implementation

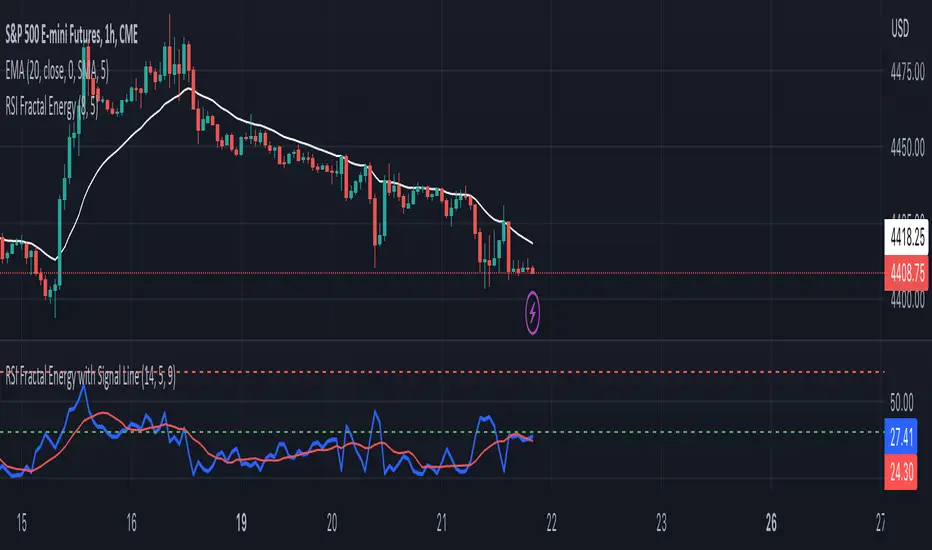
RSI Fractal Energy with Signal LineHere is my second script.
Introducing the RSI Fractal Energy Indicator.
This incorporates the Relative-Strength Index and Fractal Energy as the name implies.
This will help the trader identify:
1. Trend Strength: The higher the value of the indicator can indicate the strength of the trend and vice versa.
2. Reversal points: If the indicator is showing weakness and the market is making higher highs and lower lows this can indicate a reversal is possible.
3. Overbought and Oversold conditions: This indicator is currently set to 30(Oversold) and 70(Overbought), but this can be changed in the source code.
I also added a signal line to provide bullish/bearish crossovers.
I use this indicator on the 1 hr chart, but it can be used on any time frame.
Please let me know if you have any questions, comments, or concerns. Always open to learning more.
I will also provide updates as I continue to use my indicators.
Happy trading!
Market Structure CHoCH/BOS (Fractal) [LuxAlgo]The Market Structure CHoCH/BOS (Fractal) indicator is an experimental take on classical market structure, whereas fractal patterns are used for their construction instead of swing points.
Compared to utilizing swing points for highlighting market structure like our Smart Money Concepts indicator , fractal-based market structure can appear as more adaptive, however, it can also be more restrictive when it comes to returning swing points which can cause the indicator to miss reversals in some cases.
If enabled from within the settings, users can see support and resistance levels returned from the detected market structure with breakouts highlighted on the chart. Alongside this feature, an additional dashboard showing the structure to fractal structure percentage is also provided.
🔶 SETTINGS
Length: Length of the fractal patterns to detect.
🔹 Style
Bullish Structures: Show bullish structures.
Bearish Structures: Show bullish structures.
Support: Show support levels.
Resistance: Show resistance levels.
🔹 Dashboard
Show Dashboard: Show structure to fractal percentage dashboard on the chart.
Location: Location of the dashboard on the chart.
Size: Dashboard size.
🔶 USAGE
Market structure is commonly used to determine trend direction by using price positions relative to prior swing points. Using fractal patterns to determine market structure can allow users to obtain shorter, more frequent structure labels.
Market structure is commonly classified as follows:
Change of Character (CHoCH), also referred to as Market Structure Shift (MSS)
Break of Structure (BOS), also referred to as Market Structure Break (MSB)
Change of Characters indicate a shift in the market trend, confirming trend reversals. Break of Structures on the other hand occur once a trend is already determined, confirming new higher highs/lower lows.
Using higher length values allow users to detect longer-term fractals, thus highlighting longer-term market structures. The image above detects fractal patterns made of 7 candles, even if the increment is only of 2 bars this significantly reduces the amount of detected market structure labels.
The result obtained by utilizing fractals and higher settings can be a more dynamic view of market structure, however, as seen in the image above this can introduce very significant delay compared to utilizing pure swing points.
🔹 Support/Resistance
The indicator also returns support/resistance levels constructed from the market structure, these levels are obtained similarly to order blocks, finding the minimum on the interval of a bullish market structure and the maximum of a bearish market structure.
Price reaching a support/resistance level can be expected to bounce from it. Once a level is broken, the support/resistance level will no longer extend, and a circle will be displayed highlighting the break.
While utilizing this script for fractal-based market structure, these levels can be useful to ensure all swing points are still considered by the user with the possibility of the indicator missing reversals due to its calculation not being based on swing points themselves.
🔹 Dashboard
The dashboard reports the structure to fractal percentage, that is the amount of bullish/bearish market structures relative to the total amount of detected bullish/bearish fractal patterns.
This allows us to see how often a detected fractal pattern is used to display a market structure.
🔶 DETAILS
🔹 Fractals
In the context of technical analysis, Fractals refer to specific patterns that exhibit self-similarity at different scales or timeframes.
The most commonly known fractal pattern consists of a consecutive sequence of candles (more commonly 5), with the central candle being the lowest (in case of a bullish fractal) or highest (in case of a bearish fractal).
A bullish fractal has candles on the right side of the central candle with increasing lows, while candles on the left side have decreasing lows.
A bearish fractal has candles on the right side of the central candle with decreasing highs, while candles on the left side have increasing highs.
🔶 RELATED SCRIPTS
🔹 Smart Money Concepts
🔹 Market Structure Trailing Stop
🔹 ICT Concepts

Eliza Ellis Improved FractalsA little side project of mine. may enhance further in the future. Used best for scalping. The longer you're in the market the more the news is waiting to eat you so I'd recommend using high volume and getting in and out quickly

Fractal Breakout StrategyFractal
A type of pattern used in technical analysis to predict a reversal in the current trend. A fractal pattern consists of five bars and is identified when the price meets the following characteristics:
1. A shift from a downtrend to an uptrend occurs when the lowest bar is located in the middle of the pattern and two bars with successively higher lows are positioned around it.
2. A shift from an uptrend to a downtrend occurs when the highest bar is located in the middle of the pattern and two bars with successively lower highs are positioned around it.

FRAMA (Ehlers true modified calculation)Credit goes to Shizaru for the original calculation. I made just a few fixes, so that the calculation is really that of Ehlers.
Fixed H2 and L2 period, fixed w natural logarithm