Automatic Higher Timeframe Dividers [@gaucho_trader]🧭 Overview
The HTF Separators (auto) indicator automatically draws vertical lines marking the start of each candle belonging to a higher–timeframe (HTF).
This allows you to visually identify the boundaries of higher–timeframe candles within your current chart — an essential concept for multi–timeframe (MTF) analysis.
For example:
On a 15-minute chart, each line marks the start of a new 4-hour candle.
On a 1-hour chart, the lines show where each daily candle begins.
On a daily chart, they highlight the start of each month.
These vertical separators help you recognize moments when price often reacts or shifts, since the open of a new higher-timeframe candle frequently aligns with impulses, reversals, or structural changes.
⚙️ Main Features
✅ Automatic timeframe mapping:
1m → 15m
3m → 30m
5m → 1H
15m → 4H
1H → 1D
4H → 1W
1D → 1M
✅ Full customization:
Line color
Line width
Style (solid, dashed, or dotted)
✅ Optional HTF label:
Display a small label showing the detected higher timeframe (e.g. “HTF: 4H”).
🧩 How to use
Add the indicator to your chart.
Adjust the color, width, and style to your preference.
(Optional) Enable the label to display the current HTF being tracked.
Watch how vertical lines automatically appear whenever a new higher-timeframe candle starts.
This helps you align your trades and analysis with higher-timeframe structure, giving you a clearer understanding of market cycles and timing.
💡 Practical Example
If you trade on a 15-minute chart, each separator line represents the start of a 4-hour candle.
Use it to:
Understand the context of your current candle within the larger trend.
Spot key reaction points at HTF opens.
Time entries and exits around HTF shifts.
🧠 Best for
Traders using multi-timeframe analysis (MTF)
Intraday and swing traders seeking better HTF alignment
Anyone wanting a cleaner and more structured chart view
📈 Automatic Higher Timeframe Dividers is a lightweight, practical tool that brings clarity and temporal precision to your technical analysis — helping you instantly see where each major candle begins on your chart.
Fractalstrategy

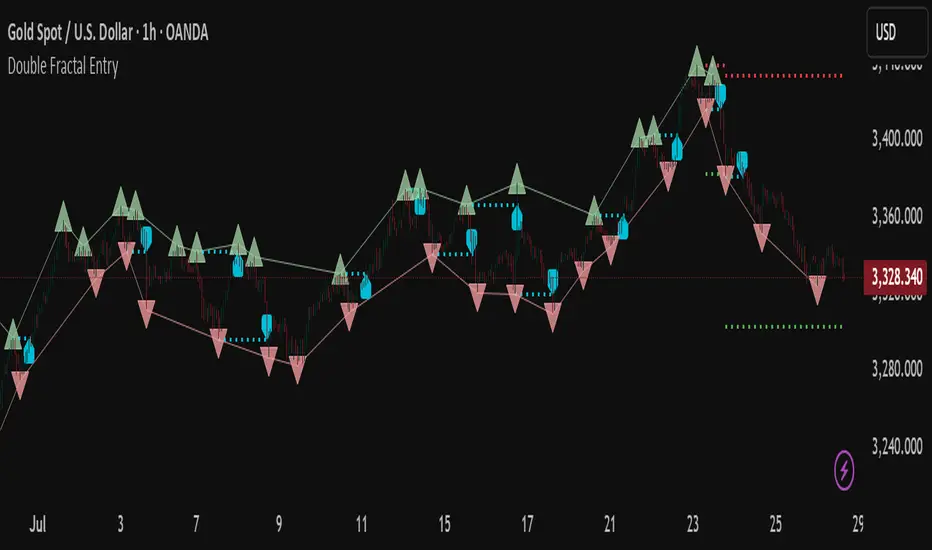
Double Fractal Entry📘 Double Fractal Entry – Original Structure-Based Entry System
Double Fractal Entry is a proprietary indicator that uses dynamic fractal structure to generate actionable buy/sell signals, with automatic Stop-Loss and Take-Profit placement. Unlike classic fractal tools or ZigZag-based visuals, this script constructs real-time structural channels from price extremes and offers precise entry points based on breakout or rejection behavior.
It is designed for traders who want a clear, structured approach to trading price action — without repainting, lagging indicators, or built-in oscillators.
🧠 Core Logic
This script combines three custom-built modules:
1. Fractal Detection and Channel Construction
- Fractals are detected using a configurable number of left/right bars (sensitivity).
- Confirmed upper/lower fractals are connected into two continuous channels.
- These channels represent real-time structure zones that evolve with price.
2. Entry Signal Logic
You can choose between two signal types:
- Breakout Mode – Triggers when price breaks above the upper fractal structure (for buys) or below the lower one (for sells).
- Rebound Mode – Triggers when price approaches a fractal channel and then rejects it (forms a reversal setup).
Each signal includes:
- Entry arrow on the chart
- Horizontal entry line
- Stop-Loss and Take-Profit lines
3. SL/TP Calculation
Unlike tools that use ATR or fixed values, SL and TP are dynamically set using the fractal range — the distance between the most recent upper and lower fractals. This makes the risk model adaptive to market volatility and structure.
📊 Visuals on the Chart
- 🔺 Green/Red triangle markers = confirmed fractals
- 📈 Lime/Red channel lines = evolving upper/lower structure
- 🔵 Blue arrow = signal direction (buy/sell)
- 📉 SL/TP lines = dynamically drawn based on fractal spacing
- 🔁 Signal history = optional, toggleable for backtesting
⚙️ Settings and Customization
- Fractal sensitivity (bars left/right)
- Entry mode: Breakout or Rebound
- SL and TP multiplier (based on fractal range)
- Visibility settings (signal history, lines, colors, etc.)
💡 What Makes It Unique
This is not just a variation of standard fractals or a ZigZag wrapper.
Double Fractal Entry was built entirely from scratch and includes:
- ✅ A dual-channel system that shows the live market structure
- ✅ Entry signals based on price behavior around key zones
- ✅ Volatility-adaptive SL/TP levels for realistic trade management
- ✅ Clean, non-repainting logic for both manual and automated use
The goal is to simplify structure trading and provide precise, repeatable entries in any market condition.
🧪 Use Cases
- Breakout mode – Ideal for trend continuation and momentum entries
- Rebound mode – Great for reversals, pullbacks, and range-bound markets
- Can be used standalone or combined with volume/trend filters
⚠️ Disclaimer
This tool is intended for technical analysis and educational use. It does not predict future market direction and should be used with proper risk management and strategy confirmation.

Double Fractal Entry📘 Double Fractal Entry – Original Structure-Based Entry System
Double Fractal Entry is a proprietary indicator that uses dynamic fractal structure to generate actionable buy/sell signals, with automatic Stop-Loss and Take-Profit placement. Unlike classic fractal tools or ZigZag-based visuals, this script constructs real-time structural channels from price extremes and offers precise entry points based on breakout or rejection behavior.
It is designed for traders who want a clear, structured approach to trading price action — without repainting, lagging indicators, or built-in oscillators.
🧠 Core Logic
This script combines three custom-built modules:
1. Fractal Detection and Channel Construction
- Fractals are detected using a configurable number of left/right bars (sensitivity).
- Confirmed upper/lower fractals are connected into two continuous channels.
- These channels represent real-time structure zones that evolve with price.
2. Entry Signal Logic
You can choose between two signal types:
- Breakout Mode – Triggers when price breaks above the upper fractal structure (for buys) or below the lower one (for sells).
- Rebound Mode – Triggers when price approaches a fractal channel and then rejects it (forms a reversal setup).
Each signal includes:
- Entry arrow on the chart
- Horizontal entry line
- Stop-Loss and Take-Profit lines
3. SL/TP Calculation
Unlike tools that use ATR or fixed values, SL and TP are dynamically set using the fractal range — the distance between the most recent upper and lower fractals. This makes the risk model adaptive to market volatility and structure.
📊 Visuals on the Chart
- 🔺 Green/Red triangle markers = confirmed fractals
- 📈 Lime/Red channel lines = evolving upper/lower structure
- 🔵 Blue arrow = signal direction (buy/sell)
- 📉 SL/TP lines = dynamically drawn based on fractal spacing
- 🔁 Signal history = optional, toggleable for backtesting
⚙️ Settings and Customization
- Fractal sensitivity (bars left/right)
- Entry mode: Breakout or Rebound
- SL and TP multiplier (based on fractal range)
- Visibility settings (signal history, lines, colors, etc.)
💡 What Makes It Unique
This is not just a variation of standard fractals or a ZigZag wrapper.
Double Fractal Entry was built entirely from scratch and includes:
- ✅ A dual-channel system that shows the live market structure
- ✅ Entry signals based on price behavior around key zones
- ✅ Volatility-adaptive SL/TP levels for realistic trade management
- ✅ Clean, non-repainting logic for both manual and automated use
The goal is to simplify structure trading and provide precise, repeatable entries in any market condition.
🧪 Use Cases
- Breakout mode – Ideal for trend continuation and momentum entries
- Rebound mode – Great for reversals, pullbacks, and range-bound markets
- Can be used standalone or combined with volume/trend filters
🔒 Invite-Only Notice
This is an invite-only script with a fully closed source.
All logic is original and developed by the author. It does not use or copy public open-source scripts, built-in indicators (RSI, MA, etc.), or repainting tricks. The entire entry and risk system is based on custom structural logic built from real-time price action.
⚠️ Disclaimer
This tool is intended for technical analysis and educational use. It does not predict future market direction and should be used with proper risk management and strategy confirmation.
Fractal Support and Resistance [BigBeluga]🔵 OVERVIEW
The Fractal Support and Resistance indicator automatically identifies high-probability support and resistance zones based on repeated fractal touches. When a defined number of fractal highs or lows cluster around the same price zone, the indicator plots a clean horizontal level and shaded zone, helping traders visualize structurally important areas where price may react.
🔵 CONCEPTS
Fractal Points: Swing highs and lows based on user-defined left and right range (length). A valid fractal forms only when the center candle is higher or lower than its neighbors.
Zone Validation: A level is only confirmed when the price has printed the specified number of fractals (e.g., 3) within a narrow ATR-defined range.
Dynamic Zone Calculation: The plotted level can be based on the average of clustered fractals or on the extreme value (min or max), depending on the user’s choice.
Support/Resistance Zones: Once a zone is validated, a horizontal line and shaded box are drawn and automatically extended into the future until new valid clusters form.
Auto-Clean & Reactivity: Each zone persists until replaced by a new fractal cluster, ensuring the chart remains uncluttered and adaptive.
🔵 FEATURES
Detects swing fractals using adjustable left/right range.
Confirms zones when a defined number of fractals occur near the same price.
Plots horizontal level and shaded box for visual clarity.
Choice between average or min/max logic for level calculation.
Distinct color inputs for support (green) and resistance (orange) zones.
Adaptive auto-extension keeps valid zones projected into the future.
Displays optional triangle markers above/below bars where fractals form.
Clean design optimized for structural S/R analysis.
🔵 HOW TO USE
Use support zones (from low fractals) to look for potential long entries or bounce points .
Use resistance zones (from high fractals) to look for short setups or rejections .
Adjust the Fractals Qty to make zones more or less strict—e.g., 3 for higher reliability, 2 for quicker responsiveness.
Combine with liquidity indicators or break/retest logic to validate zone strength.
Toggle between average and min/max mode to fit your style (average for balance, extremes for aggression).
🔵 CONCLUSION
Fractal Support and Resistance offers a robust way to identify hidden levels that the market respects repeatedly. By requiring multiple fractal confirmations within a zone, it filters out noise and highlights clean structural areas of interest. This tool is ideal for traders who want automatic, adaptive, and reliable S/R levels grounded in raw market structure.

Gabriel's Witcher Strategy [65 Minute Trading Bot]Strategy Description: Gabriel's Witcher Strategy
Author: Gabriel
Platform: TradingView Pine Script (Version 5)
Backtested Asset: Avalanche (Coinbase Brokage for Volume adjustment)
Timeframe: 65 Minutes
Strategy Type: Comprehensive Trend-Following and Momentum Strategy with Scalping and Risk Management Features
Overview
Gabriel's Witcher Strategy is an advanced trading bot designed for the Avalanche pair on a 65-minute timeframe. This strategy integrates a multitude of technical indicators to identify and execute high-probability trading opportunities. By combining trend-following, momentum, volume analysis, and range filtering, the strategy aims to capitalize on both long and short market movements. Additionally, it incorporates scalping mechanisms and robust risk management features, including take-profit (TP) levels and commission considerations, to optimize trade performance and profitability.
====Key Components====
Source Selection:
Custom Source Flexibility: Allows traders to select from a wide range of price and volume sources (e.g., Close, Open, High, Low, HL2, HLC3, OHLC4, VWAP, On-Balance Volume, etc.) for indicator calculations, enhancing adaptability to various trading styles.
Various curves of Volume Analysis are employed:
Tick Volume Calculation: Utilizes tick volume as a fallback when actual volume data is unavailable, ensuring consistency across different data feeds.
Volume Indicators: Incorporates multiple volume-based indicators such as On-Balance Volume (OBV), Accumulation/Distribution (AccDist), Negative Volume Index (NVI), Positive Volume Index (PVI), and Price Volume Trend (PVT) for comprehensive market analysis.
Trend Indicators:
ADX (Average Directional Index): Measures trend strength using either the Classic or Masanakamura method, with customizable length and threshold settings. It's used to open positions when the mesured trend is strong, or exit when its weak.
Jurik Moving Average (JMA): A smooth moving average that reduces lag, configurable with various parameters including source, resolution, and repainting options.
Parabolic SAR: Identifies potential reversals in market trends with adjustable start, increment, and maximum settings.
Custom Trend Indicator: Utilizes highest and lowest price points over a specified timeframe to determine current and previous trend bases, visually represented with color-filled areas.
Momentum Indicators:
Relative Strength Index (RSI): Evaluates the speed and change of price movements, smoothed with a custom length and source. It's used to not enter the market for shorts in oversold or longs for overbought conditions, and to enter for long in oversold or shorts for overboughts.
Momentum-Based Calculations: Employs both Double Exponential Moving Averages (DEMA) on a MACD-based RSI to enhance momentum signal accuracy which is then further accelerated by a Hull MA. This is the technical analysis tool that determines bearish or bullish momentum.
OBV-Based Momentum Conditions: Uses two exponential moving averages of OBV to determine bullish or bearish momentum shifts, anomalities, breakouts where banks flow their funds in or Smart Money Concepts trade.
Moving Averages (MA):
Multiple MA Types: Includes Simple Moving Average (SMA), Exponential Moving Average (EMA), Weighted Moving Average (WMA), Hull Moving Average (HMA), and Volume-Weighted Moving Average (VWMA), selectable via input parameters.
MA Speed Calculation: Measures the percentage change in MA values to determine the direction and speed of the trend.
Range Filtering:
Variance-Based Filter: Utilizes variance and moving averages to filter out trades during low-volatility periods, enhancing trade quality.
Color-Coded Range Indicators: Visualizes range filtering with color changes on the chart for quick assessment.
Scalping Mechanism:
Heikin-Ashi Candles: Optionally uses Heikin-Ashi candles for smoother price action analysis.
EMA-Based Trend Detection: Employs fast, medium, and slow EMAs to determine trend direction and potential entry points.
Fractal-Based Filtering: Detects regular or BW (Black & White) fractals to confirm trade signals.
Take Profit (TP) Management:
Dynamic TP Levels: Calculates TP levels based on the number of consecutive long or short entries, adjusting targets to maximize profits.
TP Signals and Re-Entry: Plots TP signals on the chart and allows for automatic re-entry upon TP hit, maintaining continuous trade flow.
Risk Management:
Commission Integration: Accounts for trading commissions to ensure net profitability.
Position Sizing: Configured to use a percentage of equity for each trade, adjustable via input parameters.
Pyramiding: Allows up to one additional position per direction to enhance gains during strong trends.
Alerts and Visual Indicators:
Buy/Sell Signals: Plots visual indicators (triangles and flags) on the chart to signify entry and TP points.
Bar Coloring: Changes bar colors based on ADX and trend conditions for immediate visual cues.
Price Levels: Marks significant price levels related to TP and position entries with cross styles.
Input Parameters
Source Settings:
Custom Sources (srcinput): Choose from various price and volume sources to tailor indicator calculations.
ADX Settings:
ADX Type (ADX_options): Select between 'CLASSIC' and 'MASANAKAMURA' methods.
ADX Length (ADX_len): Defines the period for ADX calculation.
ADX Threshold (th): Sets the minimum ADX value to consider a strong trend.
RSI Settings:
RSI Length (len_3): Period for RSI calculation.
RSI Source (src_3): Source data for RSI.
Trend Strength Settings:
Channel Length (n1): Period for trend channel calculation.
Average Length (n2): Period for smoothing trend strength.
Jurik Moving Average (JMA) Settings:
JMA Source (inp): Source data for JMA.
JMA Resolution (reso): Timeframe for JMA calculation.
JMA Repainting (rep): Option to allow JMA to repaint.
JMA Length (lengths): Period for JMA.
Parabolic SAR Settings:
SAR Start (start): Initial acceleration factor.
SAR Increment (increment): Acceleration factor increment.
SAR Maximum (maximum): Maximum acceleration factor.
SAR Point Width (width): Visual width of SAR points.
Trend Indicator Settings:
Trend Timeframe (timeframe): Period for trend indicator calculations.
Momentum Settings:
Source Type (srcType): Select between 'Price' and 'VWAP'.
Momentum Source (srcPrice): Source data for momentum calculations.
RSI Length (rsiLen): Period for momentum RSI.
Smooth Length (sLen): Smoothing period for momentum RSI.
OBV Settings:
OBV Line 1 (e1): EMA period for OBV line 1.
OBV Line 2 (e2): EMA period for OBV line 2.
Moving Average (MA) Settings:
MA Length (length): Period for MA calculations.
MA Type (matype): Select MA type (1: SMA, 2: EMA, 3: HMA, 4: WMA, 5: VWMA).
Range Filter Settings:
Range Filter Length (length0): Period for range filtering.
Range Filter Multiplier (mult): Multiplier for range variance.
Take Profit (TP) Settings:
TP Long (tp_long0): Percentage for long TP.
TP Short (tp_short0): Percentage for short TP.
Scalping Settings:
Scalping Activation (ACT_SCLP): Enable or disable scalping.
Scalping Length (HiLoLen): Period for scalping indicators.
Fast EMA Length (fastEMAlength): Period for fast EMA in scalping.
Medium EMA Length (mediumEMAlength): Period for medium EMA in scalping.
Slow EMA Length (slowEMAlength): Period for slow EMA in scalping.
Filter (filterBW): Enable or disable additional fractal filtering.
Pullback Lookback (Lookback): Number of bars for pullback consideration.
Use Heikin-Ashi Candles (UseHAcandles): Option to use Heikin-Ashi candles for smoother trend analysis.
Strategy Logic
Indicator Calculations:
Volume and Source Selection: Determines the primary data source based on user input, ensuring flexibility and adaptability.
ADX Calculation: Computes ADX using either the Classic or Masanakamura method to assess trend strength.
RSI Calculation: Evaluates market momentum using RSI, further smoothed with custom periods.
Trend Strength Assessment: Utilizes trend channel and average lengths to gauge the robustness of current trends.
Jurik Moving Average (JMA): Smooths price data to reduce lag and enhance trend detection.
Parabolic SAR: Identifies potential trend reversals with adjustable parameters for sensitivity.
Momentum Analysis: Combines RSI with DEMA and OBV-based conditions to confirm bullish or bearish momentum.
Moving Averages: Employs multiple MA types to determine trend direction and speed.
Range Filtering: Filters out low-volatility periods to focus on high-probability trades.
Trade Conditions:
Long Entry Conditions:
ADX Confirmation: ADX must be above the threshold, indicating a strong uptrend.
RSI and Momentum: RSI below 70 and positive momentum signals.
JMA and SAR: JMA indicates an uptrend, and Parabolic SAR is below the price.
Trend Indicator: Confirms the current trend direction.
Range Filter: Ensures market is in an upward range.
Scalping Option: If enabled, additional scalping conditions must be met.
Short Entry Conditions:
ADX Confirmation: ADX must be above the threshold, indicating a strong downtrend.
RSI and Momentum: RSI above 30 and negative momentum signals.
JMA and SAR: JMA indicates a downtrend, and Parabolic SAR is above the price.
Trend Indicator: Confirms the current trend direction.
Range Filter: Ensures market is in a downward range.
Scalping Option: If enabled, additional scalping conditions must be met.
Position Management:
Entry Execution: Places long or short orders based on the identified conditions and user-selected position types (Longs, Shorts, or Both).
Take Profit (TP): Automatically sets TP levels based on predefined percentages, adjusting dynamically with consecutive trades.
Re-Entry Mechanism: Allows for automatic re-entry upon TP hit, maintaining active trading positions.
Exit Conditions: Closes positions when TP levels are reached or when opposing trend signals are detected.
Visual Indicators:
Bar Coloring: Highlights bars in green for bullish conditions, red for bearish, and orange for neutral.
Plotting Price Levels: Marks significant price levels related to TP and trade entries with cross symbols.
Signal Shapes: Displays triangle and flag shapes on the chart to indicate trade entries and TP hits.
Alerts:
Custom Alerts: Configured to notify traders of long entries, short entries, and TP hits, enabling timely trade management and execution.
Usage Instructions
Setup:
Apply the Strategy: Add the script to your TradingView chart set to BTCUSDT with a 65-minute timeframe.
Configure Inputs: Adjust the input parameters under their respective groups (e.g., Source Settings, ADX, RSI, Trend Strength, etc.) to match your trading preferences and risk tolerance.
Position Selection:
Choose Position Type: Use the Position input to select Longs, Shorts, or Both based on your market outlook.
Execution: The strategy will automatically execute and manage positions according to the selected type, ensuring targeted trading actions.
Signal Interpretation:
Buy Signals: Blue triangles below the bars indicate potential long entry points.
Sell Signals: Red triangles above the bars indicate potential short entry points.
Take Profit Signals: Flags above or below the bars signify TP hits for long and short positions, respectively.
Bar Colors: Green bars suggest bullish conditions, red bars indicate bearish conditions, and orange bars represent neutral or consolidating markets.
Risk Management:
Default Position Size: Set to 100% of equity. Adjust the default_qty_value as needed for your risk management strategy.
Commission: Accounts for a 0.1% commission per trade. Adjust the commission_value to match your broker's fees.
Pyramiding: Allows up to one additional position per direction to enhance gains during strong trends.
Backtesting and Optimization:
Historical Testing: Utilize TradingView's backtesting features to evaluate the strategy's performance over historical data.
Parameter Tuning: Optimize input parameters to align the strategy with current market dynamics and personal trading objectives.
Alerts Configuration:
Set Up Alerts: Enable and configure alerts based on the predefined alertcondition statements to receive real-time notifications of trade signals and TP hits.
Additional Features
Comprehensive Indicator Integration: Combines multiple technical indicators to provide a holistic view of market conditions, enhancing trade signal accuracy.
Scalping Options: Offers an optional scalping mechanism to capitalize on short-term price movements, increasing trading flexibility.
Dynamic Take Profit Levels: Adjusts TP targets based on the number of consecutive trades, maximizing profit potential during favorable trends.
Advanced Volume Analysis: Utilizes various volume indicators to confirm trend strength and validate trade signals.
Customizable Range Filtering: Filters trades based on market volatility, ensuring trades are taken during optimal conditions.
Heikin-Ashi Candle Support: Optionally uses Heikin-Ashi candles for smoother price action analysis and reduced noise.
====Recommendations====
Thorough Backtesting:
Historical Performance: Before deploying the strategy in a live trading environment, perform comprehensive backtesting to understand its performance under various market conditions. These are the premium settings for Avalanche Coinbase.
Optimization: Regularly review and adjust input parameters to ensure the strategy remains effective amidst changing market volatility and trends. Backtest the strategy for each crypto and make sure you are in the right brokage when using the volume sources as it will affect the overall outcome of the trading strategy.
Risk Management:
Position Sizing: Adjust the default_qty_value to align with your risk tolerance and account size.
Stop-Loss Implementation: Although the strategy includes TP levels, they're also consided to be a stop-loss mechanisms to protect against adverse market movements.
Commission Adjustment: Ensure the commission_value accurately reflects your broker's fees to maintain realistic backtesting results. Generally, 0.1~0.3% are most of the average broker's comission fees.
Slipage: The slip comssion is 1 Tick, since the strategy is adjusted to only enter/exit on bar close where most positions are available.
Continuous Monitoring:
Strategy Performance: Regularly monitor the strategy's performance to ensure it operates as expected and make adjustments as needed. A max-drawndown hit has been added to operate in case the premium Avalanche settings go wrong, but you can turn it off an adjust the equity percentage to 50% if you are confortable with the high volatile max-drown or even 100% if your account allows you to borrow cash.
Customization:
Indicator Parameters: Tailor indicator settings (e.g., ADX length, RSI period, MA types) to better fit your specific trading style and market conditions.
Scalping Options: Enable or disable scalping based on your trading preferences and risk appetite.
Conclusion
Gabriel's Witcher Strategy is a robust and versatile trading solution designed to navigate the complexities of the Crypto market. By integrating a wide array of technical indicators and providing extensive customization options, this strategy empowers traders to execute informed and strategic trades. Its comprehensive approach, combining trend analysis, momentum detection, volume evaluation, and range filtering, ensures that trades are taken during optimal market conditions. Additionally, the inclusion of scalping features and dynamic take-profit management enhances the strategy's adaptability and profitability potential. Unlike any trading strategy, with both diligent testing and continuous monitoring under the strategy tester, it's possible to achieve sustained success by adjusting the settings to the individual Crypto that need it, for example this one is preset for Avalanche Coinbase 65 Miinutes but it can be adjust for BTCUSD or Etherium if you backtest and search for the right settings.

Fractal Breakout Trend Following StrategyOverview
The Fractal Breakout Trend Following Strategy is a trend-following system which utilizes the Willams Fractals and Alligator to execute the long trades on the fractal's breakouts which have a high probability to be the new uptrend phase beginning. This system also uses the normalized Average True Range indicator to filter trades after a large moves, because it's more likely to see the trend continuation after a consolidation period. Strategy can execute only long trades.
Unique Features
Trend and volatility filtering system: Strategy uses Williams Alligator to filter the counter-trend fractals breakouts and normalized Average True Range to avoid the trades after large moves, when volatility is high
Configurable Trading Periods: Users can tailor the strategy to specific market windows, adapting to different market conditions.
Flexible Risk Management: Users can choose the stop-loss percent (by default = 3%) for trades, but strategy also has the dynamic stop-loss level using down fractals.
Methodology
The strategy places stop order at the last valid fractal breakout level. Validity of this fractal is defined by the Williams Alligator indicator. If at the moment of time when price breaking the last fractal price is higher than Alligator's teeth line (8 period SMA shifted 5 bars in the future) this is a valid breakout. Moreover strategy has the additional volatility filtering system using normalized ATR. It calculates the average normalized ATR for last user-defined number of bars and if this value lower than the user-defined threshold value the long trade is executed.
When trade is opened, script places the stop loss at the price higher of two levels: user defined stop-loss from the position entry price or down fractal validation level. The down fractal is valid with the rule, opposite as the up fractal validation. Price shall break to the downside the last down fractal below the Willians Alligator's teeth line.
Strategy has no fixed take profit. Exit level changes with the down fractal validation level. If price is in strong uptrend trade is going to be active until last down fractal is not valid. Strategy closes trade when price hits the down fractal validation level.
Risk Management
The strategy employs a combined approach to risk management:
It allows positions to ride the trend as long as the price continues to move favorably, aiming to capture significant price movements. It features a user-defined stop-loss parameter to mitigate risks based on individual risk tolerance. By default, this stop-loss is set to a 3% drop from the entry point, but it can be adjusted according to the trader's preferences.
Justification of Methodology
This strategy leverages Williams Fractals to open long trade when price has broken the key resistance level to the upside. This resistance level is the last up fractal and is shall be broken above the Williams Alligator's teeth line to be qualified as the valid breakout according to this strategy. The Alligator filtering increases the probability to avoid the false breakouts against the current trend.
Moreover strategy has an additional filter using Average True Range(ATR) indicator. If average value of ATR for the last user-defined number of bars is lower than user-defined threshold strategy can open the long trade according to open trade condition above. The logic here is following: we want to open trades after period of price consolidation inside the range because before and after a big move price is more likely to be in sideways, but we need a trend move to have a profit.
Another one important feature is how the exit condition is defined. On the one hand, strategy has the user-defined stop-loss (3% below the entry price by default). It's made to give users the opportunity to restrict their losses according to their risk-tolerance. On the other hand, strategy utilizes the dynamic exit level which is defined by down fractal activation. If we assume the breaking up fractal is the beginning of the uptrend, breaking down fractal can be the start of downtrend phase. We don't want to be in long trade if there is a high probability of reversal to the downside. This approach helps to not keep open trade if trend is not developing and hold it if price continues going up.
Backtest Results
Operating window: Date range of backtests is 2023.01.01 - 2024.05.01. It is chosen to let the strategy to close all opened positions.
Commission and Slippage: Includes a standard Binance commission of 0.1% and accounts for possible slippage over 5 ticks.
Initial capital: 10000 USDT
Percent of capital used in every trade: 30%
Maximum Single Position Loss: -3.19%
Maximum Single Profit: +24.97%
Net Profit: +3036.90 USDT (+30.37%)
Total Trades: 83 (28.92% win rate)
Profit Factor: 1.953
Maximum Accumulated Loss: 963.98 USDT (-8.29%)
Average Profit per Trade: 36.59 USDT (+1.12%)
Average Trade Duration: 72 hours
These results are obtained with realistic parameters representing trading conditions observed at major exchanges such as Binance and with realistic trading portfolio usage parameters.
How to Use
Add the script to favorites for easy access.
Apply to the desired timeframe and chart (optimal performance observed on 4h and higher time frames and the BTC/USDT).
Configure settings using the dropdown choice list in the built-in menu.
Set up alerts to automate strategy positions through web hook with the text: {{strategy.order.alert_message}}
Disclaimer:
Educational and informational tool reflecting Skyrex commitment to informed trading. Past performance does not guarantee future results. Test strategies in a simulated environment before live implementation

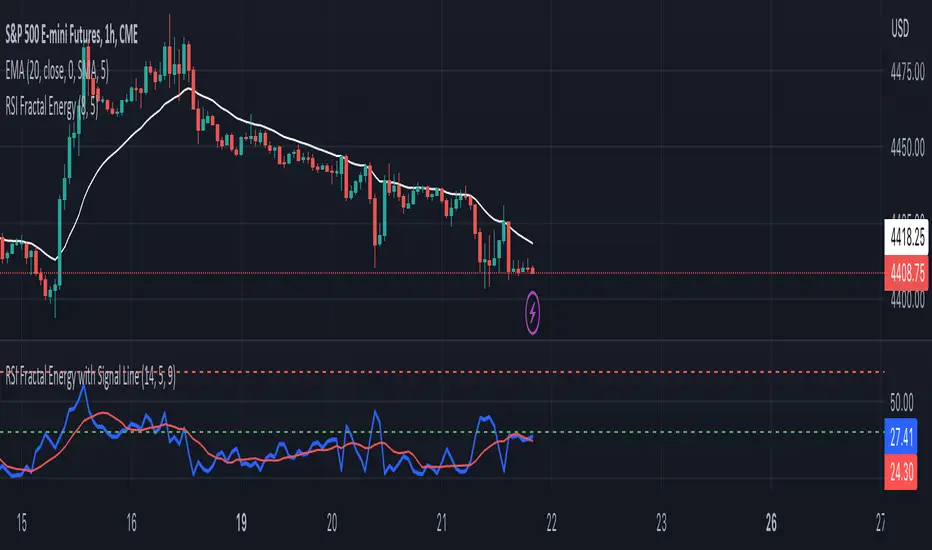
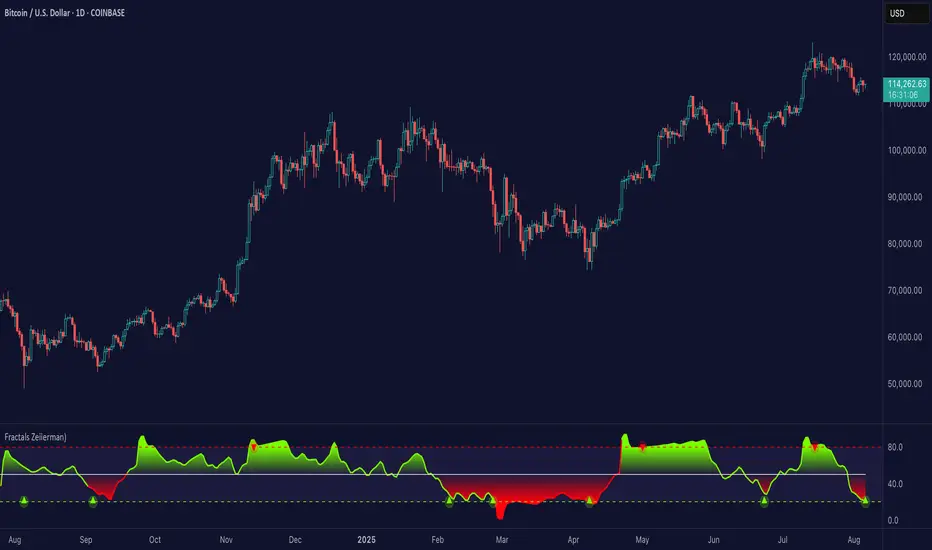
RSI Fractal Energy with Signal LineHere is my second script.
Introducing the RSI Fractal Energy Indicator.
This incorporates the Relative-Strength Index and Fractal Energy as the name implies.
This will help the trader identify:
1. Trend Strength: The higher the value of the indicator can indicate the strength of the trend and vice versa.
2. Reversal points: If the indicator is showing weakness and the market is making higher highs and lower lows this can indicate a reversal is possible.
3. Overbought and Oversold conditions: This indicator is currently set to 30(Oversold) and 70(Overbought), but this can be changed in the source code.
I also added a signal line to provide bullish/bearish crossovers.
I use this indicator on the 1 hr chart, but it can be used on any time frame.
Please let me know if you have any questions, comments, or concerns. Always open to learning more.
I will also provide updates as I continue to use my indicators.
Happy trading!
Market Structure CHoCH/BOS (Fractal) [LuxAlgo]The Market Structure CHoCH/BOS (Fractal) indicator is an experimental take on classical market structure, whereas fractal patterns are used for their construction instead of swing points.
Compared to utilizing swing points for highlighting market structure like our Smart Money Concepts indicator , fractal-based market structure can appear as more adaptive, however, it can also be more restrictive when it comes to returning swing points which can cause the indicator to miss reversals in some cases.
If enabled from within the settings, users can see support and resistance levels returned from the detected market structure with breakouts highlighted on the chart. Alongside this feature, an additional dashboard showing the structure to fractal structure percentage is also provided.
🔶 SETTINGS
Length: Length of the fractal patterns to detect.
🔹 Style
Bullish Structures: Show bullish structures.
Bearish Structures: Show bullish structures.
Support: Show support levels.
Resistance: Show resistance levels.
🔹 Dashboard
Show Dashboard: Show structure to fractal percentage dashboard on the chart.
Location: Location of the dashboard on the chart.
Size: Dashboard size.
🔶 USAGE
Market structure is commonly used to determine trend direction by using price positions relative to prior swing points. Using fractal patterns to determine market structure can allow users to obtain shorter, more frequent structure labels.
Market structure is commonly classified as follows:
Change of Character (CHoCH), also referred to as Market Structure Shift (MSS)
Break of Structure (BOS), also referred to as Market Structure Break (MSB)
Change of Characters indicate a shift in the market trend, confirming trend reversals. Break of Structures on the other hand occur once a trend is already determined, confirming new higher highs/lower lows.
Using higher length values allow users to detect longer-term fractals, thus highlighting longer-term market structures. The image above detects fractal patterns made of 7 candles, even if the increment is only of 2 bars this significantly reduces the amount of detected market structure labels.
The result obtained by utilizing fractals and higher settings can be a more dynamic view of market structure, however, as seen in the image above this can introduce very significant delay compared to utilizing pure swing points.
🔹 Support/Resistance
The indicator also returns support/resistance levels constructed from the market structure, these levels are obtained similarly to order blocks, finding the minimum on the interval of a bullish market structure and the maximum of a bearish market structure.
Price reaching a support/resistance level can be expected to bounce from it. Once a level is broken, the support/resistance level will no longer extend, and a circle will be displayed highlighting the break.
While utilizing this script for fractal-based market structure, these levels can be useful to ensure all swing points are still considered by the user with the possibility of the indicator missing reversals due to its calculation not being based on swing points themselves.
🔹 Dashboard
The dashboard reports the structure to fractal percentage, that is the amount of bullish/bearish market structures relative to the total amount of detected bullish/bearish fractal patterns.
This allows us to see how often a detected fractal pattern is used to display a market structure.
🔶 DETAILS
🔹 Fractals
In the context of technical analysis, Fractals refer to specific patterns that exhibit self-similarity at different scales or timeframes.
The most commonly known fractal pattern consists of a consecutive sequence of candles (more commonly 5), with the central candle being the lowest (in case of a bullish fractal) or highest (in case of a bearish fractal).
A bullish fractal has candles on the right side of the central candle with increasing lows, while candles on the left side have decreasing lows.
A bearish fractal has candles on the right side of the central candle with decreasing highs, while candles on the left side have increasing highs.
🔶 RELATED SCRIPTS
🔹 Smart Money Concepts
🔹 Market Structure Trailing Stop
🔹 ICT Concepts

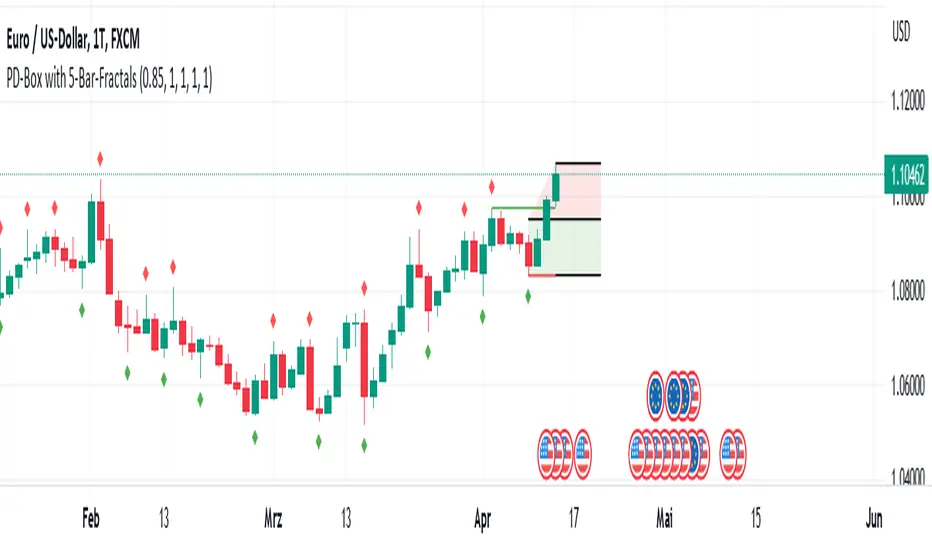
PD-Box with Fractal Points V1 (by Jonny86FXPro)PD-Box with Fractal Points V1 (by Jonny86FXPro)
This indicator has several functions:
Premium/Discount Box: The two most recent fractal highs and lows form a premium/discount box that provides valuable information about potential price movements.
Fractal Breaker Lines: Two fractal breaker lines are integrated for the high and low points to better visually represent the break of a fractal point.
Customizable: The genius of this indicator is that you can customize everything to your own needs. Whether you want to display lines, or change the colors of the box or lines, everything is possible.
Automatic Adjustment: Once a fractal point is broken, the premium discount automatically adjusts to the current price. Once a new fractal point is formed, the box is automatically adjusted again.
HTF Analysis: Use this indicator for your HTF analysis and determine in which direction the price could develop.
Premium Discount Box Information: When the price is in the premium range, there is a higher probability of a sell-off. However, if the price breaks upward, there is a good chance that it will continue to rise. The opposite is true for the discount range.
Power Behind Each Move: It is important how the price hits the fractal point. If there is power behind each move, the chances are very good that it will continue in that direction. If there is no real power behind it, it could be an indication of a trend reversal.
Weak Breaks: In the premium range, a weak upward break could lead to a bearish move, and in the discount range, a weak downward break through the fractal low point could lead to a move in the bullish direction.
As you can see, this powerful indicator has many functions that can help you determine trend direction and potential price movements.
Quick overview of functions:
Designed for higher timeframes such as 4H chart.
Identifies the last two fractal highs and lows to create a premium/discount box.
Includes two fractal breaker lines for the high and low points to better visually represent fractal breaks.
Customizable to fit individual needs, including the ability to show/hide lines and change box/line colors.
Automatically adjusts premium/discount levels to current price when a fractal point is broken.
Can be used for higher timeframe analysis to determine potential price direction.
Premium/discount box provides insight into potential market direction based on price movement within its range.
Fractal break with strong market momentum indicates a higher chance of trend continuation.
Fractal break with weak market momentum may suggest a potential trend reversal.
A powerful indicator that can greatly assist in determining trend direction.
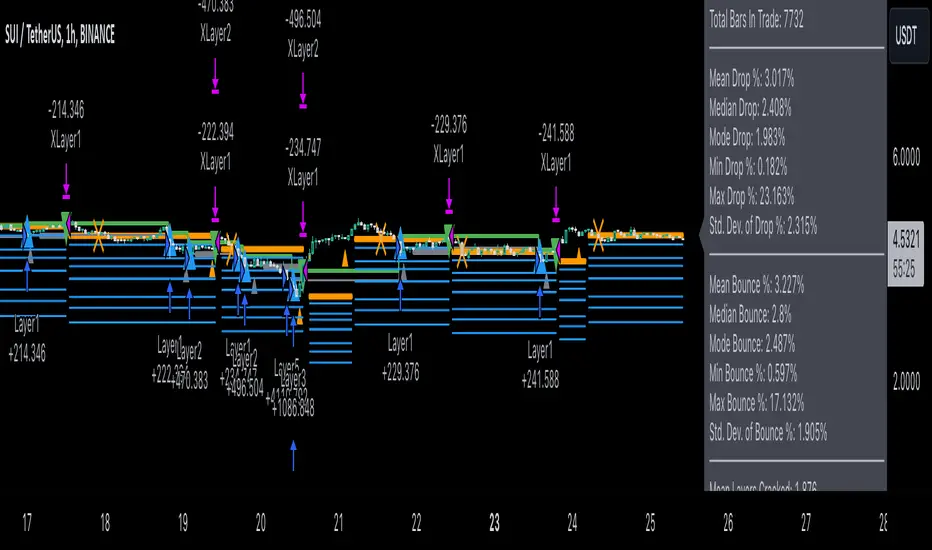
Dollar cost averaging trading system (DCA)As investors, we often face the dilemma of willing high stock prices when we sell, but not when we buy. There are times when this dilemma causes investors to wait for a dip in prices, thereby potentially missing out on a continual rise. This is how investors get lured away from the markets and become tangled in the slippery slope of market timing, which is not advisable to a long-term investment strategy.
Skyrex developed a complex trading system based on dollar-cost averaging in Quick Fingers Luc's interpretation. It is a combinations of strategies which allows to systematically accumulate assets by investing scaled amounts of money at defined market cycle global support levels. Dollar-cost averaging can reduce the overall impact of price volatility and lower the average cost per asset thus even during market slumps only a small bounce is required to reach take profit.
The strategy script monitors a chart price action and identifies bases as they form. When bases are reached the script provides entry actions. During price action development an asset value can go lower and in this way the script will perform safety entries at each subsequent accumulation levels. When weighted average entry price reaches target profit the script will perform a take profit action.
Bases are identified as pivot lows in a fractal pattern and validated by an adjustable decrease/rise percentage to ensure significancy of identified bases. To qualify a pivot low, the indicator will perform the following validation:
Validate the price rate of change on drops and bounces is above a given threshold amount.
Validate the volume at the low pivot point is above the volume moving average (using a given length).
Validate the volume amount is a given factor of magnitude above is above the volume moving average.
Validate the potential new base is not too close to the previous range by using a given price percent difference threshold amount.
A fractal pattern is a recurring pattern on a price chart that can predict reversals among larger, more chaotic price movements.
These basic fractals are composed of five or more bars. The rules for identifying fractals are as follows:
A bearish turning point occurs when there is a pattern with the highest high in the middle and two lower highs on each side.
A bullish turning point occurs when there is a pattern with the lowest low in the middle and two higher lows on each side.
Basic dollar-cost averaging approach is enhances by implementation of adjustable accumulation levels in order to provide opportunity of setting them at defined global support levels and Martingale volume coefficient to increase averaging effect. According to Quick Fingers Luc's principles trading principles we added volume validation of a base because it allows to confirm that the market is resistant to further price decrease.
The strategy supports traditional and cryptocurrency spot, futures, options and marginal trading exchanges. It works accurately with BTC, USD, USDT, ETH and BNB quote currencies. Best to use with 1H timeframe charts and limit orders. The strategy can be and should be configured for each particular asset according to its global support and resistance levels and price action cycles. You can modify levels and risk management settings to receive better performance
Advantages of this script:
Strategy has high net profit of 255% at backtests
Backtests show high accuracy around 75%
Low Drawdowns of around 14% at backtests
Strategy is sustainable to market slumps and can be used for long-term trading
The strategy provides a large number of entries which is good for diversification
Can be applied to any market and quote currency
Easy to configure user interface settings
How to use?
1. Apply strategy to a trading pair your are interested in using 1H timeframe chart
2. Configure the strategy: change layer values, order size multiple and take profit/stop loss values according to current market cycle stage
3. Set up a TradingView alert to trigger when strategy conditions are met
4. Strategy will send alerts when to enter and when to exit positions which can be applied to your portfolio using external trading platforms
5. Update settings once market conditions are changed using backtests on a monthly period
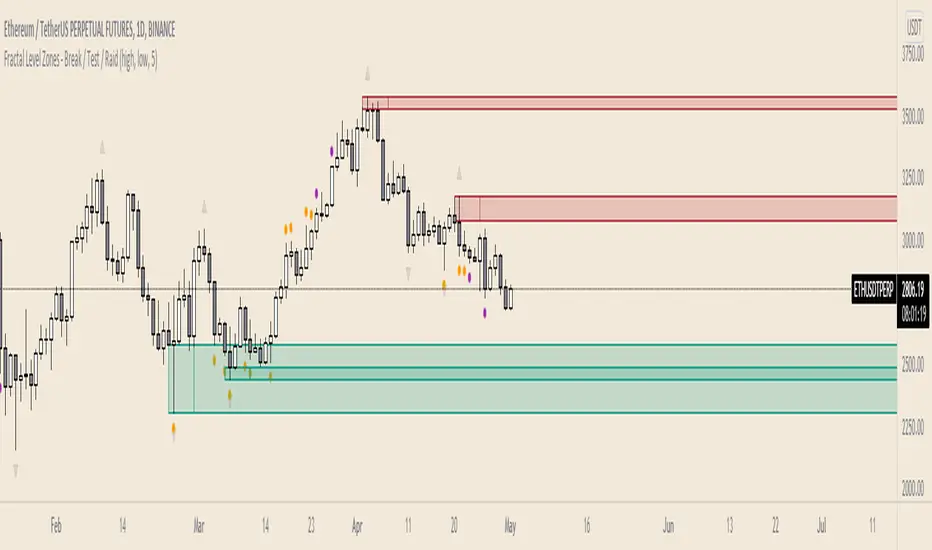
Fractal Level Zones - Break / Test / RaidFractal Level Zones - Break / Test / Raid
An experimental script that marks out the last two unbroken fractal high and low zones. The aim of the script is to focus on the type of candles that form and close in a zone. They can either tap into the zone or break them.
There are a number of outcomes:
- Break
- Break and retest
- Reversal
- Raid
When a zone is broken, the next untested fractal zone is printed.
How to use:
The indicator is to be used on higher time frames (M,W,D/4H). Monitor the type of candles that in form a zone (Daily TF recommended)
Default icon colours
Orange - Test of Zone
Purple - Break of fractal (can also be a raid)
Alert function included
Indicator in Use
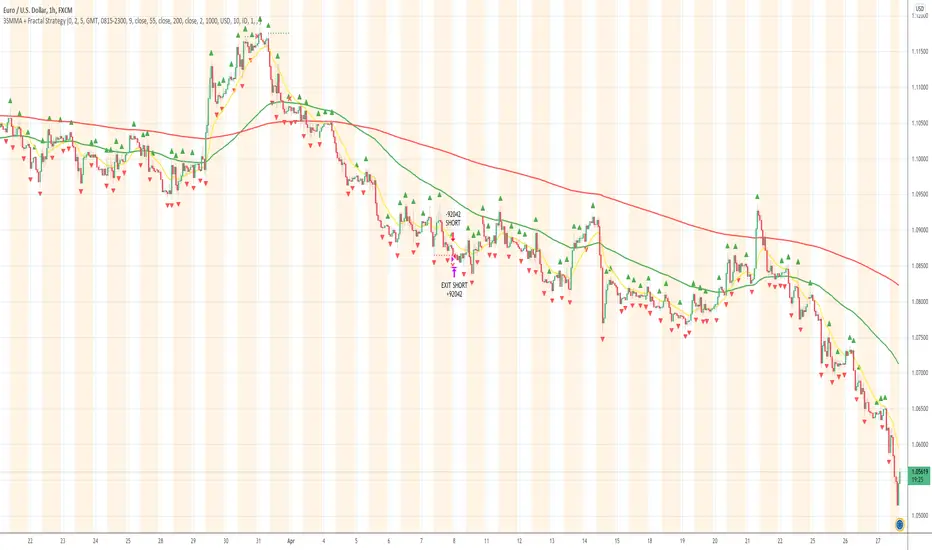
3SMMA + Fractal Strategy [Kintsugi Trading]What is the 3SMMA + Fractal Strategy?
This premium indicator was inspired by my desire to find and place high probability forex trades in any market, direction, or time of day.
Why Forex?
The Forex markets operate 24 hours, 5.5 days a week
Access to meaningful leverage
Ability to easily trade long or short
High liquidity
How to use it!
----- First, start by choosing Breakout Additional PIP Size, Stop Additional PIP Size, and Target Profit (TP) PIP Size. -----
- Breakout Additional PIP Size = Additional PIPs beyond the default strategy entry point.
- Stop Additional PIP Size = The default stop is above/below the signal candle, depending on trade direction. This input allows the user to target more or less PIPs as a stopping-out point.
- Target Profit (TP) PIP Size = Number of PIPs set at a target profit.
----- Next, we set the Session Filter. -----
Set the Timezone and Trade Session you desire. If no specific session is desired, simply leave the box unchecked.
----- Next, we set the Length of the 3 Smoothed Moving Averages. -----
Enter the Desired Moving Average Length:
Length 1 - Source
Length 2 - Source
Length 3 - Source
These inputs will determine whether the strategy looks for Long or Short positions.
----- Next, we set the Fractal Periods. -----
This user input re-programs the strategy to only allow for 'n' number of lower or higher candles on either side of a fractal signal.
For example: If the user inputs "5" for the number of Periods, Fractal indicator signals will only appear on candles with "5" candles higher or lower on both sides of the signal candle.
In combination with the 3 Smoothed Moving Averages, the Fractal signals help us determine when to take a trade and in what direction.
The strategy is essentially looking for trades going with the overall trend and placing potential trades after a low has been reached and is re-tested in the overall trend direction.
----- Finally, we backtest our ideas. -----
After using the 'Strategy Tester' tab on TradingView to thoroughly backtest your predictions you are ready to take it to the next level - Automated Trading!
This was my whole reason for creating the script. If you work a full-time job, live in a time zone that is hard to trade, or just don't have the patience, this will be a game-changer for you as it was for me.
Auto-Trading
When it comes to auto-trading this strategy I have included two options in the script that utilize the alert messages generated by TradingView.
*Note: Please trade on a demo account until you feel comfortable enough to use real money, and then please stick to 1%-2% of your total account value in risk per trade.*
AutoView
PineConnector
Good luck with your trading!
Eliza Ellis Improved FractalsA little side project of mine. may enhance further in the future. Used best for scalping. The longer you're in the market the more the news is waiting to eat you so I'd recommend using high volume and getting in and out quickly

iTradeAIMS | The BOX IndicatorIntroduction to iTradeAIMS The Box Indicator
Here I will attempt to give a brief introduction to this amazing indicator that has revolutionised my trading since 2009.
Everything in the universe is energy and energy follows the path of least resistance. When it moves it heavily influenced by a structure.
When energy flows it reacts to the underlying structure. Electricity flows through copper wires easily compared to "my arm".
A river flows smoothly on flat plains of the land but becomes violent when flowing down a mountain. Why is this? Why does it change its behaviour?
The Science of Chaos Brings us here. Everything in the universe has an internal or underlying structure. That structure is often, but not always, hidden.
The Market has an underlying Unseen Structure. And it can be revealed by using this indicator. TSX:TSL
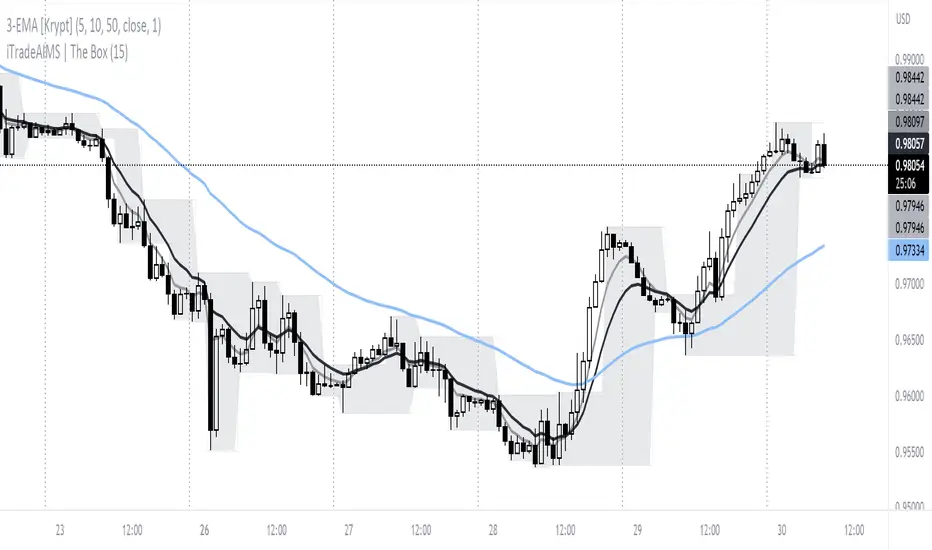
Anatomy of the Box
The iTradeAIMS Boxes are formed using the high and low of the fractals.
A new AIMS Box will be created whenever price makes a new high or low Fractal.
The bottom of the AIMS Box – the Lower AIMS Level - is created when a low Fractal is formed i.e. the low of a candle is lower than two candles to the left and two candles to the right.
What is the Underlying Structure of the Market?
The underlying structure of the Market is Elliott Wave .
And the Underlying Structure of the Elliott Wave is the Fractals.
This BOX is an indicator based on the Fractals.
The Upper and Lower Levels require a minimum of five bars with the top of the box being the upper Fractal; the bottom of the box, the lower Fractal
The AIMS Levels are the high and low of the AIMS Box – the upper and lower Fractals.
This indicator, by itself, provided the concept that revolutionised my trading.
What are the Benefits of Using AIMS iTradeAIMS The Box?
1. Identify Trend:
The Box will also help you identify Trending Markets.
The Stepping Up pattern it creases is an indication of UPTREND .
The Stepping Down pattern indicates DOWNTREND .
2. Identify Entry Points
The Box will help you identify Entry Points into the market.
There are two ways it helps you make entries into the market.
a) breakout entry
b) trend following entry
3. Identify Range-Bound Market
The Box helps identify a sideways range-bound market.
When the box is not creating either a stepping up or stepping down pattern, it usually indicates to a sideways or rangebound market on that time frame.
4. Help you Make Entries: Calculate Correct Positions Size and Risk Size
The BOX is the structure of the market that offers the best method of How to calculate Risk Per Trade based on the market generated information.
Calculate your Entry Level and Stop Loss level using the Box Levels on either side of the box.
Buying the Box:
Set a Buy Order a Point above the Box and Stop Loss a point below the Box Low.
Selling the Box
Set a Sell Order a Point Below the Box Low and Stop Loss a Point Above the Box High.
TSLA Entries and Exits for Tesla Stock
I took this trade on the box high of this stock OII
I shared the Idea on TradingView as a Buy Signal on OII
Check the BitCoin Entry Here
5. Stop Loss Trailing Mechanism to Lock in Profits
The box levels are used for Trailing Stops.
For Long (Buy) Orders use the box low as a stop loss level for trailing and locking-in profits.
For Shorts (Sell) Orders, use the Box High levels for trailing stop and lock in profits.
6. Support and Resistance
The Box Levels (upper and lower) clearly shows support and resistance – where price approached a level and could not go further, forcing it to retrace on itself.
Pay attention to how box levels create ranges and also indicate trends.
How to Use this Indicator with other Indicators?
This indicator is great on its own but even greater if used in conjunction with iTradeAIMS The Wave and The Gator and The Magic Purple (Script Available FREE to use on iTradeAIMS Profile)
> The market always creates an AIMS Box before it turns around.
> Every trend starts and ends with an AIMS Box.
> Entries are always taken on the breakout of the AIMS Box.
How to Get Access to This Script?
Enjoy and accept it as my gift to the TradingView Community from iTradeAIMS | This Indicator is now available to everyone for FREE.
Credits: I learned the method from Bill Williams of Profitunity.com All credits, thanks, gratitude, positive vibes, and prayers goes to Dr Williams 🥇 (RIP) and his family ❤.
Fractals (Expo)
Fractals (Expo) make use of fractals to identify trends and reversals. The indicator is designed to adapt smoothly and quickly to significant price moves in order to identify trend reversals as well as filtering out noise in an established trend. The indicator is simple to use and understand therefore valuable to all trading styles.
The user has the ability to enable a custom input source which gives the user great flexibility and full control over what the calculations should be based on. The default input source is fractals from the swing points of the market.
Real-Time Trend Alerts
No Repainting
Works on any market and in any timeframe
HOW TO USE
Use the indicator to gain insights into trends and trend reversals.
Identify Trends
Identify Trend reversals
Use it as a Trend filter
INDICATOR IN ACTION
Daily Chart
I hope you find this indicator useful , and please comment or contact me if you like the script or have any questions/suggestions for future improvements. Thanks!
I will continually work on this indicator, so please share your experience and feedback as it will enable me to make even better improvements. Thanks to everyone that has already contacted me regarding my scripts. Your feedback is valuable for future developments!
-----------------
Disclaimer
Copyright by Zeiierman.
The information contained in my scripts/indicators/ideas does not constitute financial advice or a solicitation to buy or sell any securities of any type. I will not accept liability for any loss or damage, including without limitation any loss of profit, which may arise directly or indirectly from the use of or reliance on such information.
All investments involve risk, and the past performance of a security, industry, sector, market, financial product, trading strategy, or individual’s trading does not guarantee future results or returns. Investors are fully responsible for any investment decisions they make. Such decisions should be based solely on an evaluation of their financial circumstances, investment objectives, risk tolerance, and liquidity needs.
My scripts/indicators/strategies/ideas are only for educational purposes!
ACCESS THE INDICATOR
• Contact me on TradingView or use the links below
Fractal_Trend_MTFFractal_Trend_MTF - 3 fractal trend time frames in 1
Ability to view the fractal trend of 3 times frames in one indicator
Time frames are user configurable
Turn on/off agreement highlights
Specify if a candles needs to close above/below a fractal level to consider it broken - or just break it with its high/low
Alerts enabled for each time-frame and for when all time frames are all in agreement
Usage Note: To accurately display the fractal trends the chart must be opened on a time-frame that is equal to or less than the lowest time-frame specified in the indicator. Tradingview can accurately display higher time frame information on a lower time frame chart but not vice-versa. e.g If the lowest time frame selected is the H1 then view the indicator on the H1 chart or below.

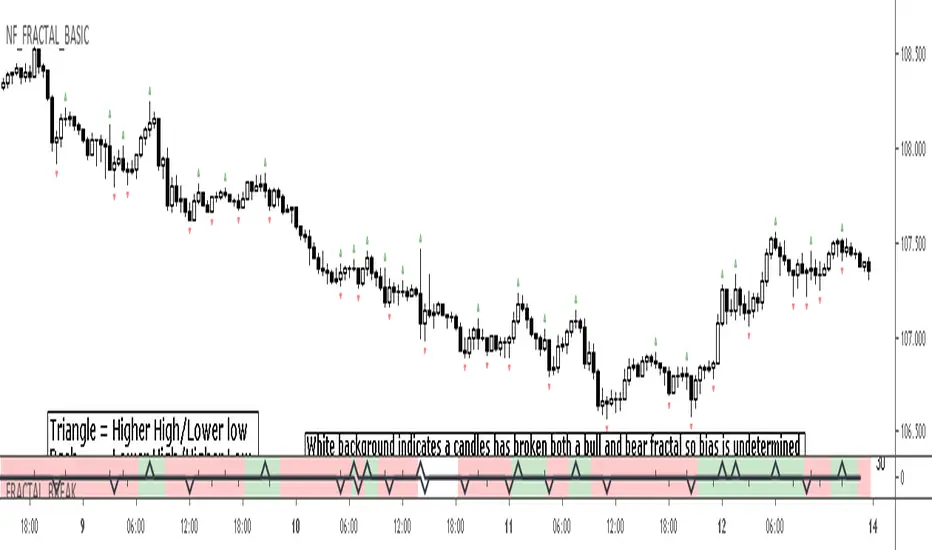
FRACTAL_BREAK - fractal trend analysis
Highlights areas on the chart where Higher Highs or Lower Lows are being created in terms of fractals
Ability to highlight breaks of highs and lows
Configurable fractal break strictness - (candle close vs candle high/low)
The large triangles = a higher high or lower low has been created
The small dashes = a lower high or lower low has been created
Alerts available for fractal break events
Fractal Breakout StrategyFractal
A type of pattern used in technical analysis to predict a reversal in the current trend. A fractal pattern consists of five bars and is identified when the price meets the following characteristics:
1. A shift from a downtrend to an uptrend occurs when the lowest bar is located in the middle of the pattern and two bars with successively higher lows are positioned around it.
2. A shift from an uptrend to a downtrend occurs when the highest bar is located in the middle of the pattern and two bars with successively lower highs are positioned around it.

FRAMA (Ehlers true modified calculation)Credit goes to Shizaru for the original calculation. I made just a few fixes, so that the calculation is really that of Ehlers.
Fixed H2 and L2 period, fixed w natural logarithm