PE ValuationAn indicator that can be used to study PE Valuation for stocks.
When the reported EPS for a company is non-positive the line turns gray. Red color means the market price is higher than the valuation whereas green color means the market price is below the valuation and it might be a good opportunity for value traders.
Fundamental-analysis

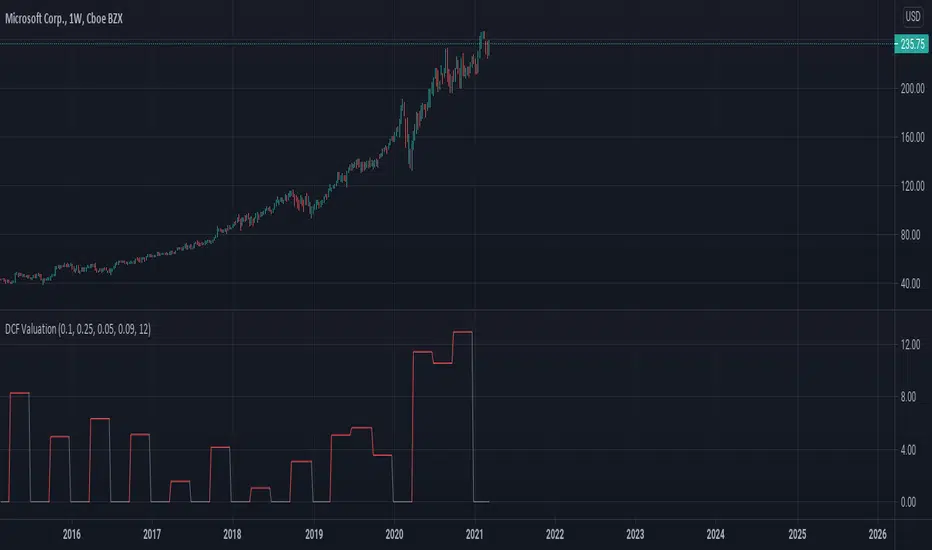
DCF ValuationAn indicator that can be used to study Discounted Cash Flow Valuation for stocks.
When the reported Free Cash Flow for a company is non-positive the line turns gray. Red color means the market price is higher than the valuation whereas green color means the market price is below the valuation and it might be a good opportunity for value traders.
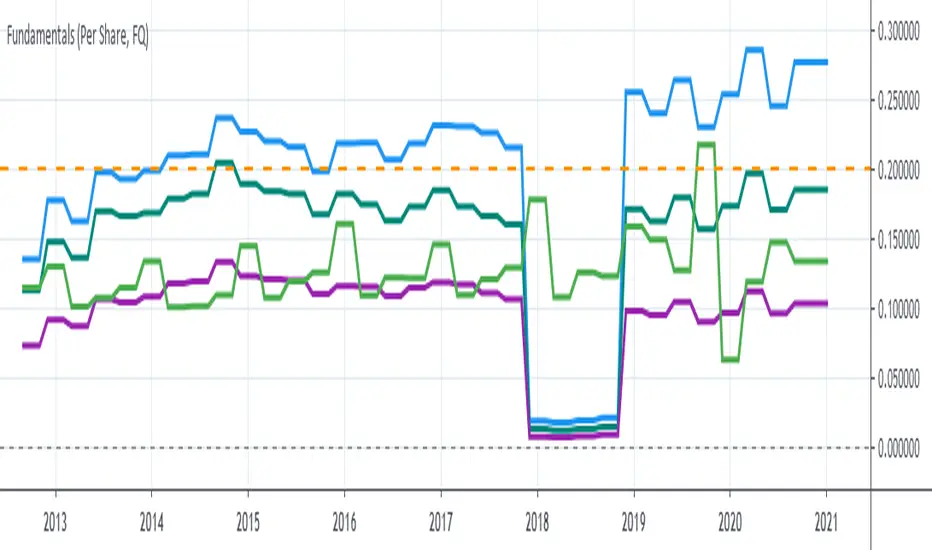
Financial Highlights [Fundamentals]█ OVERVIEW
This indicator plot basic key financial data to imitate the presentation format of several popular finance site, make it easier for a quick glance of overall company financial health without switching tabs for every single stocks.
█ Financial Data Available:
- Revenue & PAT (Profit after Tax)
- Net Profit Margin (%)
- Gross Profit Margin (%)
- Earnings Per Share (EPS)
- Dividend
█ Features:
- Toggle between Quarter/Annual Financial Data (Notes: For Dividends, it will always be plotted based on Annual data, at Financial Year ending period)
- Options to plot at either at Quarter/Yearly ending period OR Financial Data published date
█ Limitation
- The accuracy of the data subject to Tradingview's source, but from my observation it's accurate 95% of the time
- Recently published data might not be available immediately. e.g. MYX exchange tends to have 1-3 days lag
- More information on Tradingview's financial data can be read here -> www.tradingview.com
█ Disclaimer
Past performance is not an indicator of future results.
My opinions and research are my own and do not constitute financial advice in any way whatsoever.
Nothing published by me constitutes an investment recommendation, nor should any data or Content published by me be relied upon for any investment/trading activities.
I strongly recommends that you perform your own independent research and/or speak with a qualified investment professional before making any financial decisions.
Any ideas to further improve this indicator are welcome :)

P1 FundamentalsP1 is because to me, this is a priority 1 indicator, so I have P1 and P2 indicators ordered on the favorite list.
What can you check on the selection pane?
On “period”, you can show the data related to:
the fiscal quarters
or the fiscal years.
You can select a pack of financial data that I have organized in sections:
Revenue & earnings
EPS & DPS (EPS, EPS estimate, DPS and dividend payout ratio )
Debt (total debt, total equity and cash & equivalents)
Returns (ROE, ROIC, ROA and R&D revenue to ratio)
I recommend to just select one of them, in other case the chart is a mess.
Any feedback on the code is welcome!!
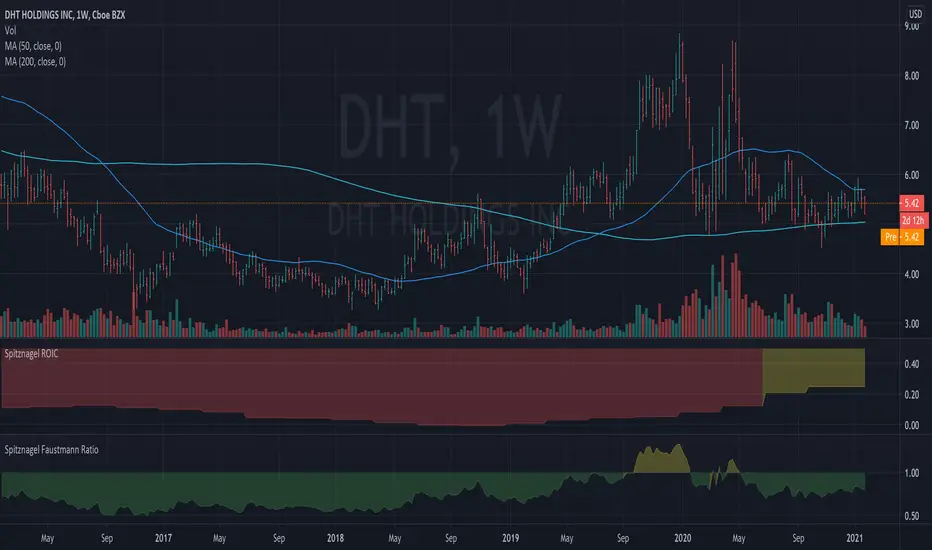
Spitznagel Faustmann RatioThis is a rough version of the Faustmann Ratio metric that Mark Spitznagel presents in The Dao of Capital. The purpose is to conservatively calculate the price of the company (market cap) relative to net worth. Over a medium term horizon, the theory is that companies which have a high ROIC (see my other script) combined with a low Faustmann Ratio (color coded to give you a rough idea) should generally outperform. Please don't take this short summary as an excuse to not read the full book. It's well worth your time. (I am not affiliated with the author in any way.)

Spitznagel ROICThis is a rough version of the Return on Invested Capital metric that Mark Spitznagel presents in The Dao of Capital. The purpose is to calculate the return on real invested capital, conservatively calculated. Over a medium term horizon, the theory is that companies which have a high ROIC (presented here as a decimal value where 0.5 = 50%, 1 = 100%, etc., and color coded as a general guide) combined with a low Faustmann Ratio (see my other script) should generally outperform. Please don't take this short summary as an excuse to not read the full book. It's well worth your time. (I am not affiliated with the author in any way.)
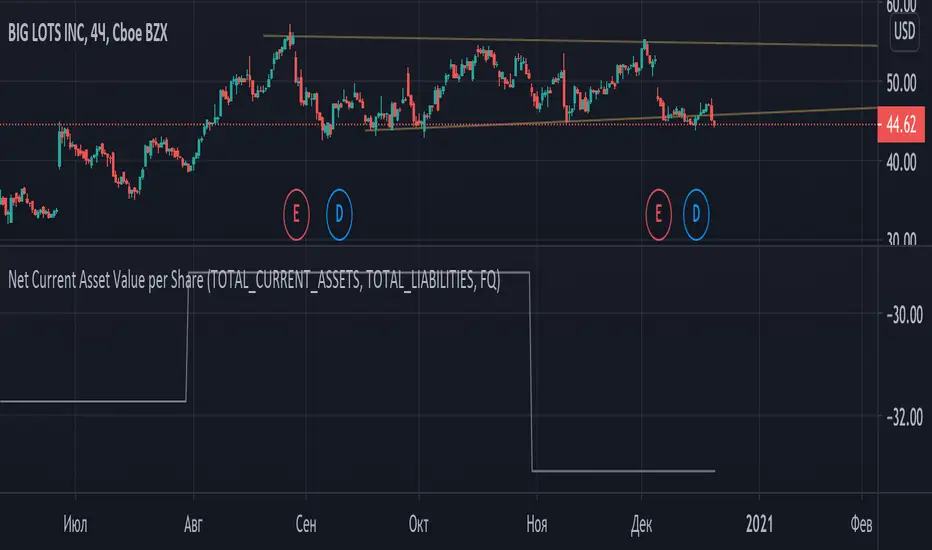
Graham Net Current Asset Value per ShareNet current asset value per share (NCAVPS) is a measure created by Benjamin Graham as one means of gauging the attractiveness of a stock. A key metric for value investors, NCAVPS is calculated by taking a company's current assets and subtracting total liabilities.
NCAVPS = Current Assets - (Total Liabilities + Preferred Stock) ÷ Shares Outstanding.
According to Graham, investors will benefit greatly if they invest in companies where the stock prices are no more than 67% (or 2/3) of their NCAV per share (price <= (2/3)*NCAV).
Coloring pattern:
- price <= (1/3)*ncav -> light green
- (1/3)*ncav < price <= (2/3)*ncav -> green
- (2/3)*ncav < price <= ncav -> dim red
- price > ncav -> red
Long RSIThe RSI is a technical indicator generally used with the general setting being 14 days, and often shorter.
The accepted view is that a level of 70 indicates overbought conditions, and 30 indicates oversold conditions.
A short RSI setting will give signals quite often, and they might sometimes contradict each other.
As a individual investor, perhaps with a background in fundamental analysis, the RSI might be overlooked for other fundamental metrics.
But the idea here is that longer RSI settings can be used for investing.
The problem that arises is how to know when the indicator has reached a level that is either overbought or oversold.
This script solves that by using a specific look back period (selectable, but the standard is 1 year), and plotting the highest/lowest value that the RSI has had for that time period.
The idea is that a buy signal occurs when the indicator is at a 'historic' low, and a sell signal occurs when it at its 'historic' high.
Since you generally want to buy when the indicator is at its low, and has stopped decreasing, the script comes with a function that shows you when yesterdays value reached a historic low, but todays value is higher than yesterday.
This is shown by a color change of the background to green. The same is true, but opposite, for sell signals and then the background turns red.
THIS IS NOT TRADING ADVICE, AND YOU SHOULD ALWAYS DO YOUR OWN RESEARCH
GOOD LUCK AND HAPPY TRADING

Fundamental Metric to MarketThis script is supposed to be a quite basic way to find, from a fundamental standpoint, overvalue or undervalued stocks.
The script shows either Book to Market (inverse of P/B), EV /EBITDA, Earnings Yield (inverse of P/E) or Sales to Market (inverse of P/S).
For example, P/B is calculated as Close price / Book Value per share. As a contrarian investor you generally want to buy low P/B stocks and sell high P/B stocks. The problem is when a company has a negative Book Value. This might be the case when a company has written of a large amount of goodwill, which in turn wiped out their Book Value.
Instead you can use Book to Market, which is simply the inverse of P/B. It is calculated as Book Value per share / Close price. When using Book to Market you, generally, want to buy shares with high Book to Market values and sell those with low values. Because of the calculation, companies with negative Book Value will have negative Book to Market values and is therefore easy to identify.
The Fundamental Metric to Market indicator shows a colored background between the highest / lowest point of earlier values and the current value. When the background is mainly green the stock is probably undervalued, and the opposite is true when the background is red.
THIS IS NOT TRADING ADVICE, AND YOU SHOULD ALWAYS DO YOUR OWN RESEARCH
GOOD LUCK AND HAPPY TRADING

Graham NumberGraham Number is named after the “father of value investing,” Benjamin Graham, who was a mentor of Warren Buffett. The figure takes into account earnings per share and book value per share to measure a stock's maximum fair market value. In other words, it is the upper end of the price range that a defensive investor should pay for the stock.
The Graham Number = Square Root of (22.5) x (tmm EPS) x (mrq Book Value per Share).
The 22.5 is included in the formula as a rule of thumb to account for Graham's assumption that the price-to-earnings ratio should not be over 15 and the price to book ratio should not be over 1.5 for an undervalued stock. So, the number is generated as (P/E of 15) x (P/B of 1.5) = 22.5.
So the script generates a Graham number plot.

L1 Bitcoin Whale Pump DetectorLevel: 1
Background
One of the biggest differences between cryptocurrency and traditional financial markets is that cryptocurrency is based on blockchain technology. Individual investors can discover the direction of the flow of large funds through on-chain transfers. These large funds are often referred to as Whale. Whale can have a significant impact on the price movements of cryptocurrencies, especially Bitcoin. Therefore, how to monitor Whale trends is of great significance both in terms of fundamentals and technical aspects.
Function
L1 Bitcoin Whale Pump Detector script This is a simple technical indicator that judges whether Whale is involved in the relationship between price increase and trading volume. Its purpose is not to accurately judge Whale behavior, but to provide a starting point for more Pine lovers to develop more advanced Whale monitoring programs.
Key Signal
pumpcond1 use price information alone with 7% as a threshold
pumpcond2 use both price and volume infomation.
Pros and Cons
Pros:
1. Detect Whale pump in large time frame.
2. Not a mature and accurate buy and sell script but provide alerts of Whale movements.
3. When it resonante with Buy signal, it has higher confidence level.
Cons:
1. Only detect Whale Pump, not Whale Dump is realized.
2. Only provide large fund information, not an accurate trading signal generator.
Remarks
You can use this to confirm blockchain large fund transfer activities. E.g. Large amount of USDT flows into large exchanges.
Readme
In real life, I am a prolific inventor. I have successfully applied for more than 60 international and regional patents in the past 12 years. But in the past two years or so, I have tried to transfer my creativity to the development of trading strategies. Tradingview is the ideal platform for me. I am selecting and contributing some of the hundreds of scripts to publish in Tradingview community. Welcome everyone to interact with me to discuss these interesting pine scripts.
The scripts posted are categorized into 5 levels according to my efforts or manhours put into these works.
Level 1 : interesting script snippets or distinctive improvement from classic indicators or strategy. Level 1 scripts can usually appear in more complex indicators as a function module or element.
Level 2 : composite indicator/strategy. By selecting or combining several independent or dependent functions or sub indicators in proper way, the composite script exhibits a resonance phenomenon which can filter out noise or fake trading signal to enhance trading confidence level.
Level 3 : comprehensive indicator/strategy. They are simple trading systems based on my strategies. They are commonly containing several or all of entry signal, close signal, stop loss, take profit, re-entry, risk management, and position sizing techniques. Even some interesting fundamental and mass psychological aspects are incorporated.
Level 4 : script snippets or functions that do not disclose source code. Interesting element that can reveal market laws and work as raw material for indicators and strategies. If you find Level 1~2 scripts are helpful, Level 4 is a private version that took me far more efforts to develop.
Level 5 : indicator/strategy that do not disclose source code. private version of Level 3 script with my accumulated script processing skills or a large number of custom functions. I had a private function library built in past two years. Level 5 scripts use many of them to achieve private trading strategy.

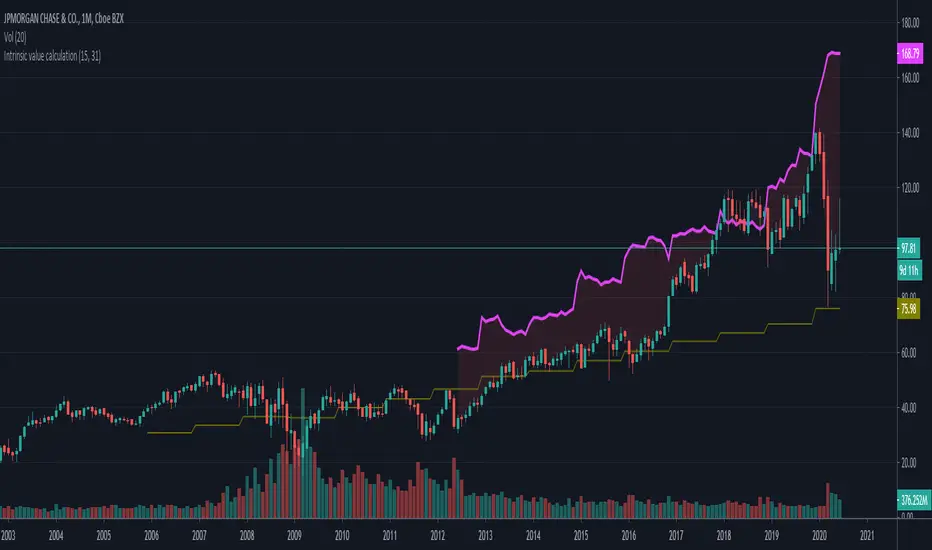
Intrinsic value calculation Intrinsic value calculator based on Warren Buffet's and Ben Graham's work
In value investing determing the true value of a COMPANY instead of a stock price is crucial.
This little indicator shows the "Intrinsic value" of the choosen stock meaning the value of the stock in 10 years time. Calculation is based on historical book value's average annual growth rate and dividends paid.
Since this is about long therm investing, use monthly charts.
"Intrinsic value can be defined simply: It is the discounted value of the cash that can be taken out of a business during its remaining life.”
– Warren Buffett
One way to calculate that is by the growth in per share book value and dividends taken in the forseeable future (10 years) than discount it with the prevailing 10 year note's rate.
In the inputs you have to set 2 variables:
1. How many years back you have the first data for book value per share available?
2. What was the per share book value that year?
(Bookvalue is ploted in olive colour and you can get the oldest one if you move your cursor over the latest data on the left)
CAUTION! You have to reenter it for every stock you analyse as this is stock-specific data!
After setting the input data, you will see the "Intrinsic Value"'s pink curve ploted over the price chart.
If the price is well below the pink line, the company is undervalued and can be a possible applicant for long therm investment.
Margin of safety: when the current price is 50% below the intrinsic value that means a 10% yearly growth potential (100% growth in 10 years) or a 100% margin of safety.
I am a beginer in Pine so please excuse my coding...
If anybody knows hot to extract historical data from 15 years ago, please share it with me, so I can automate the whole calculation without inputs necessary.
Funamental and financialsEarnings and Quarterly reporting and fundamental data at a glance.
A study of the financial data available by the "financial" functions in pinescript/tradingview
As far as I know, this script is unique. I found very few public examples of scripts using the fundamental data. and none that attempt to make the data available in a useful form
as an indicator / chart data. The only fitting category when publishing would be "trend analysis" We are going to look at the trend of the quarterly reports.
The intent is to create an indicator that instantly show the financial health of a company, and the trends in debt, cash and earnings
Normal settings displays all information on a per share basis, and should be viewed on a Daily chart
Percentage of market valuation can be used to compare fundamentals to current share price.
And actual to show the full numbers for verification with quarterly reporting and debuggging (actual is divided by 1.000.000 to keep numbers readable)
Credits to research study by Alex Orekhov (everget) for the Symbol Info Helper script
without it this would still be an unpublished mess, the use of textboxes allow me to remove many squiggly plot lines of fundamental data
Known problems and annoyances
1. Takes a long time to load. probably the amount of financial calls is the culprit. AFAIK not something i can to anything about in the script.
2. Textboxes crowd each other. dirty fix with hardcoded offsets. perhaps a few label offset options in the settings would do?
3. Only a faint idea of how to put text boxes on every quarter. Need time... (pun intended)
Have fun, and if you make significant improvements on this, please publish, or atleast leave a comment or message so I can consider adding it to this script.
© sjakk 2020-june-08

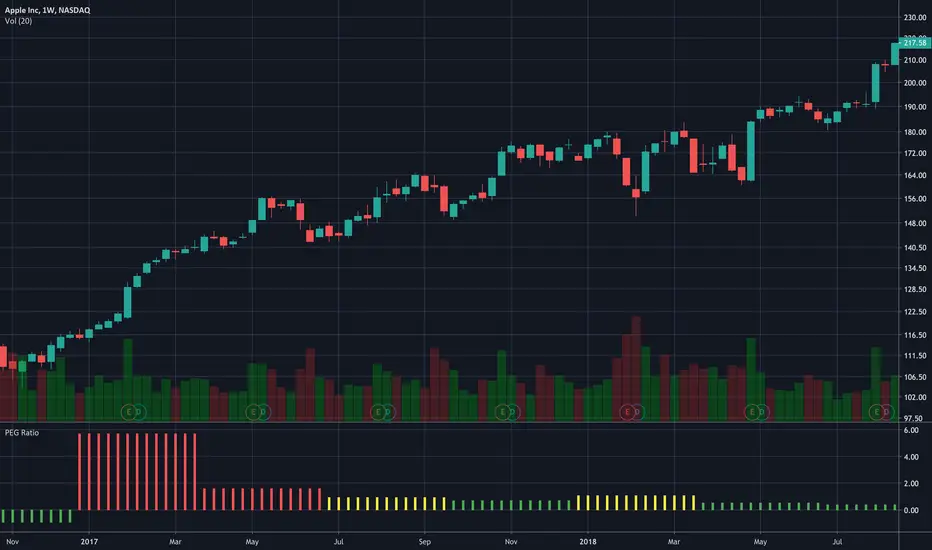
PEG RatioHello everyone,
Quick script to check the PEG Ratio.
What is PEG Ratio?
The price/earnings to growth ratio (PEG Ratio) is a stock's price-to-earnings (P/E) ratio divided by the growth rate of its earnings for a specified time period. The PEG ratio is used to determine a stock's value while also factoring in the company's expected earnings growth, and is thought to provide a more complete picture than the more standard P/E ratio.
A PEG Ratio greater than 1.0 means that the stock is overvalued, while below 1.0 means is is undervalued. When the PEG Ratio is exactly 1.0, then the stock is trading at fair valuation.
Formula:
PEG Ratio = (Price / EPS) / EPS Growth
Examples:
Company A:
Price per share = $46
EPS this year = $2.09
EPS last year = $1.74
Company B
Price per share = $80
EPS this year = $2.67
EPS last year = $1.78
Company A
P/E ratio = $46 / $2.09 = 22
Earnings growth rate = ($2.09 / $1.74) - 1 = 20%
PEG ratio = 22 / 20 = 1.1
Company B
P/E ratio = $80 / $2.67 = 30
Earnings growth rate = ($2.67 / $1.78) - 1 = 50%
PEG ratio = 30 / 50 = 0.6
The company A is overvalued whiled the B is undervalued.
In this script an overvalued stock is considered when the PEG Ratio is above 1.1, while it is 0.9 for an undervalued stock.
Only works with Stocks.
Happy trading,
Inflation Rate HistogramThis script is designed to show a histogram of the inflation rate, based on FRED's CPI data. It shows the yearly change in cpiaucsl. As of right now, this script only works correctly on the yearly timeframe (12M). I'm currently looking into a solution to make this script work on all time frames. This script can be useful for comparing growth to inflation, or just if you want to see how inflation was for a certain year. This script really puts the stagflation into perspective.

Dividend Yield with 2 Moving Average for see SpreadI "applied" the dividend yield on the original library script which I adding 2 Exponential Moving Average.
That is average the Long term of Dividend Yield and Short Term of Dividend Yield.
To estimate the Trend that "Is it worth to invest this stock right now?"
If the dividend yield right now is higher than both maybe it worth it on the past
(You can used your price pattern skill to make an entry with backed by adjusted yield------> I think it will help you for estimate pre-total return for Hybrid with Fundamental and Technical )
Hope it will help you ><
PS. it has a problem when using with "Split" stock ( for example 1 Year on "Day" Timeframe )
if somebody can help me .pls help me pls TT
Ps2. Be warry of the stock that don't has consistency pay dividend out and some "special dividend" that don't come form the real operating income.
--------------------------------------------------------------------------------------------------------------------------------------------------------------
สวัสดีมิตรสหายเทรดเดอร์หุ้นไทยทุกท่าน ผมสร้างอินดิเคเตอร์ สำหรับดูผลตอบแทนจากเงินปันผล พร้อมกับเส้นค่าเฉลี่ย เคลื่อนที่ 2 เส้น
เพื่อเป็นการดูแนวโน้มของราคาหุ้น และเพื่อจับจังหวะการซื้อหุ้นนะครับ
ผมขอยกความดีความชอบของ ท่าน Library Script นะครับ ที่มี Format ของการคำนวณเงินปันผลมาให้ ผมทำเพียงแค่ปัดฝุ่น และ Mod เส้นค่าเฉลี่ยขึ้นมาครับ
ไม่มีอะไรจะดีไปกว่าการซื้อหุ้นแล้วมีปันผลรองรับ ซับแรงกระแทกตอนที่กดเข้าซื้อหุ้นไปอีกแล้ว
สำหรับมิตรสหายท่านใดที่ศึกษาศาสตร์ด้าน "พื้นฐาน" และ "เทคนิค" อินดิเคเตอร์นี้อาจช่วยท่านหาจุดเข้าซื้อ ที่คุ้มค่าด้านเงินปันผล และเป็นจุดซื้อที่แม่น ขลัง มากขึ้นนะครับ
ผมว่าหากใช้ควบคู่กับเรื่อง Price Pattern คงเป็นประโยชน์ไม่น้อยเลย
ขอให้อินดิเคเตอร์นี้มิประโยชน์แก่ทุกท่านนะครับ
Ps. บางที เจ้าอินดิเคเตอร์นี้อาจมีปัญหา เมื่อใช้กับหุ้นที่เคยมีการแตกพาร์มาก่อนนะครับ ท่านอาจต้องใช้ Timeframe อื่นที่ไม่ครอบครุมช่วงเวลาที่แตกพาร์ครับ
ซึ่งตรงนี้ ผมยังหาวิธีแก้ไม่พบครับ มิตรสหายท่านใดช่วยมาก ผมจะยินดีอย่างยิ่ง
Ps2. ระมัดระวังหุ้นที่จ่ายปันผลไม่สม่ำเสมอ และหุ้นที่จ่ายปันผลจากกำไรพิเศษ หรือจ่ายจากเงินที่ไม่ได้มาจากการดำเนินงานตามปกตินะครับ เช่นการขาย Asset เข้า กอง Reit ขายหุ้นในบริษัทลูกและอื่นๆ

BTC Transaction/On-Chain Volume (Basic)Description:
Whale: Whale utilizing discounted prices (increasing on-chain volume & decreasing price)
Recovering: Positive momentum in price after potential whale activity
Cycle Volume Support: The transaction volume support during a cycle
What’s the best time to invest?
After institutions make up their mind at low price levels.
How’s on-chain volume related to whales or institutional money?
On-chain volume is contributed not only by using BTC as payment methods, but more importantly by large custodians using the BTC chain to settle internal whale trades. When OTC volume is estimated 2-3 times of exchange volume, and when total on-chain volume is only a small fraction of the exchange volume, the OTC settlement plays a big factor in moving the on-chain volume around.
Why does the price drop further after spotting whale money?
Does new money equal higher true value? Yes.
Does new money equal higher price? No.
Whales could not only ladder in when they see the price on discount, but also push the price further down to accumulate at better price levels. However, either route chosen, it’s most likely for the price to rise to a higher level compared to the level when the whales enter. Whales are here to make money after all.

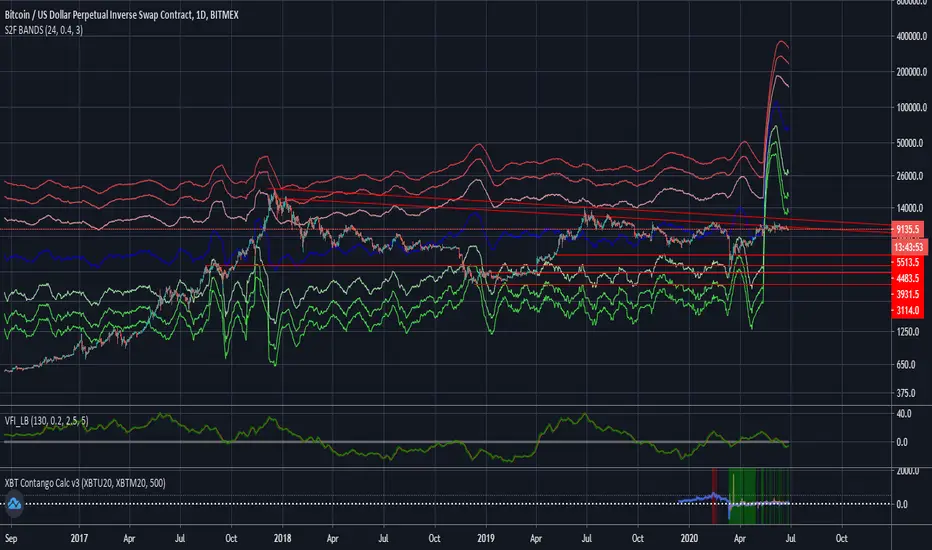
Stock to Flow Model with Standard Deviation BandsThis Study takes the Stock to Flow Model for Bitcoin as presented by 100trillionUSD and smoothes it using an SMA. Then it calculates the close's standard deviation from it and displays the 2-Sigma Bands.
The stock to flow model seems to be one of the best predictions of Bitcoins price.
The standard deviation bands are supposed to show situations in which Bitcoin is significantly over- or under-bought.
Bitcoin Network Value to Transactions [aamonkey]Cryptoassets have been quite turbulent in the past few weeks.
At times like this, it is especially important to look at the fundamental foundations of cryptoassets.
This indicator is based on the Network Value to Transactions , or NVT .
Definition:
NVT = Network Value / Daily Transaction Volume
Because this indicator is pulling the Daily Transaction Volume for BTC it can only be used for BTC and the daily timeframe.

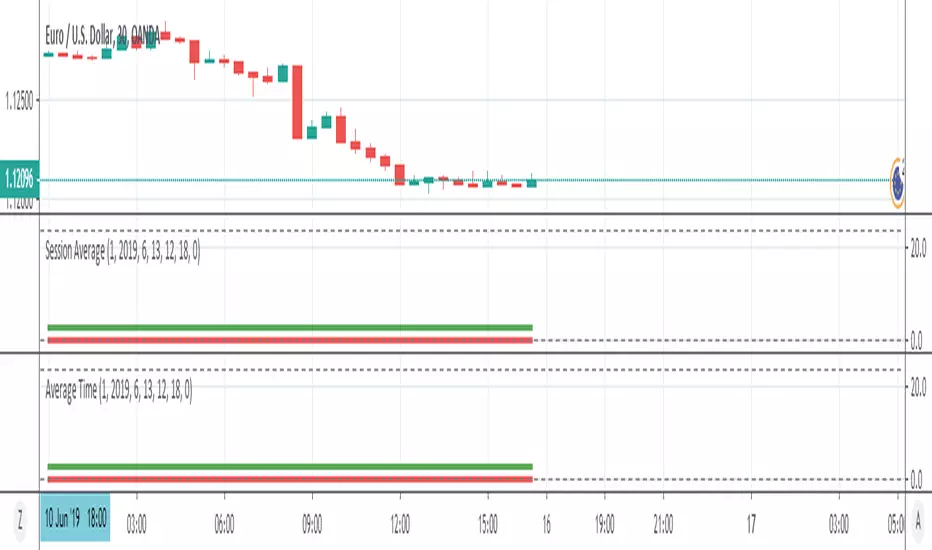
Session AverageThis indicator finds the average time of High or Low formed in sessions.
This is a request from trader @Salmanmahmood15 . You need permission from him to fully use it