Future Swing [BigBeluga]🔵 OVERVIEW
Future Swing is a swing-based projection tool that estimates the potential size and price target of the next swing move using historical swing behavior.
Instead of predicting direction randomly, it analyzes completed swing legs, measures their percentage moves, and projects a statistically derived swing target into the future.
The indicator combines swing structure, high/low zones, volume context, and a real-time dashboard to help traders anticipate where price may travel next.
🔵 CONCEPTS
Swing Detection — Swing highs and lows are identified using a configurable lookback length.
Swing Percentage Tracking — Each completed swing leg is converted into a percentage move and stored.
Statistical Projection — Future swing size is estimated using Average, Median, or Mode of past swing percentages.
Directional Awareness — Projections adapt automatically based on current swing direction.
🔵 FEATURES
Historical Swing Sampling —
• Uses a user-defined number of completed swings.
• More samples = smoother projection, fewer samples = faster adaptation.
Future Swing Projection —
• Dashed line projects the estimated swing target forward in time.
• Projection distance is visual-only and does not affect calculations.
High/Low Swing Zones —
• Upper and lower swing zones expand using ATR distance.
• Zones visualize potential reaction and rejection areas.
Volume Context per Swing —
• Buy and sell volume are accumulated during each swing leg.
• Delta and total volume are displayed in the dashboard.
Smart Dashboard —
• Displays each stored swing percentage.
• Shows calculated swing projection value.
Flexible Projection Method —
• Average: smooth and balanced.
• Median: filters out extreme outliers.
• Mode: focuses on the most common swing size.
Extendable Zones —
• Swing zones can optionally extend forward indefinitely.
🔵 HOW TO USE
Anticipate Swing Targets — Use the projected swing line as a probabilistic price objective.
Combine with Structure — Align projections with support, resistance, or liquidity zones.
Filter by Volume — Confirm swing quality using delta and total volume metrics.
Adjust Sensitivity — Tune swing length and historical sample size to match timeframe and volatility.
Context, Not Certainty — Use projections as guidance, not fixed take-profit levels.
🔵 CONCLUSION
Future Swing transforms past swing behavior into a forward-looking projection model.
By combining swing structure, statistical aggregation, ATR zones, and volume analysis, it offers traders a structured way to estimate where the next meaningful price move may reach — without relying on fixed targets or subjective assumptions.
Futureanalysis

Crypto Futures Basis Tracker (Annualized)🧩 What is Basis Arbitrage
Basis arbitrage is a market-neutral trading strategy that exploits the price difference between a cryptocurrency’s spot and its futures markets.
When futures trade above spot (called contango), traders can buy spot and short futures, locking in a potential yield.
When futures trade below spot (backwardation), the reverse applies — short spot and go long futures.
The yield earned (or cost paid) by holding this position until expiry is called the basis. Expressing it as an annualized percentage allows comparison across different contract maturities.
⚙️ How the Indicator Works
This tool calculates the annualized basis for up to 10 cryptocurrency futures against a chosen spot price.
You select one spot symbol (e.g., BITSTAMP:BTCUSD) and up to 10 futures symbols (e.g., DERIBIT:BTCUSD07X2025, DERIBIT:BTCUSD14X2025, etc.).
The script automatically computes the days-to-expiry (DTE) and the annualized basis for each future.
A table displays for each contract: symbol, expiry date, DTE, last price, and annualized basis (%) — making it easy to compare the forward curve across maturities.
⚠️ Risks and Limitations
While basis arbitrage is often considered low-risk, it’s not risk-free:
Funding and financing costs can erode returns, especially when borrowing or using leverage.
Exchange or counterparty risk — if one leg of the trade fails (e.g., exchange default, margin liquidation), the hedge breaks.
Execution and timing risk — the basis can tighten or invert before both legs are opened.
Liquidity differences — thin futures may have large bid-ask spreads or slippage.
Use this indicator for analysis and monitoring, not as an automated trading signal.
Disclaimer: Please remember that past performance may not be indicative of future results. Due to various factors, including changing market conditions, the strategy may no longer perform as well as in historical backtesting. This post and the script don't provide any financial advice.

Forward Curve Visualization ToolProvide the spot symbol and the futures product root, and the script automatically scans all relevant contracts for you—no more tedious manual searches. The result is a clean, intuitive chart showing the live forward curve in real time.
It also detects contango or backwardation conditions (based on spot < F1 < F2 < F3).
Future Features:
Plot historical snapshots of the curve (1 day, 1 week, or 1 month ago) to understand market trends over time.
Display additional metrics such as annualized basis, cost of carry (CoC), and even volume or open interest for deeper insights.
If you trade futures and watch the forward curve, this script will give you the actionable data you need and get more ideas or features you’d like to see. Let’s build them together!
Disclaimer
Please remember that past performance may not be indicative of future results.
Due to various factors, including changing market conditions, the strategy may no longer perform as well as in historical backtesting.
This post and the script don’t provide any financial advice.

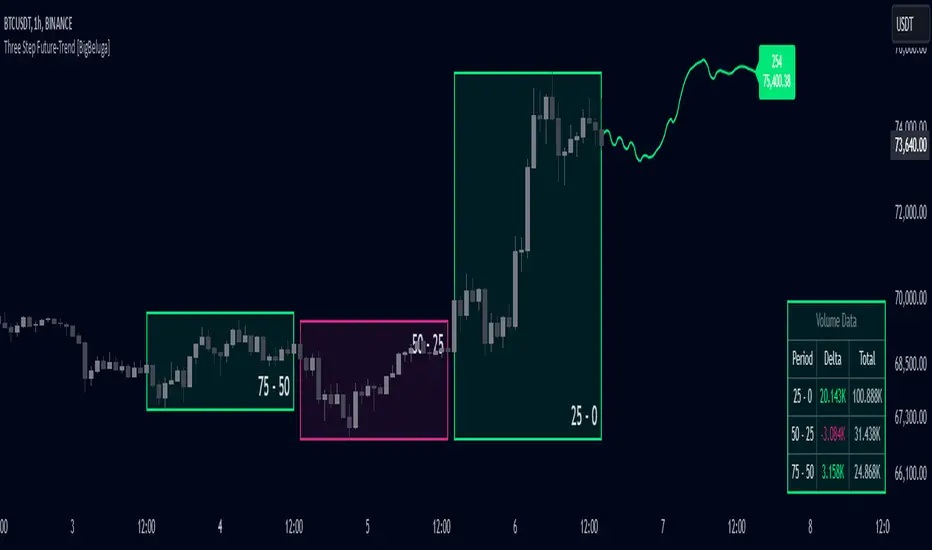
Three Step Future-Trend [BigBeluga]Three Step Future-Trend by BigBeluga is a forward-looking trend analysis tool designed to project potential future price direction based on historical periods. This indicator aggregates data from three consecutive periods, using price averages and delta volume analysis to forecast trend movement and visualize it on the chart with a projected trend line and volume metrics.
🔵 Key Features:
Three Period Analysis: Calculates price averages and delta volumes from three specified periods, creating a consolidated view of historical price movement.
Future Trend Line Projection: Plots a forward trend line based on the calculated averag of three periods, helping traders visualize potential future price movement.
Avg Delta Volume and Future Price Label: Shows a delta average Volume a long with a Future Price label at the end of the projected trend line, indicating the possible future delta volume and future Price.
Volume Data Table: Displays a detailed table showing delta and total volume for each of the three periods, allowing quick volume comparison to support the projected trend.
This indicator provides a dynamic way to anticipate market direction by blending price and volume data, giving traders insights into both volume and trend strength in upcoming periods.