Crypto BTC Correlation Scalper Gaps StrategyThis strategy is based on the gaps theory.
In this case we have the BTC futures from CME, which acts in a way similar to stocks, and we can have gaps present between close/open session, and also sometimes between same candle due to huge movements intra candle.
At the same time I have combined this with a daily moving average, to help out a bit with the trend, since we are looking at small timeframe like 1-15/30min .
On top of that we have a reverse option, where long = short and viceversa, which can be used with against BTC pairs .
Rule are simple:
For long, we have a long gap and the close of the correlated candle is above daily sma
For short, we have a short gap and the close of the correlated candle is below daily sma
For exit:
For exit, we take the highest highest values for short entry TP, meaning we get the different from the HH and rest the current open candle distance, and use that distance as a TP.
At the same time for long entry, we take the lowest low value and rest current close of the candle to that value, and we get the TP.
Can also be applied this logic for SL aswell but from the test I have found out that exiting based on a reverse condition(when tp is not being hit), gives better results/dd overall.
If you have any questions, please let me know !
Futures

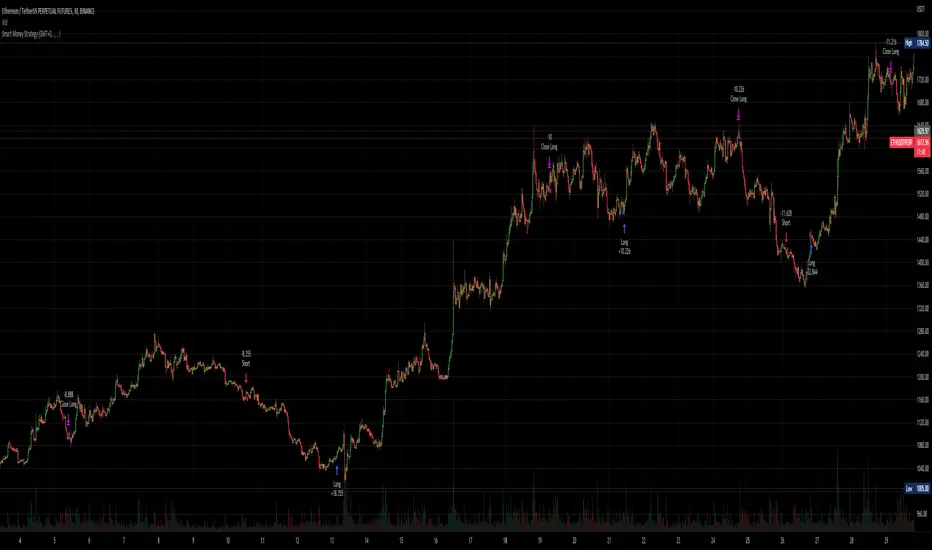
Smart Money - Oscillator and Volume StrategyOverview
This is a no-repaint strategy that is highly optimized for BINANCE:ETHUSDTPERP 30m, normal candles. It is a long/short strategy that is based on CMF, ADX/DMI, Keltner Channels, and other oscillators to identify smart money.
The overall idea of the strategy is to effectively capture the beginnings and ends of trends in price action, and go long/short accordingly. To achieve this, potential entry points are identified with various oscillators and these are then filtered using a variety of moving averages and strength/momentum indicators.
Short and sell inflections are found when ADX, DMI, and/or CMF oscillate below a specified threshold, and Keltner Channels are also used to indicate potential trades.
The indicator will continue to be updated and optimized for current and future market conditions.
If purchased, access to the indicator will be available within 24 hours.
Backtest Results
Parameters:
- 2021-01-01 to present (19 months)
- 100% equity order size
- 0.04% commission fees
- No leverage
17,089% net profit through 296 trades with 60.47% of trades being profitable.
Profit factor of 2.862, Sharpe Ratio of 1.158
Parameters:
- 2021-01-01 to present (19 months)
- $1,000 initial capital
- $1,000 order size
- 0.04% commission fees
- No leverage
584% net profit through 296 trades with 60.47% of trades being profitable.
Parameters:
- 2021-01-01 to present (19 months)
- 500% equity order size
- 0.04% commission fees
- 5x leverage
8,587,557% net profit through 299 trades with 59.87% of trades being profitable.
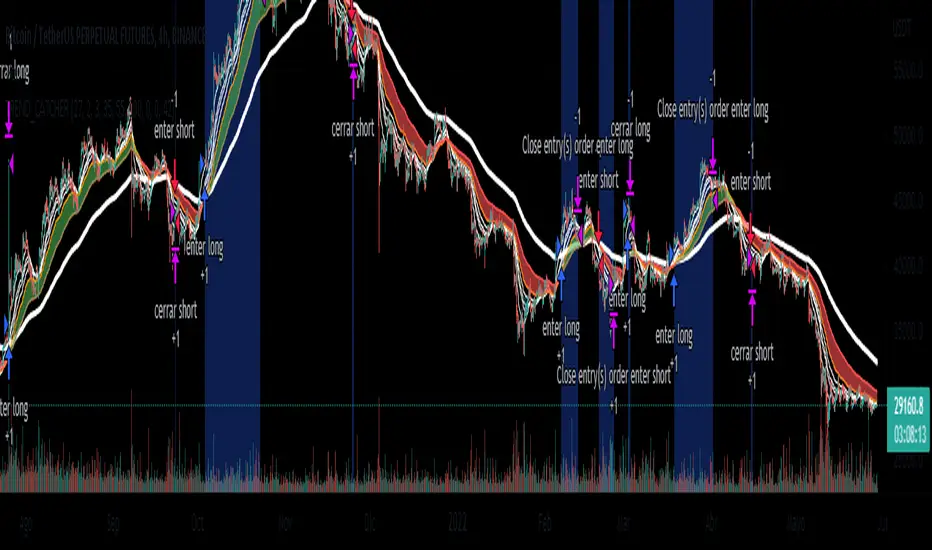
EMA_TREND_CATCHERSimple strategy based on the crossing of moving averages of 50,100 and 200 periods. Designed to identify trends
You are ready to use trading bots (all you have to do is fill in "Variables for Alert"). However, it can also be used for discretionary operations.
BTCUSDT FUTURES BINANCE
4H
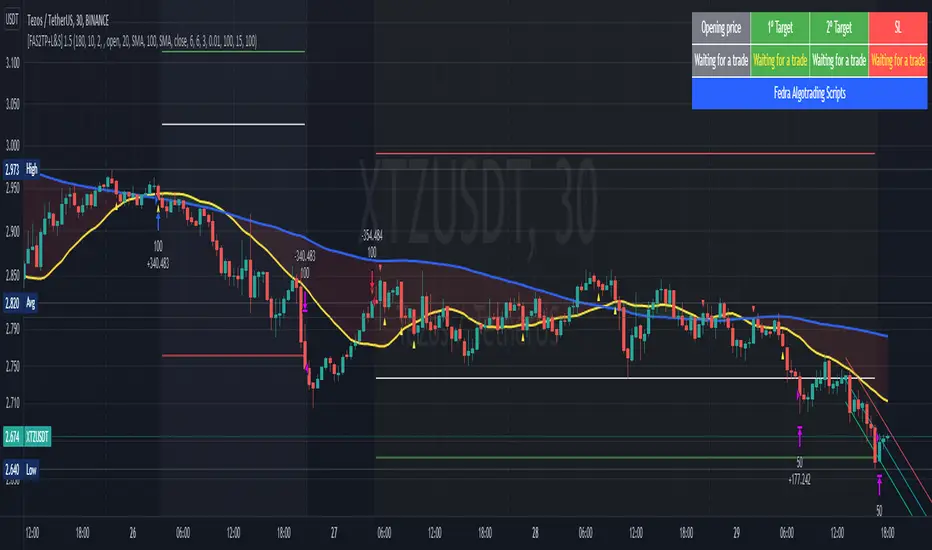
[Fedra Algotrading Strategy 2tp+L&S] Futures Long or ShortStrategy for crypto market, designed for automatic algorithmic trading with bots.
Can place long and short orders
Calculates your entries based on the breakout of the simple deviation of the linear regression of the last X periods.
Configures TP (green line) and SL (red line) percentages, the TP is a trailing TP.
Optionally, you can set a first TP (white line) that sells half of the position.
Advanced trend filter to not open trades against the market. SMA (yellow line), WMA (blue line) and secret sauce
Includes an advanced system to control the backtest period (choose how many days to backtest).
Risk management by volume of capital or amount of losing trades (kill switches that will exit the trade and stop the script)
The script includes default commissions of 0.2% per trade (configurable).
- Dinamic table with Price positions to plan your limit orders if you are trading manually
- Highly customizable and optimizable.
If you want to trade longs and shorts, it is advisable to create 2 different alerts. In most cases, the optimal parameters for longs are not the same as for shorts. In a forthcoming update I will enable separate configurations.
For better performance the script uses real time price information, for this reason Tradingview may warn you that there is "repainting", as the backtest information does not contain the information of each tick but only the open, close, high and low values of each candle.
To avoid this, you can disable the "calculate on every tick" option from the strategy settings panel.
[Fedra Algotrading Strategy Futures Signals]Linear Regression + Take Profit and Percentage Stop Loss
Optimize the parameters in backtesting to find the best entries, define your profit and risk strategy, take advantage of statistics and make trades without letting the psychological factor make you commit mistakes.
The strategy chooses the time to buy when the price breaks down the deviation of the linear regression calculated on the basis of the last lows prices and allows you to generate alerts.
It also includes an emergency exit at Break Even (1.5%) when it detects a negative trend in the short term.
It also has an advanced trend filter to avoid opening trades against the market.
*************************************
Regresión lineal + Take Profit y Stop loss porcentual
Optimice los parámetros en backtesting para encontrar las mejores entradas, defina su estrategia de profit y riesgo, apreveche las estadísticas y haga operaciones son dejar que el factor psicológico le haga cometer errores.
La estrategia elige el momento de compra cuando el precio rompe hacia abajo la desviación de la regresión lineal calculada en base a lows últimos precios y permite generar alertas.
También incluye una salida de emergencia en Break Even (1.5%) cuando detecta una tendencia negativa en el corto plazo.
Tiene también un filtro avanzado de tendencia para no abrir operaciones en contra del mercado.
Stock trending strategy This is a long only strategy designed maily for stock markets and futures. In general it works best with 1h, however it can be optimized with other timeframes as well.
Components:
VWAP
MACD histogram
EMA 9
Rules for entry
Long :
For VWAP: close is above the vwap daily
EMA: close is above the moving average
MACD histogram is above 0
Short:
For VWAP: close is belowthe vwap daily
EMA: close is below the moving average
MACD histogram is below 0
Rules for exit
This strategy does not have any risk management inside. Instead it exits whenver it receives an opposite signal form the original one used for entry.
If you have any questions let me know !

Ichimoku with MACD/ CMF/ TSIThis is a very powerful trend strategy designed for markets such as stocks market , stock index and crypto.
For time frames I found out that 1h seems to do the trick.
Components:
Ichimoku full pack
MACD histogram
CMF oscillator
TSI oscillator
Rules for entry
Long :
For Ichimoku:Tenkan part of cloud is bigger than kijun, Chikou is above 0 , close of a candle is above the Senkou
MACD histogram is above 0
CMF oscillator is positive and bigger than 0.1
TSI oscillator is above 0
Short:
For Ichimoku:Tenkan part of cloud is smaller than kijun, Chikou is below 0 , close of a candle is belowthe Senkou
MACD histogram is below 0
CMF oscillator is negative and below -0.1
TSI oscillator is below 0
Rules for exit
This strategy does not have any risk management inside. Instead it exits whenver it receives an opposite signal form the original one used for entry.
If you have any questions let me know !

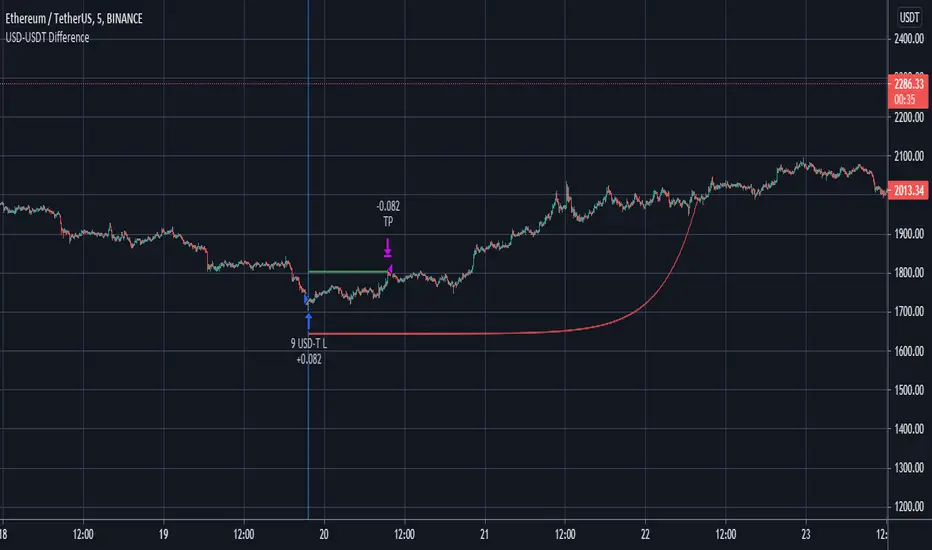
Futures Spot Difference Strategy by MoonFlag
This strategy compares the spot and futures value of a coin on a given exchange
If the 'Percent Difference' (See settings) is greater than a user specified ammount a blue (long) or green(short) line is put on the chart.
Default % difference typically varies from 0.2 to 0.7 depending on the coin and timeframe. On higher timeframes (1hour) a difference of 1.5% might be required to give good intermittent trade results.
I've chosen a USD-USDT comparison as default for ease of understanding. Note the futures coin goes onto the chart and the spot coin is referenced in settings. The bot works this way as the futures will typically extend beyond the spot price, not the other way around.
User can select if to include Long and/or Short trades.
The 'Trigger Only When Bar Complete' means that repainting should not be an issue if set to true. However, if set to false the strategy will enter a trade at the point in time when the percentage difference is met. This is useful with some coins as the futures coins price rapidly changes to realign with the spot price. It is however difficult to backtest this feature as backtests only consider the bar complete situation. I mostly use Trigger When Bar Complete = true, as a difference in the spot/ futures price is typically followed by a price shift trend over then next reasonable time period.
Timing is essential in this bot. There is a stop-loss however, this stop value is replaced by a exp ramp which has 3 variables (starting %, length, run-up). When the ramp is narrower to the price than the stop-loss the ramp takes over the stop-loss and this reduces losses. Also, there is an option to have the ramp take over the take-profit if the ramp betters the start-price (i.e. the trade is in profit). This is very useful for times when the price massively swings beyond the take-profit price as the exp ramp goes way up. The ramp also limits the time a trade will stay in position, unless the trades moves in tandem with the ramp. The ramp is the most useful feature I have for bots, I use it all the time.
So a difference between the spot and futures price - can lead to a trend establishing, so catch these with this bot. It works well on fast timeframes, 1m, 5m, 15m, and also is useful with the 1hour and similar.
Please get in touch to have this bot matched to any coin pair
Please do get in touch if you have any questions/suggestions.
Sincerely,
MoonFlag PhD
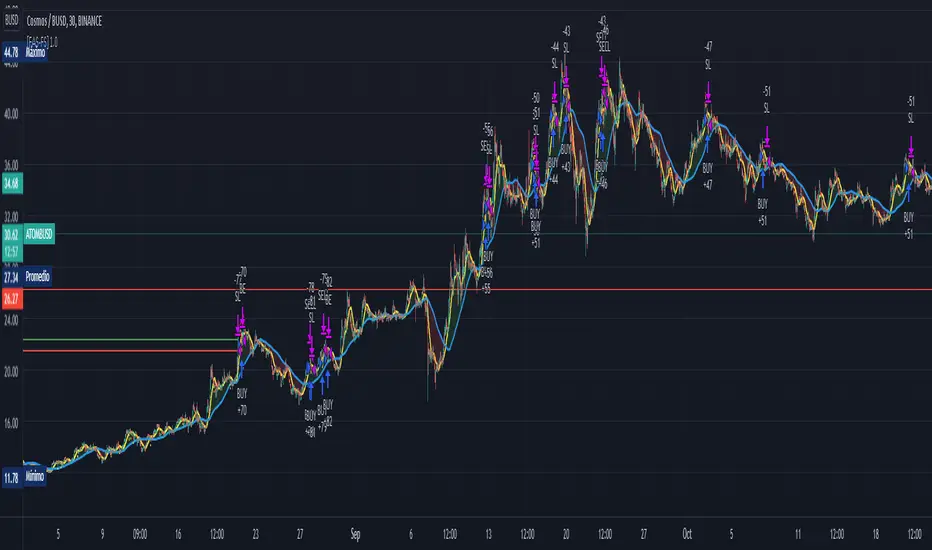
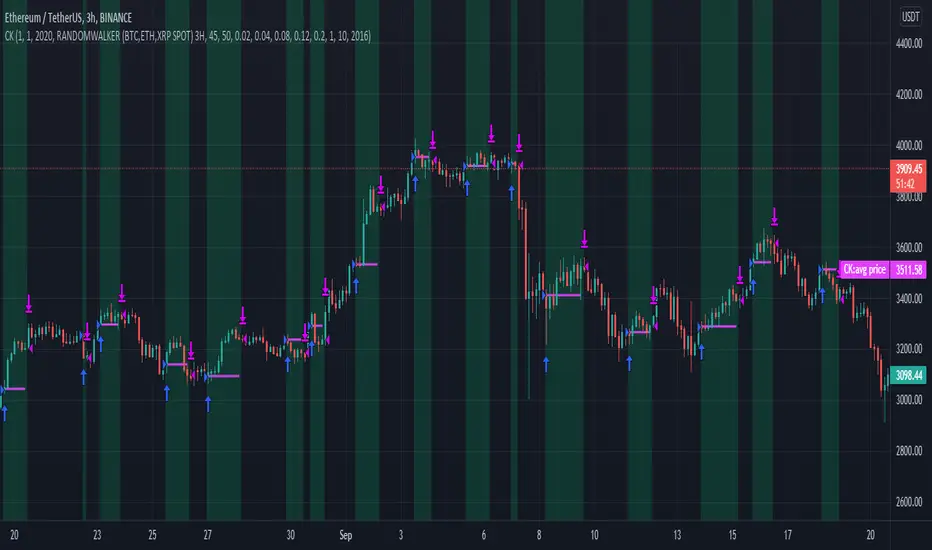
CryptoKillerCryptoKiller is a trend following trading system. It provides entry and exit points, a money management system and a trade management system.
The entry points (fuchsia line) are determined by CryptoKiller Oscillator (see other published script to understand how the oscillator works).
The trade management system provides the exit points in profit and in loss. This script works with multiple take profits (green lines), the initial position is liquidated little by little as the trend reaches the profit targets. Trade management also provides trailing stop exits to save the remaining profits.
Stop loss (red line) take into account the recent past of the chart to be determined, while take profits are fixed and have been calculated based on historical volatility.
The money management system is very simple, it plans to enter a position with a fixed percentage with respect to equity.
CryptoKiller, during an operation, also draws supports and resistances on the chart - determined by the oscillator (orange lines) these supports and resistances are used as a filter to understand where there is the greatest probability of trend development (some entry points provided by the oscillator will therefore not be considered by CryptoKiller as entry points, as in disagreement with the traced supports / resistances).
We know that an error appears in the backtest calculation, where the script is said to suffer from a bias, so the backtest calculation may not be accurate. Actually this happens in high times like H4 or daily, but CryptoKiller is not designed for these timeframes. it is a short-term strategy.
For more information read the author's instructions to contact us, we will send a PDF file with a more complete explanation of the strategy accompanied by screenshots.
Access to this script is granted along with access to CryptoKiller Oscillator.
Crypto Strategy for Bearish Markets (Binance, FTX, Futures...)BINANCE:BTCUSDTPERP
Even in months like May '21 you can win by going long on Bitcoin. This strategy proves it and is not overwhelmed by Elon's ...
The backtest was carried out during the month of May of this year and, as you can see, all the long operations opened during the fall were successful.
So if we are going to continue to have a bear market for some time, why not take advantage of it while we remain bulls?
This strategy uses Dollar-Cost-Average (DCA) to average the entry price. Thanks to this, it is able to close profitable trades even in times of great volatility and bearish pressure.
It includes alerts that can be configured that will be sent every time the conditions to operate are met. These alerts can also be linked with 3commas for a fully automatic operation.
For Leverage Futures or Margin traders, all you have to do is divide the initial capital by the leverage used.
Enjoy!

MACD oscillator with EMA strategy 4H This is a simple, yet efficient strategy, which is made from a combination of an oscillator and a moving average.
Its setup for 4h candles with the current settings, however it can be adapted to other different timeframes.
It works nicely ,beating the buy and hold for both BTC and ETH over the last 3 years.
As well with some optimizations and modifications it can be adapted to futures market, indexes(NASDAQ,NIFTY etc), forex(GBPUSD), stocks and so on.
Components:
MACD
EMA
Time condition
Long/short option
For long/exit short we enter when we are above the ema, histogram is positive and current candle is higher than previous.
For short /exit long , when close below ema, histo negative and current candles smaller than previous
If you have any questions please let me know !

Trend Surfers - Premium Breakout + AlertsTrend Surfers - Premium Breakout Strategy with Alerts
I am happy today to release the first free Trend Surfers complete Breakout Strategy!
The strategy includes:
Entry for Long and Short
Stoploss
Position Size
Exit Signal
Risk Management Feature
How the strategy works
This is a Trend Following strategy. The strategy will have drawdowns, but they will be way smaller than what you would go through with buy and old.
As a Trend Following strategy, we will buy on strength, when a breakout occurs. And sell on weakness.
The strategy includes a FIX Stoploss determined by an ATR multiple and a trailing Stoploss/Takeprofit also determined by an ATR multiple.
You can also manage your risk by entering the maximum % you are willing to risk on every trade. Additionally, there is an option to enter how many pairs you will be trading with the strategy. This will change your position size in order to make sure that you have enough funds to trade all your favorite pairs.
Use the strategy with alerts
This strategy is alert-ready. All you have to do is:
Go on a pair you would like to trade
Create an alert
Select the strategy as a Trigger
Wait for new orders to be sent to you
Every Entry (Long/Short) will include:
Market Entry (Enter position NOW!)
Stoploss price
Position Size
Leverage
* If you do not wish to use leverage, you can multiply the Position Size by the Leverage. But doing that, you might end up with a position greater than your equity. Trading on Futures is better in order to have accurate risk management.
Exit signals:
When you receive an exit signal, you need to close the position ASAP. If you want to keep your results as close as possible to the backtest results, you need to execute quickly and follow what the strategy is telling you.
Do not try to outsmart the strategy
Leave your emotion out of trading! If you trust the strategy, you will have way better returns than if you try to outsmart it. Follow each signal you receive even if it doesn't seem logical at the moment.
Become a machine that executes. Don't look at fundamentals. Follow the trend! Trust the strategy!
I hope you enjoy it!

Crypto price action strategy long onlyThis is a very powerful strategy, which I adapted mostly for futures perp pairs like BTCUSDTPERP or ETHUSDTPERP.
Its made purely of price action rules like :
We check for the last down candle before a sequence of up candles, or the last up candle before a sequence of down candles.
At the same time I combine with other rules ,like for example during this sequence comparing the actual candle high and low with the min/max of the candles from the sequece before establishing if its a potential entry or not.
So far I have noticed that it works greatly with big timeframes 1h+ .
The results from above are using 1h on BTCUSDTPERP binance, together with 4 on length and 0.03% comission for futures on perp binance
If there are any questions , let me know in private !

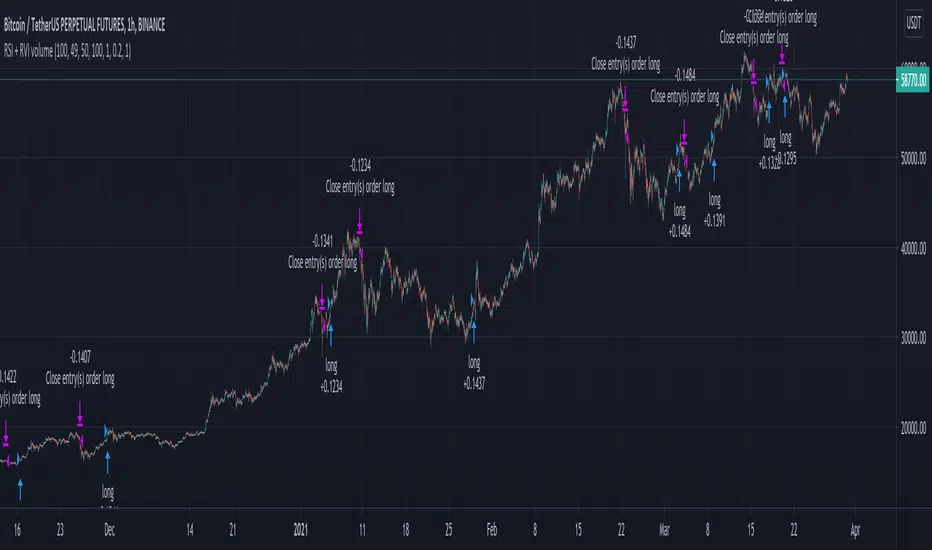
RSI and RVI on volume crypto BTC This strategy combine special version of RSI and RVI , where in this case , I am using the volume , for measuring the speed and change of volume to the price both up and down size together with the volatility spikes.
In this case instead of looking at the volume or volatility, I am combining them into one oscillator.
For best usage, I believe a big length of candles like 100 can get better results, and use it in this way as a lagging indicator.
Since most of the tests I made for futures, I applied a risk management in % of the price movement. For stop loss we have 20% while for TP, 100%. However in both cases, we will exit sooner, and thats going to be when condition from the oscillator says so.
For this we have a middle level, 50, which will act as both overbought and oversold areas.
At the same time I apply the posibility of using leverage into size calculations for more precise tests and try to get min-max out of it.
If you have any questions, please let me know !
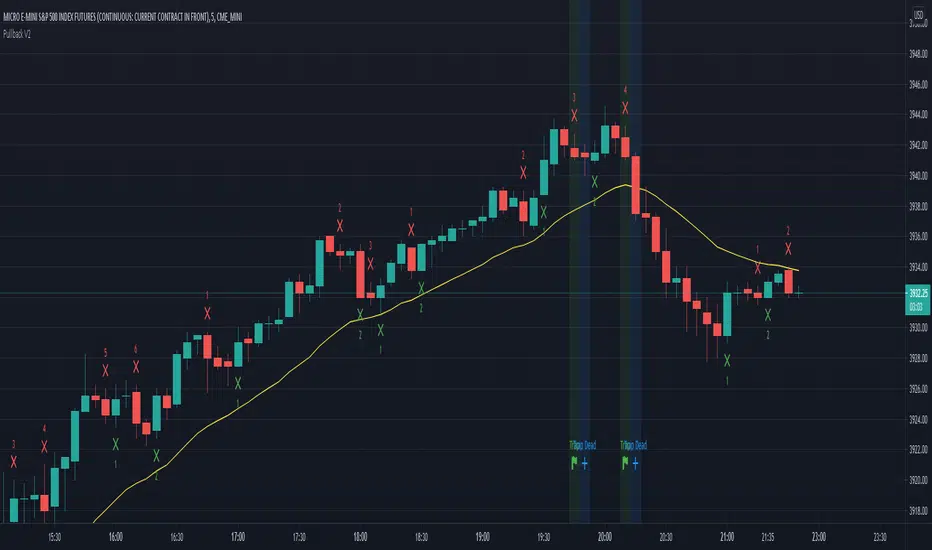
Pullback Traps v. 0.1Trading Strategy for scalping the CME_MINI:ES1! and CME_MINI:MES1! futures on the 5 min. time frame.
The strategy will count legs and look for failed pullbacks and failed second entries where shorters get trapped.
How to use:
When a trap occurs (Marked with green light) place an order one tick above the high of the trap and enter on next candle
If entry doesn't happen on next candle and it has a lower high, move entry to one tick above high of that candle.
Keep doing the above until you enter or until a candle is marked with a blue light and the text Trap Dead.
If you see Trap dead and you haven't entered, quickly cancel your order.
What is green light?
A second or later pullback down away from the uptrend. When the green light is present the shorters haven't made a 1 point profit and short scalpers are trapped.
What is blue light?
1. Shorters made their 1 point profit and trap is dead. Cancel your trade. Or...
2. Shorters hit their stop loss and you're probably in a trade now and about to profit.
Profit and stop loss:
Numbers are done with profit 5 ticks and stop loss 30 ticks.
Should I have a stop loss 6 times greater than profit?
Probably not. The numbers you see here are made with these profit and stop loss figures but I don't advice it in real trading.
The numbers look good on this backtest but in reality a few bad trades would ruin everything.
This was made purely for fun and sim trading - Feel free to do your own testing and show the resulsts.
GG ES Scalp IBTT Momentum Strategy v1.0Script for Scalping the ES. Apply it to a 15 second chart. The Momentum Multiplier is a float input and the lower the number the less conservative the strategy is. It doesn't fire signals everyday but its pretty accurate. Send me a message to get access.
CME_MINI:ES1!

Heikin-Ashi Change Strategy/ Indicator
Today I bring you a simple and efficient indicator/strategy based only on HA.
Can be used together with other TA tools or alone.
The idea behind is simple :
We have to forms to calculate the candle, using inner HA candles or normal candles. Once we have that we apply certain rules to get the max high, min low, open and close(ohlc)
With that then we check for changing in the patters like for example
For long close is higher than open and the previos close is lower than open. For short is going to be the opposite of long condition.
For the purpose of this example, I only use long direction and exit once we have the short signal.
If you have any questions, please let me know in private chat !

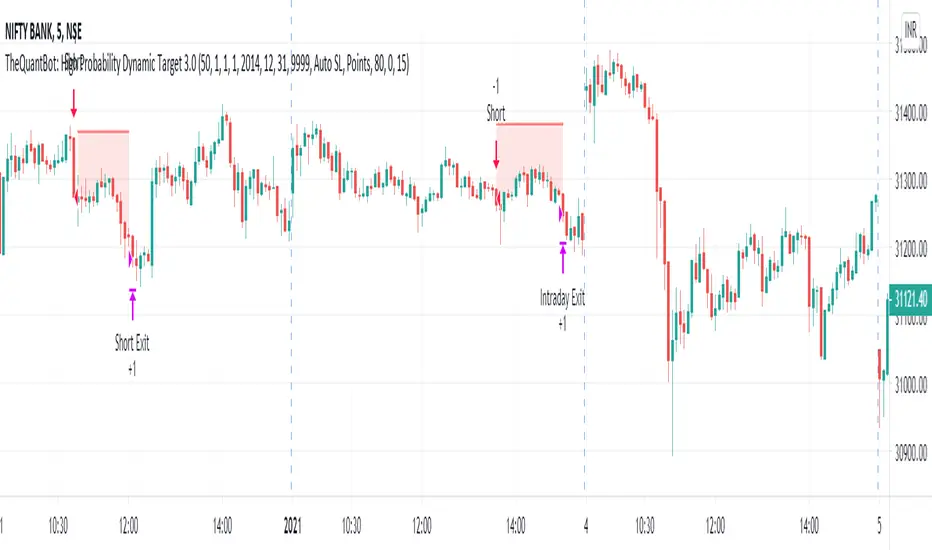
TheQuantBot: High Probability Dynamic Target 3.0This is the first indicator of TheQuantBot series. This is purely for educational purpose and this indicator might get modified in future as well. This is for intraday purpose and works on BANKNIFTY.
Trading Logic behind this indicator:
It it based on price action and considers support and resistance for entry and exit points.
If the support is broken then it enters long whereas if the resistance is broken it enters short.
The long and short entries are filtered by two other technical indicators like EMAs.
It will not take a trade if the market is highly volatile.
In input parameters you can set your risk taking ability based on which it sets the risk: reward ratio.
The default quantity entered in this indicator is 1 with initial capital set to 100000.
If you consider Indian discount brokers, you can buy 50 quantity at the same price, you can increase the quantity to check results with different scenarios.
In input parameters there are three options to set Stop Loss, you can set Auto SL , Manual SL with and without Trailing option, you can set Stop Loss both in points as well as percentage .
The profit target are dynamic in nature and it depends on the market volatility.
You can play around the back test start and end date to see its historical performance over different span of time.
This results are based on back tested data, in real scenario many other factors might differ the results.
*********************************************PM us to obtain access******************************************************************************************************************************************
MavilimW Strategy MTF EMA with HA CandlesThis is a strategy adapted initially for Mavilim moving average indicator, based on WMA MA.
It seems to works amazingly on long term markets, like stocks, some futures, some comodities and so on.
In this strategy, I form initially the candle, using EMA values, so I take the EMA of last 50 closes, open, highs and lows and form the candle
After this I take interally HA and convert the EMA candle to HA.
Then using the moving averages on multiple timeframes, like in this example we have a chart on 4h, but I use 1h and 1d moving averages.
For long condition we have : close is above moving average timeframe1 and oving average timeframe2 and oving average timeframe3
Initially short would be close below ma timeframe1, ma timeframe2 and timeframe3 -> but here I also convert it into a long signal.
So we actually go only long .
And we have 2 different exits : for first long if we have a crossdown of 1h ma with 1 day ma, and for second long if we have a cross up of 1h ma with 1 day ma in this example.
Message me if you have any questions about this strategy.

Heiken Ashi MTF Strategy- IndicatorHello, this is both a strategy and indicator that revolves around Heikin Ashi candles.
In this case we take 3 different time frames, in this example we use daily , weekly and monthly.
The conditions for entry are :
For long : we check that we have a green daily candle, at the same time we check that the weekly and monthly candles are also green.
For short : We check that all candles, daily, weekly and monthly and red.
For exit of long : as soon as 1 of the 3 candles, daily or weekly or monthly converts to red, we exit.
For exit of short : as soon as 1 of the 3 candles converts to green, we exit.
This strategy- indicator can be adapted to any type of market.

Profit MAX MTF HeatMapThis is a powerfull strategy which is made from combining 3 multi timeframes into one for profit max indicator
In this case we have daily, weekly and montly.
Our long conditions are the next ones :
if we have an uptrend on all 3 at the same time, we go long.
If we have a downtrend on all 3 of them at the same time we go short.
For exit, for long, as soon as one of the 3 converts into downtrend we exit the trade.
For exit, for short, as soon as one of the 3 converts into uptrend we exit the trade.
This tool can be used on all types of markets, and can also be changed the time frames.

BUY/SELL_Strategy_Paydar_V.07BUY/SELL_Strategy_Paydar_V.07
Hello dear friends
This system can be considered as a signal system.
*** This system just Suggests you for points. ***
My suggestion is not to use this system alone and conclude about entry and exit points according to charts, news, market fluctuations and trend direction.
The agenda of this system is as follows:
- Buy signal means:
Time to enter the trade / buy / take a long position and ...
- Sell signal means:
Time to leave the trade / sell / exit the long position
* I suggest you use this system in trading for cryptocurrency and especially for bitcoin.
* My suggested time frame is 1 minute, because during this time and according to the settings of this system, a better result was obtained for me.
* I suggest using this system first in spot trading and then in future trading.
System function:
This system is based on the analysis of 74 different systems, which are:
> 19 indicators and oscillators separately which include:
MACD, RSI, STOCHASTIC, STOCHASTIC RSI, BOLLINGER BANDs, PARABOLIC SAR, VOLATILITY and ...
(All of which can be used on the Trading View site as a public domain and open source)
> 11 cases of previous oscillators and indicators in combination
(All of which can be used in public view and open source on the Trading View site)
> 27 items MA, EMA, VMA, WM, MSM, etc. in combination and separately
> 9 lines and areas of automatic support and resistance
(All of which can be used in public view and open source on the Trading View site)
> 8 different strategies, all of which can be used in public view and open source on the Trading View site
Points.
*** All indicators, oscillators, lines and areas of automatic support and resistance, strategies, etc. can be used as a public domain and open source on the Trading View site. ***
Comment on using this system as well as how to use it.
_______________________________________________________________________________
* In this system, the main and basic indicators and oscillators are used, all of which are in the public view and open source site in Trading View *
I am very grateful and very loyal to Trading View, which built all the indicators, oscillators and strategies, because I used them to build this strategy system.
_______________________________________________________________________________
Be successful and profitable.

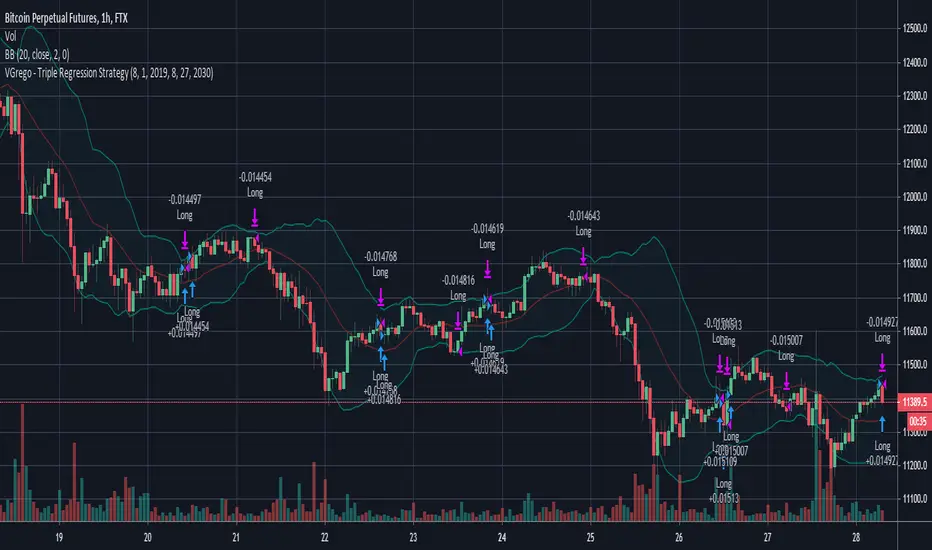
VGrego - Triple Regression StrategyI developed this strategy with perpetual contracts like the ones offered by Bitmex and FTX for Bitcoin.
This script uses complex regressions to analyze past, present and future to place long calls.
The script performs well on 1H charts on most perpetual contracts scenario.