GOLD FUTURES TRADING STRATEGY AND SIGNALS WITH PERFORMANCE GOLD FUTURES GOLD1! , GOLDM , GC Trading Strategy And Signals, With Performance For Different Time Frames.
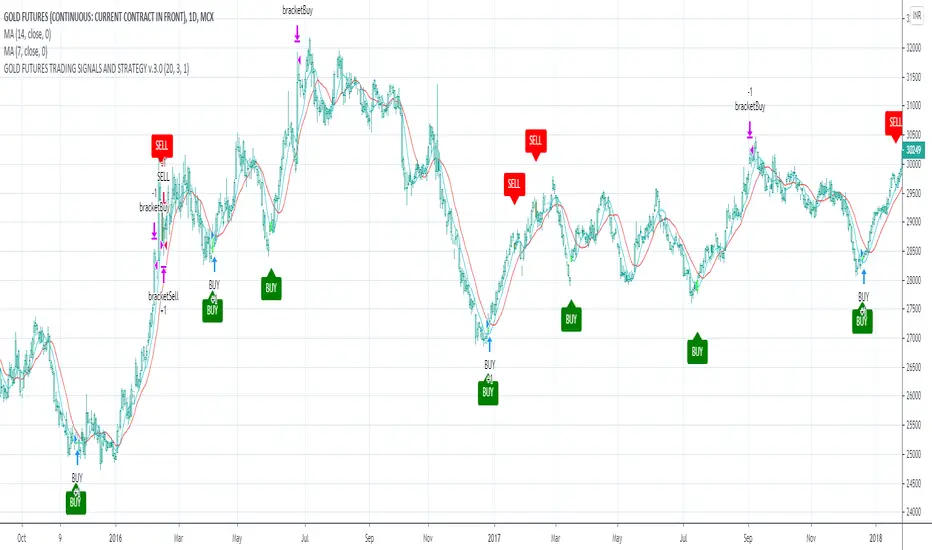
We present to your attention an indicator that, based on a strategy, generates buy / sell arrow signals and a gold futures trading strategy, which has shown its effectiveness in numerous tests on different time frames.
The strategy is based on a combination of ATR, Moving Average, MACD and RSI indicators.
If you consider gold as a tool for earning then active trading on the exchange, your choice is gold futures (gold futures). This derivative almost completely copies the movement of the price of physical gold, and is used by traders around the world to obtain from the fluctuations in the price of gold.
The strategy showed the best results for timeframes: H1, H2, H4, D1.
Recommended timeframe for this strategy: D1.
The strategy uses take-profit and stop-loss, which reduces risk and allows you to effectively use its trading, as well as the process of making trading decisions and predicting the movement of the gold price.
Gold and silver futures can be used to hedge against inflation, speculative play, an alternative investment grade, or as a commercial hedging method for investors looking for opportunities beyond traditional equities and fixed income securities.
The script can generate alters "Buy" and "Sell".
The presented indicator of signals for gold futures, as well as the strategy, can complement your existing strategy and increase its performance, and can also be considered as an independent trading strategy for gold futures contracts.
Full Screenshot chart with performance here.
Goldtrading
BlueFX Strategy GOLD M15We are releasing this separate script file for trading Gold on the M15 time frame using our strategy. This can now run independently from the main file instead of changing parameters and saving as a template - thus making the use of these specific settings even easier for our traders.
You can see the back testing profitability shown below, although you can not use back testing to predict the future, both the volume of trades, net profit, win rate and draw down demonstrate a solid foundation and data to move forward from.
The strategy itself is explained in the 'Blue FX Strategy' but see below too for more info.
Our strategy will help you identify the current trend in the markets and highlight when this is changing. The strategy itself is based upon 4 indicators lining up in total confluence to increase the probability of the trade being a success.
Absolutely no technical analysis is needed to trade this - this is a trading tool and has solid back testing results trading in isolation - although you may also use to support your own trading - the choice is yours.
When a trade is valid - a Buy or Sell label will appear with the Entry price, SL and multiple TP's shown on the chart.
IMPORTANT note, the test results show and confirm that the most profitable exit strategy with these Gold settings is 'FT&SL' this means we enter the trade with a Stop Loss (SL) and simply hold and follow the trend (Follow Trend = FT) until a reverse signal is printed.
In our supporting video (see related ideas) you can see the impact of changing this target between multiple TP's and the net effect on both win rate and overall net profitability.
The Lot size will also be displayed and this is based on the risk parameters you have set personally in the calculation section.
What is a Trading View Script?
A script is like an indicator but better, we can verify the success of our strategy by using Trading Views strategy tester function. As shown below and on the chart - you can see the 'Buy' and 'Close Buy' on the chart, supported by a live trading log showing you the entry, entry price date, volume and closing price.
This is a great function for numerous reasons; firstly, you know you are using a strategy that has provided a positive expectancy in back testing, secondly you can use this as a trading journal to support your trading too. This in itself can help you with your trading psychology - letting winning trades run is a prime example of this. Take confidence in the statistics and performance over time.
Ultimately, we believe we have saved YOU the need to firstly, find an edge and a strategy - and all of the time it takes to BACKTEST a strategy - to then find it may or may not work - and then you start again!
Disclaimer alert; Please remember past performance is exactly that - how our strategy performed over those dates tested, it is not obviously a guarantee of future performance.
Interested in access or more information?
No problem, simply drop us a DM via trading view for access information.
Thank you for reading.
Darren

GOLD SUPER TREND ARROW SIGNALS STRATEGY WITH PERFORMANCEThe strategy is based on combination of ATR, Moving Averages, Volatility indicators that was filtered and final strategy based on accurate arrows that catch trend and
also predict pivot points for intraday Gold ( XAUUSD ) charts.
The strategy script can be used for time frames 30 MIN, 45 MIN, 1Hour, 4 HOURS.
The goal was to create trending strategy with maximum profit and lowest drawdown.
For initial deposit $12000 time frame 30 MIN profit was 42% with maximum drawdown 6%:
For time frame 45 MIN profit was 30% with maximum drawdown 5%:


Gold trading strategy with trend follow and TDOW conceptMy strategy uses a combination of three indicators MACD Stochastic RSI.
The Idea is to buy when ( MACD > Signal and RSI > 50 and Stochastic > 50) occures at the same time
This strategy works well on stocks and cryptos especially during market breaking up after consolidation
The best results are on Daily charts , so its NOT a scalping strategy. But it can work also on 1H charts.
The strategy does not have any stops and profit targets, so we can take all the market can give us at the moment.
The exit point only when MACD goes under Signal
In addition I've decided to add a stop loss and "Trading day of week" concept
So the results are much more stable and we get more profit !
So, use it, trade it.
If it will help you to imprive your trading results, please donate me
BTC: 12kd1F8buWisUBdq27BBwRkUvzW7Ey3og5

Profit Maximizer 90%-95% IntraDayTrade Strategy WithTester Developed for Intraday and for very very Lesser Time Frame Trading. Note: Invite only Script .Request to me Access permission to test this.
Strategy tester enabled .All you can test this in live market in any segment.
Lesser the time frame greater the success rates as the test results.
This can be used : Crypto Currency/Bitcoins ,Forex,currencies ,Index ,Commodity Gold/silver ,Oil Market and in Equity /Futures
It will work for BINARY OPTION ,BINARY DIGITAL to enter and hold the position in right direction, User test it and confirm .
How to Use:
Three Main Zone BackGrounds: 1. Green Zone 2. LightRed Zone 3. Yellow Zone
1.Long only when Bar Color changed from Red or Black to BLUE and BackGround in Green, Hold the position until opposite color comes.
2.Short when BAR become Black and BackGround Red Exit when opposite color come.
3.Yellow Back Ground : Risk Trade Zone : When Red BARs Cautious Short , Yellow Zone LightGreen Bars (Avoid Trade) .In Yellow Zone Close the previous Entered postions.
Time Frame : Lesser Time Frame and holding for longer time will give Good Result . 1min-1Hrs . This will not work >1Hr Strategy and Candle will disappear >1hr TimeFrame.
Strategy Tester : Choose any Date Month Year to Current Date and check the results below in the Strategy Tester.
REPAINT/NO REPAINT : No Repaint ,Previous candles and Background Color wont change. In the current candle position wait for the candle to close to see the stability.Current candle color might oscillate bit However it will not change from Blue to Black or Black to Blue or Black to Red.
Note : Last Bar will be a actual Green or Red Bar by Default Do not Confuse with this.It is trading view default strategy design working way.Once Bar closes actual strategy color will appear.
ALERT /AUTOVIEW capabilities : Strategy Tester does not support ALERT by default as you all know.In the Indicator version Alert will be added for all Buy Sell and cover entries.
Test the strategy.
SCRIPT : Access must be given by me to test this .Once access given you can test ,Request for access .Without access Study Not Auth error will come.
Review and Feedback.Thank you!
Refer the Release notes for any updates and my posts below and in my idea page for more details. Thank you!
Any issues report to me to Fix.Thank you!
