Grid Bot SimulatorThis script is a grid bot simulator for ranging/choppy markets. Prices are divided into grids, or trade zones, that will trigger signals each time a new zone is entered. During ranging markets, each transaction is followed by a “take profit.” As the market starts to trend, transactions are stacked (compare to DCA), until the market consolidates. No signals are triggered above the Upper Limit or Below the Lower Limit.
Settings overview:
Upper Limit/Lower Limit : Highest and Lowest values for entire grid.
Number of Grids : Number of trade zones.
Show Grids : Show or hide all gridlines.
Show Only Current Grids : Only display the grids just above and just below the current trade zone.
High/Low for signals : If enabled, signals are triggered as soon as the price touches the next zone. If disabled, signals are triggered after bar closes. Enable this for “Once Per Bar alerts. Disable for “Once Per Bar Close” alerts.
Highlight Trade Zones
The grid bot should work well during ranging/choppy markets. Each zone will have only one trade, and then will immediately take profit in the next zone.
Ranging/Choppy Market
However, trending markets can produce multiple signals in rapid succession:
Trending Market
If the gridlines are compressing the chart space, enable the “Show Only Current Grids” in settings.
Show Only Current Grids disabled
Show Only Current Grids enabled
When changing symbols, adjust the Upper and Lower Limits to accommodate the new symbol. Otherwise, the chart will look compressed.
XBTUSD chart with ETHUSDT settings
The bot is a proof-of-concept and is considered experimental . Possible future updates will include Fibonacci grids and “smart entry/exits,” depending on the current trend. Comments and suggestions are encouraged.
GRID

VPR Grid█ OVERVIEW
Official release of VPR Grid, a mean reverting, trend discovering tool meant to protect capital and find high probability entries.
What this indicator is meant to be used for:
Mean reverting trades
Entries or exits for either swing trades or scalps
Traditional and cryptocurrency markets
Low and high timeframe setups
Sentiment checks
Options to configure:
Optionally use volume in analysis
Use intraday, daily, weekly, or month calculation + choose how many periods of each
Moving average length. This is best kept on the lower end for cryptocurrencies, with respect for volatility
Grid spacing: a purely comestic option that should help with viewing the indicator.
The most important thing to use VPR effectively is to use its settings. The flexibility of VPR Grid is given through its settings. The development that went towards mean reversion and trend discovering means it is a hybrid of fading and trend following tools.
This is a paid premium indicator; please DM me for access. See the images below for examples/explanations on the indicator. Take note of the indicator arguments and which settings were used for a certain timeframe or asset class.

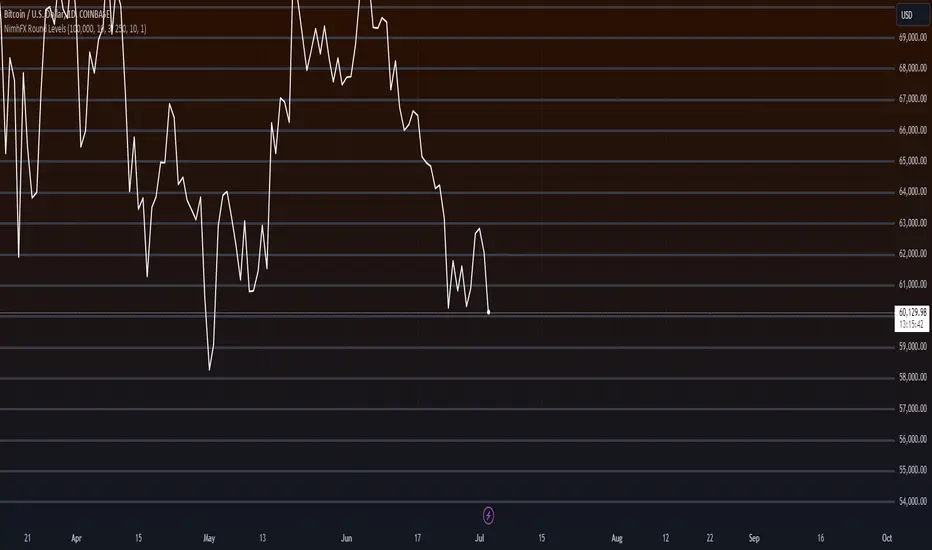
NimhFX Grid LevelsA simple levels indicator for plotting pre-defined price grid.
The default setting is as follows:
Group 1 shows 1000 Point (100 Pip divisions)
Group 2 shows 250 Point (25 Pip divisions)
Groups are duplications of each other to allow multiple divisions to be visible at once, e.g. 100 Pip grid and a 25 pip grid with differing visuals as the default setting.
Number of Lines above/below will alter the amount of lines drawn, change as required, note: Tradingview seems to try to capture all drawings when double-clicking the right price index which can cause this to compress the data.
depending on preferred timeframe you may want to alter this for example to a 10 pip grid (100 point)
Trading with GridThis indicator helps you to negotiate through the grid. You must depend on a flag to start trading. In the indicator we use a weekly moving average with 20 periods.
Use volatility for larger timeframes.
Note that the gray spaces are minimum and maximum, weekly and monthly. If the price goes out of that range, it usually has greater volatility.
The grid has 28 lines.
Purchase order preference.
Once you lose the moving average:
- buy level below
- sale level up.

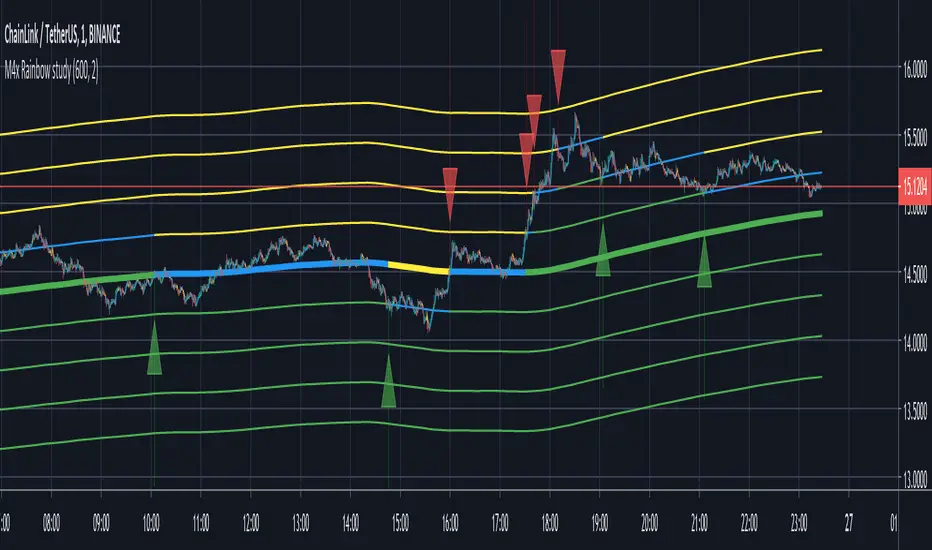
Real Grid Trend Multiplier & SMA Final Real Grid Trend Multiplier & SMA
"M4x Rainbow" is a Grid Trend Multiplier bot, who is following an adjustable SMA.
Settings:
- Profit % per Step (0-1000%)
- SMA lenght (0-4000)
Alerts: (one Alert is one step)
- longRain
- shortRAIN
The coloring of the lines is:
green = linestate is LONG
blue = linestate is WAIT
yellow = linestate is SHORT
!!! Tested only on 1 Minute Chart !!!
Give it a try and let me know.
...have fun ;-)
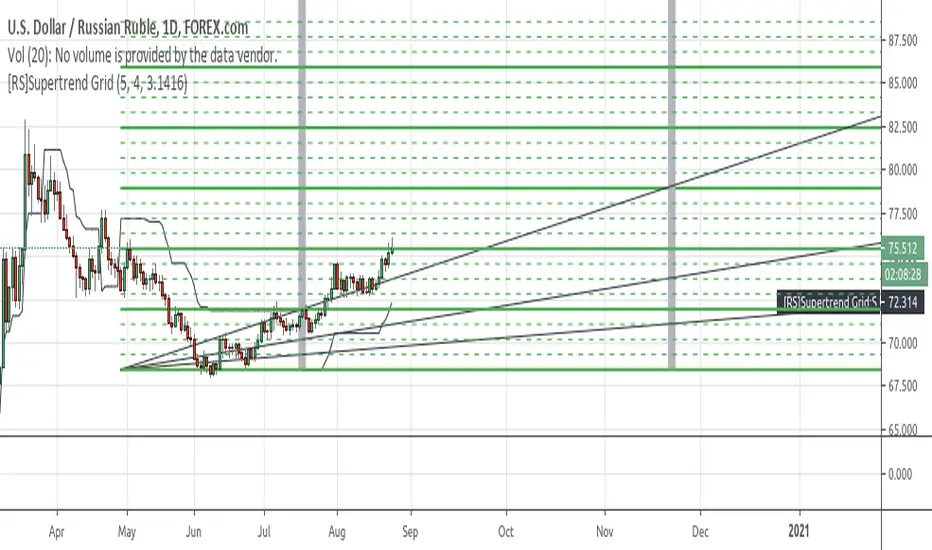
[RS]Supertrend GridDynamic grid system based on supertrend.
note: the input nlines/nfractions are not locked so if values too high might start overlapping line objects.
[HM] HORIZONTAL GRID ROUNDED (VOLATILITY BASED)The purpose of this indicator is to draw a horizontal grid having in mind:
- rounded price levels instead tradingview standard grid, zoom-based;
- calculated by volatility, using daily ATR;
- independent of timeframe in use, locked to DAILY calculations.
Further improvements are intended.
Wish this could be useful. Any questions, feel free to comment.
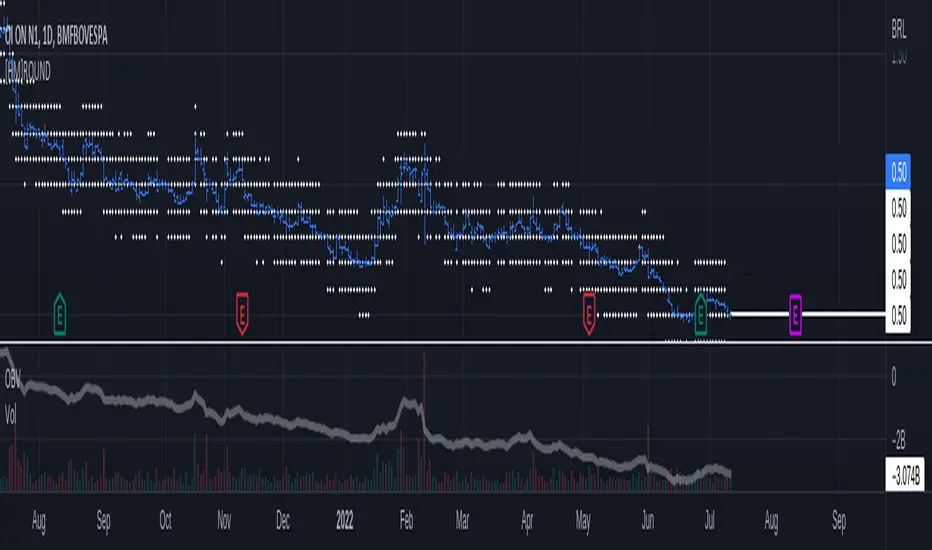
BoilerRoomColdCaller - 3Commas Grid Bot SignalThis is very similar to 3Commas' grid bot, the range is from the previous 7 days' lowest low decreased by 3% to the previous 7 days' highest high increased by 3%, you can also adjust if you want 7 days' highest/lowest close price as your range or highest high and lowest low as your range. 10 buys and 10 sells within the range, the unit price would be (high-low)/19.
The buy signals and the sell signals will be triggered if:
- The previous close is below one specific green line (buy line), and the current close is above that specific green line, or
- The previous close is above one specific green line (buy line), and the current close is below that specific green line
Thus, whether the price is dropping below these lines or rising above these lines, a buy or sell signal will be triggered when they cross green or red lines. Your entry price will be the next open price after this candle's close reaches the lines.
Big thanks to @glaz, who helped me a lot with this script. Please give a like button and share if you like this script. Let me know if you have questions, thanks guys.

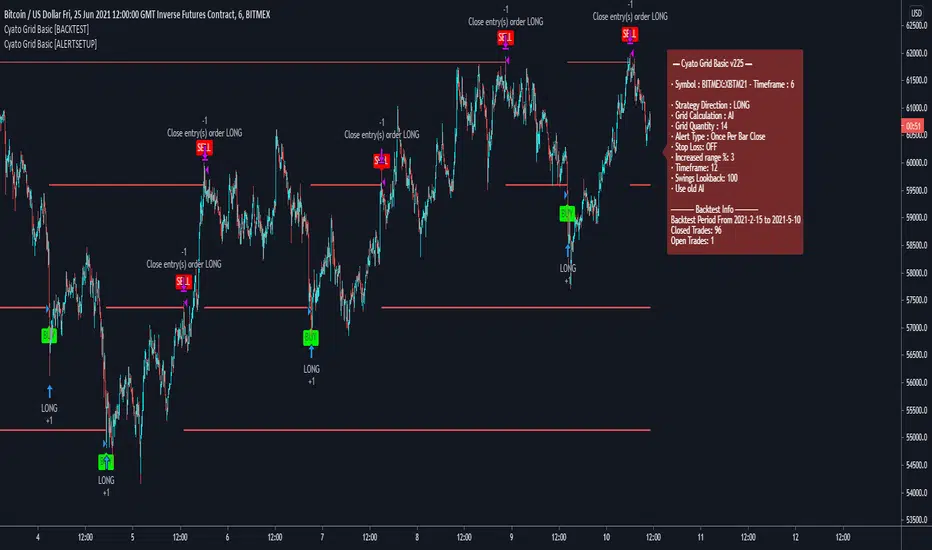
Cyato Grid Basic Buy & Sell [ALERTSETUP]Private indicator
This Grid bot strategy creates buy orders when the price goes down one level or more, and sell order when the price goes up one level or more.
To avoid useless trades, the lastest traded level is disabled until another level is crossed.
To create the grid, one upper level and one lower level is calculated. Those 2 levels are either given by the user using "MANUAL" mode or automatically calculated by an AI. The space between these two levels are then divided equally into several steps, creating the grid. The number of steps is choosen by the user, from 3 to 20.
How it Works
This is the Alert Setup version meaning this is the one you should use to create alerts (more below).
Select either "MANUAL" or "AI" mode.
When using "MANUAL", you have to configure an upper level and a lower level.
When using "AI", the upper and lower level are automatically calculated from last swing high/low.
Select the grid quantity, from 3 to 20.
Example with 3:
Example with 10:
Example with 20:
Creating the Alerts
When opening the alert popup, select "Cyato Grid" in the condition.
Make sure to use the option "Once per bar close" in order to stay in sync with the graphics on chart. (Only use "Once per bar" if you really know what you are doing).
Available alerts:
- BUY : Buy alert. Green label on chart.
- SELL: Sell alert. Red label on chart.
To get this indicator, use the link in my signature below, thanks!
Example - How to create multiple level gridsExample on how to create custom grids with variable N lines/labels:

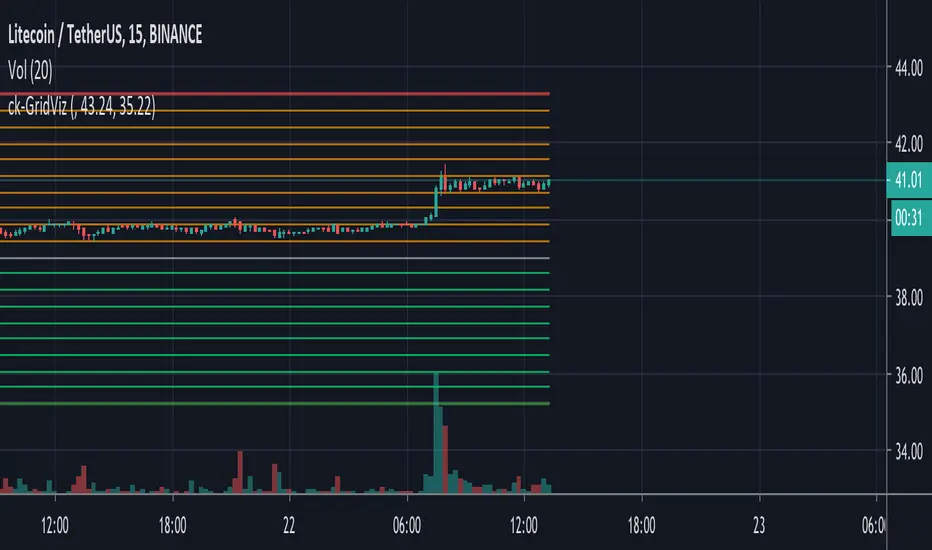
ck - 3commas GRID bot VisualisationHi,
This is a very quick script indicator to show the “grid” for an active (or one you are planning to manually configure) 3commas Grid bot.
To use, you’ll need to go to your Grid bot page in 3commas and enter the Upper and Lower Limit Values, either from the “manual” section if you are planning a new Grid bot, or from an open Grid trade by clicking the monthly button and using the Upper value (in green) and the Lower value (in red).
Have fun!
Multi Bar OHLC Compare Panel (Floating Grid)Multi Bar OHLC Compare Panel by RagingRocketBull 2019
version 1.0
This indicator lets you compare OHLCV values from several specified bars. Bars can be dynamic/persistent.
You can also use it as an alternate OHLC panel if you don't like small font of the native TradingView panel.
It uses Pinescript v4 to output data dynamically as string labels in a horiz/vertical grid.
Features:
- Floating Panel with customizable horiz/vertical layout and grid spacing
- Support for up to 5 OHLC bars (highlighted with markers)
- Outputs Bar #/index, OHLCV, Bar Change Value/%, Exchange/Ticker, Timeframe, Timestamp strings
- Dynamic (fixed offset)/Persistent bars (fixed time)
- Show/Hide parts of strings
- Full output string customization, including text size, date/time format and delimiters
- 2 Anchor points for panel offset: cur bar high or range high
- Bar Change can change color
Usage:
- specify at least 1 bar index as OHLC source
- select anchor point to position the panel
- select horiz/vertical grid layout
- adjust horiz/vertical spacing
- customize output strings as needed
Notes:
- this indicator uses Pinescript v3 Compatibity Framework
- both bars 1,2 are required for log scale adjustment to work
- you can't attach the panel to screen's top/bottom and must use offset/anchor because, unlike plotshape, string labels don't support yloc=yloc.top/bottom, only yloc.above/belowbar
- you can't precisely align strings in a grid because there's no label.get_width/height to calculate mid/left points, only get_x/y/text. Alignment will break depending on string length, zoom and change color option on/off
- bar change is rendered as a separate label when change color is enabled (2 panels total) and merged into the main panel when disabled (single panel)
- you can't change the order of strings as playing with the natural order of things isn't the best of ideas
- you can modify the script to compare up to 50 OHLC bars, but do you need that much power? Of course, you do.
- you can't set color/style for string labels in Style UI, so a few extra settings were added.
- bar index is limited to 5000 for free accounts (10000 for paid), will show an error when exceeded, also when it exceeds the total number of bars in history
- in persistent bars mode all bars with index > 0 are considered persistent, bar 0 always remains a dynamic bar
- persistent bars' offset is reset: in replay mode on exit or when price reaches cur bar, or when panel layout is changed from h to v in both replay/realtime modes
- initial pos of each persistent bar relative to the first realtime bar anchor doesn't change during session - new persistent bars introduced during session are attached to the most recent cur bar anchor
P.S. Everything is proceeding as I have foreseen

Gann GridA script to draw Gann Grid given Cycle start point, Cycle space (size), Cycle type ( Bullish / Bearish ), Cycle shape, Time levels space and Grid size
The lines are customizable you can change their style and color
When you increase the size you may see that the Grids at the beginning are getting removed, that's pretty normal because TradingView has a limit of 55 line per indicator you won't need the old grids anyway but if you want you can decrease the size and they will show again
My Telegram :- @Kirolos_T


RSI_GridUses oversold/overbought conditions of RSI on multiple time frames to provide buy/sell signals.
Important points:
1. The highest time frame of the grid should be the one you are viewing on the chart. This helps avoid false signals.
2. The time frame inputs work on minutes, so if you want a 2 hour time frame you should input 120.
3. This DOES re-paint, but only up to the highest tf. For example, using the default settings, you should have a 1H chart and refresh the chart with F5 each hourly candle switch.
4. The red indicates oversold, green is overbought, grey is within normal range. The default alert condition is 4, this means when 4 time frames print overbought/sold and the next candle prints with less than 4 in an overbought/sold condition, an alert will trigger.
5. Pink is buy, blue is sell.
This is still a work in progress, but I kind of abandoned it once I realised how Tradingview plots indicators based on two different times (past and present). I can link an article if you are interested in the reasons why TV does this.

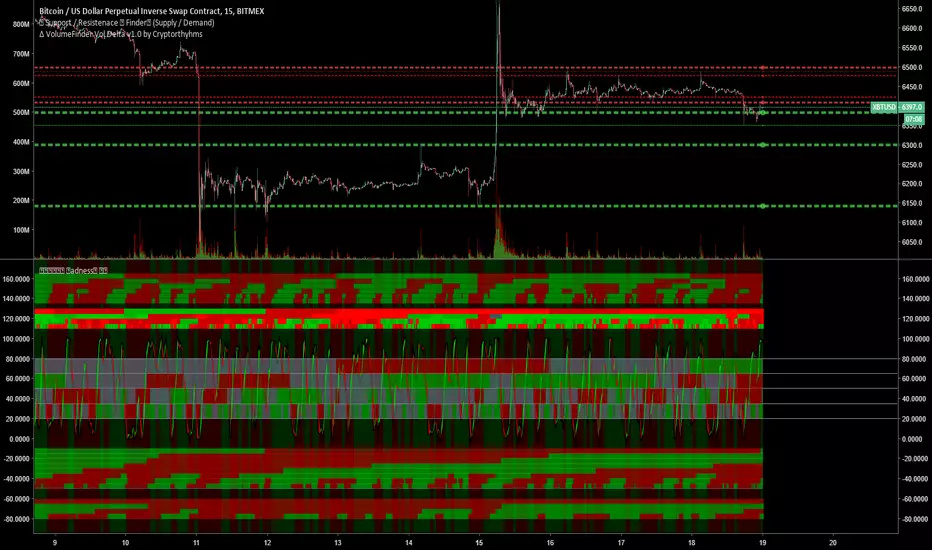
🕟𝕄🕗𝕋🕛𝔽 Madness MTF Grid by 🇨🇷🇾🇵🇹🇴🇷🇹🇭🇾🇭🇲🇸Here is a short description. This indicator being free will not have documentation for ALL things. Just the basics. There are 5 indicators included in it which I will not go into how each one works. There is ALOT of info on all the indicators included in here, just use google for that.
📊For each "row" of colored bands this represents one indicator. This is meant to be used on the 15m (or less) timeframe, and it looks up into higher TF's. It is meant to be maximized, so have this open in one tab and the chart on another. Dual Monitors are best. All options and Time frames are fully configurable inputs.
📈Indicators from top to bottom are:
1.)Polarity Filtration - 6 Timeframes
2.) Price Volume Trend - 4 Timeframes
3.) Stochastic RSI - 4 Timeframe Grid, and Current Timeframe in lines/ribbons
4.) MACD Crossovers - 8 Timeframes
5.)SuperTrend - 4 Timeframes
⏲Inside each larger "band" there are smaller rows. Each of these small rows represents one timeframe (30m, 60, 2h, 4h, etc) What timeframes you choose for them is completely configurable althought the current setup is already ideal to trade on 15m
⏲For these smaller rows the ones on top are highest timeframe(i.e. 4h) and the bottom small rows are lowest timeframe
⏲So each small row is like being able to check that indicator many timeframes at once. This will help you determine overall trends without switching to different timeframes on your chart all the time
📈The last piece of the puzzle is the background color. This background color is whether the chart is going up or down on the 1 hour heiken Ashi candle chart. Heiken ashi always shows up or down based on how they draw the candles, so its another useful trend indicator
👍If you enjoy MTF Madness all I ask in return is that you like the indicator and follow me on tradingview (profile here: www.tradingview.com)
❓If you have any questions, join us in the telegram chat in my signature!
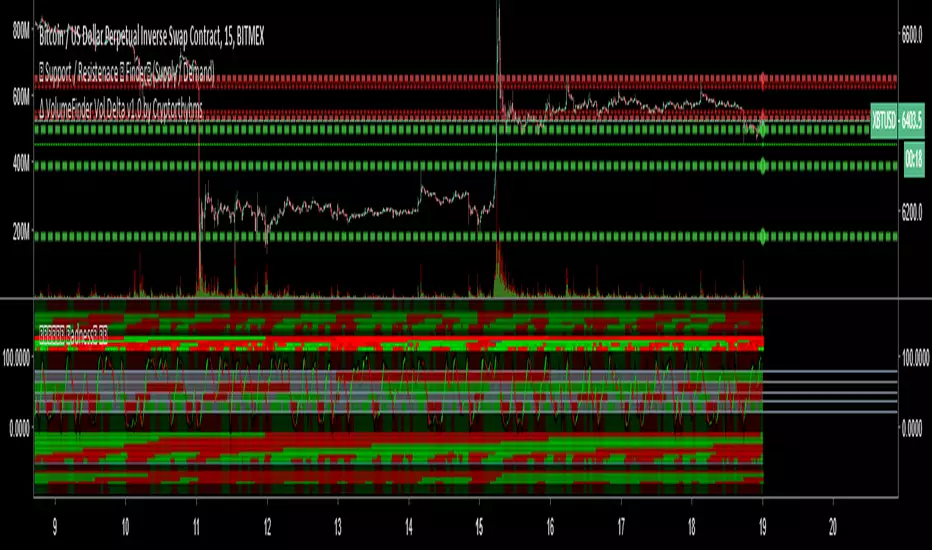
Neo BitMEX Futures Hedge Grid Alerts Premium v1.0This indicator was made to streamline finding the optimal entry to cash and carry/hedge on a futures contract when margin trading.
Explanation of the indicator:
This indicator has built-in alert conditions that you can use to give you email alerts, in-browser sound alerts, or SMS alerts. These alerts are based upon futures prices being in contango or backwardation.
From top to bottom, the grid shows XBTU18, XBTZ18, OkEx's Quarterlies (OKCOIN:BTCUSD3M), and CME's futures.
Red: Futures are trading above your defined range (default 1%) of spot
Maroon: Futures are trading above twice your defined range of spot
Lime: Futures are trading below your defined range (default 1%) of spot
Green: Futures are trading below twice your defined range of spot
What's configurable:
% to trigger
Grid size
Bar color toggle
Label toggle
Spot/index source (Bitfinex's BTCUSD, BitMEX's XBTUSD, and BitMEX's XBT Index are available)
Pricing:
Currently this standalone indicator is 0.007 BTC for lifetime use.
Example of use:
On 4 May 2018, BitMEX's XBTU18 was trading >2% above perpetual swap. The grid alerts signaled that and if one were long on bitcoin spot on any exchange, then it would have been a good idea to hedge a short on XBTU18. Eventually from there the premium gap was closed while bitcoin fell.
Here is the indicator shown with bar coloring and labels.

BottomFinder MTF Madness - 5x MTF Grid IndicatorsHello Again Trading View!
Bottom Finder Team here bringing another delicious indicator, this time to help spot those trends! This version is closed for Beta Testing with our subscribers only for the next few weeks. After beta improvements it will be released free to anyone who signs up as a free member on our site.
This is meant to be used on the 15m timeframe, and it looks up into higher TF's. It is meant to be maximized, so have this open in one tab and the chart on another. Dual Monitors are best. All options and Time frames are fully configurable inputs.
Indicators from top to bottom are:
1.)Polarity Filtration - 6 Timeframes
2.)Price Volume Trend - 4 Timeframes
3.)Stochastic RSI - 4 Timeframe Grid, and Current Timeframe in lines/ribbons
4.)MACD Crossovers - 8 Timeframes
5.)SuperTrend - 4 Timeframes
And last...
6.)Background Color indicator is up/down (green/red) price on 1 Hour Heiken Ashi candle chart.
No more swapping back and forth between timeframes!
For access to this and many other exclusive indicators - you can visit our telegram and ask about becoming a subscriber. All our paid indicators have a reasonable lifetime cap price. Once you reach it, indicator is yours for life - no more subscription.
DepthHouse RSI Grid MTFDepthHouse RSI Grid MTF is used to determine overbought and oversold levels based on the RSI across multiple time frames.
The default time frames are the 30m, 2H, 8H and 16H however these are completely adjustable.
This indicator also allows the user to select which RSI band to display based on the time frame.
The default is set to the current time frame, however the user can select any of the other four time frames.
OverBought & Oversold Levels are also entirely adjustable.
Meaning you can adjust the 30, 70 ranges, and it will alter the overbought and oversold values across ALL timeframes.
How to get:
As you can see this is an invite only script. In the coming month this indicator, along with many others will become pay to use only. (website on my profile page)
However all my indicators will be FREE until May 1, 2018 . So please try them out!
To take advantage of this free trial:
Just leave a comment!
IF you are viewing this after May 1st. Please feel free to send me a PM or visit my website.

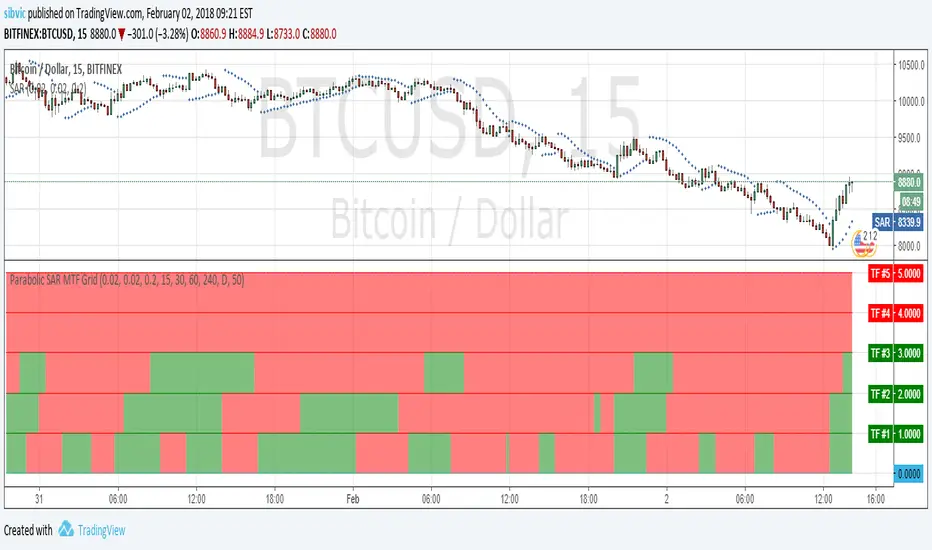
Parabolic SAR MTF GridShow a grid with Parabolic SAR in 5 timeframes. Shows an alert when the Parabolic SAR show the same direction for all 5 timeframes.
MTF Polarity Grid [DW]This is an experimental study designed to track directional polarities across multiple timeframes and express them as a simple two color grid.
The polarity in this calculation is determined by divergence between a fast and slow McGinley Dynamic.
Your current resolution's polarity is the top row, the rows below are are for higher timeframes of your choice.

