Volume Threshold Levels - Crypto LidyaVolume Threshold Levels – Crypto Lidya
Understanding volume behavior is one of the most effective ways to detect trend changes, manipulation candles, aggressive entries, and institutional activity.
Volume Threshold Levels (VTL) not only displays raw volume but also calculates dynamic volume thresholds (2x – 3x – 4x) based on the moving average, allowing you to identify statistically meaningful volume anomalies with precision.
📌 1. Volume Columns
The indicator plots each bar’s volume using traditional column-style visualization.
Green: Bullish candle
Red: Bearish candle
Gray: Neutral candle
This helps traders clearly understand the relationship between price and volume.
📌 2. Average Volume Area
VTL offers two types of moving averages for volume:
SMA (Simple Moving Average)
EMA (Exponential Moving Average)
The average volume is drawn as a soft yellow area across the chart.
This area acts as the baseline for normal volume levels.
📌 3. Dynamic Threshold Lines (2x / 3x / 4x)
The script calculates and displays multipliers of the average volume:
2x Average
3x Average
4x Average
These levels appear as bright yellow lines.
They are extremely useful for identifying breakouts, traps, and aggressive institutional entries.
📌 4. Volume Spike Detection (Alerts)
VTL identifies upward crossovers where volume breaks above key levels:
1x Volume Signal
2x Volume Signal
3x Volume Signal
4x Volume Signal
These can be used directly as TradingView alerts.
This allows you to automate detection of high-impact volume spikes.
📌 5. Use Cases
The indicator performs exceptionally well in:
Breakout confirmation
Liquidity sweep analysis
Detecting manipulation candles
Combining with OB, FVG, or other SMC structures
Scalping and low-timeframe aggressive volume interpretation
Algorithmic filters for volume-based strategies
📌 6. Summary
VTL delivers:
✔ Dynamic average volume baseline
✔ Clear 2x–3x–4x volume thresholds
✔ Accurate detection of upside volume explosions
✔ A strong tool for traders who rely on volume confirmation
Completely open-source and ready to be extended.
Hacim

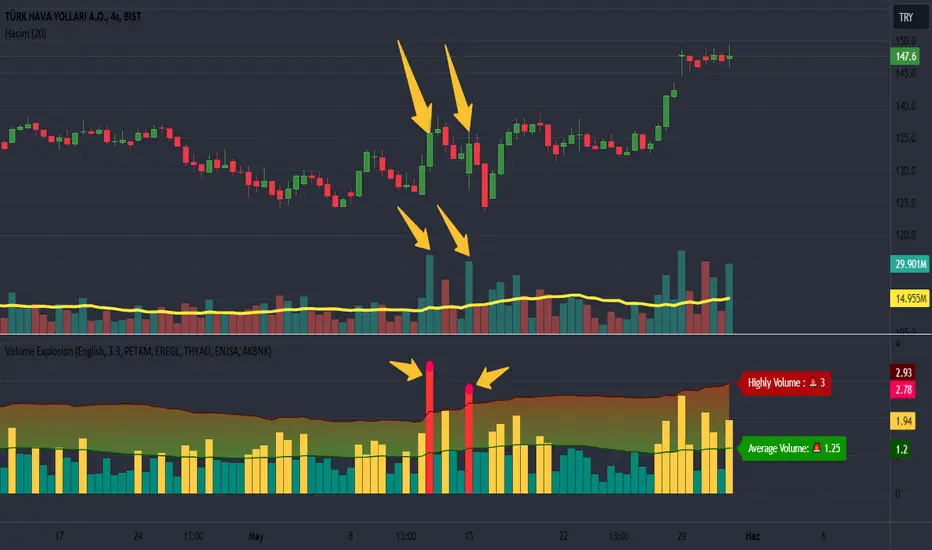
Volume Explosion [ProjeAdam]OVERVIEW
The purpose of the indicator is to detect significant changes in trading volume in financial markets.
USER GUIDE:
The user can change the sensitivity of the indicator by adjusting the multiplier value. The higher the multiplier, the harder it is to detect high volume bars.
The multiplier set by the user determines how much a move above the volume values is considered an "explosion". A higher multiplier results in fewer volume bursts being detected.
ALGORITHM
LANGUAGE
We have two different language options in our indicator. Users can use it in Turkish or English.
If we change the language option on our indicator, the language on our indicator that shows the upper and average level of our Band changes.
CALCULATING EXPLOSIONS
The indicator calculates the simple moving average of volume over a certain period of time. This average is used to identify abnormal movements by comparing it with the current volume.
If the current volume is higher than a certain multiple of the moving average, this is considered a volume burst. This indicates significant activity in the market.
ALARMS
We can change the parity for which we want to receive an alarm from the settings panel and ensure that we receive an alarm at the parity we want.
VİSUALİZATİON
When an alarm occurs in our parities, a separate indicator appears at the bottom right of the chart showing which parities the alarm is triggered in.
If there is no signal in the next bar, this table is automatically deleted.
Example
We understand that we have excessive volume in the two bars in our example and that interest in this financial product has increased in this region.
Benefits
This indicator is especially useful for traders who care about volume changes.
This indicator can be used as a helpful tool in trading decisions, as sudden increases in volume can be the beginning of a significant move in the market.
If you have any ideas what to add to my work to add more sources or make calculations cooler, suggest in DM .
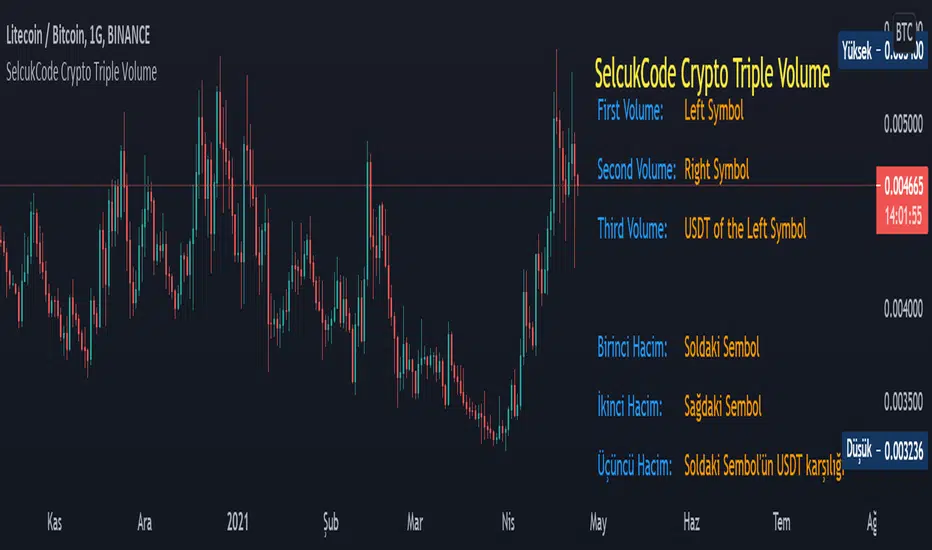
SelcukCode Crypto Triple VolumeThis is a volume indicator written for cryptocurrencies. The difference from the integrated indicator is that the left symbol of the cryptocurrency shows the volume as well as the right symbol. It also shows the volume of the pair in USDT. Thus, we see the USDT volume of each cryptocurrency pair. This standardizes our view of volume.
Bu, kripto paralar için yazılmış bir hacim indikatörüdür. Entegre indikatörden farkı, kripto paranın sol sembolünün hacmini göstermesinin yanı sıra sağ sembolün hacmini de gösterir. Ayrıca paritenin USDT olarak da hacmini gösterir. Böylelikle her kripto para çiftinin USDT hacmini görmüş oluruz. Bu bizim hacime bakış açımızı standartlaştırır.
CryptogramTR with OPEN CODEIndicator is obtained by importing RSI(14) into HULL moving average source with 2 different periods, as one is long period and the other is short.
When green line (short period) cross upward the red line (long period) , this is a BUY; vice versa it is a SELL.
When HMA Short Period is set to 1 (one), yielding line is absolutely the same line of RSI (14). You can change it into 8(eight) preferably.
İndikatör, RSI(14) indikatörünün, hull hareketli ortalamasının kod kaynağı olarak atanması ile elde edilmiştir. Uzun ve kısa olmak üzere 2 ayrı periyot kullanılmıştır.
Yeşil çizgi yani kısa periyotlu çizgi, kırmızı yani uzun periyotlu olanı yukarı keserse AL, tersi durum SAT olarak düşünülmelidir.
Hull Kısa Periyodu 1 iken oluşan yeşil çizgi, RSI(14) indikatörünü vermektedir. Kısa periyot olarak tercihinize göre bu değeri 8 olarak da kullanabilirsiniz.
