Previous Day Week Month Highs & Lows [MHA Finverse]Previous Day Week Month Highs & Lows is a comprehensive multi-timeframe indicator that automatically plots previous period highs and lows across Daily, Weekly, Monthly, 4-Hour, and 8-Hour timeframes. Perfect for identifying key support and resistance levels that often act as magnets for price action.
How It Works
The indicator retrieves the highest high and lowest low from the previous completed period for each selected timeframe. Lines extend forward into current price action, allowing you to see when price approaches or breaks these critical levels in real-time. The indicator tracks the exact bar where each high and low occurred, ensuring accurate historical placement.
---
Key Features
Multi-Timeframe Levels:
• Current Daily, Previous Daily, 4H, 8H, Weekly, and Monthly highs/lows
• Fully customizable colors and line styles (Solid, Dashed, Dotted)
• Adjustable line width and extension length
Visual Enhancements:
• Price labels showing exact level values
• Range position percentage (distance from high/low)
• Optional period boxes highlighting timeframe ranges
• Day and date labels for reference
Trading Tools:
• Breakout markers when price crosses key levels
• Touch count tracking (how many times price tested each level)
• Time at level display (consolidation detection)
• Customizable thresholds for touch and time analysis
Alert System:
• Individual alerts for each timeframe: Daily High/Low Break, 4H High/Low Break, 8H High/Low Break, Weekly High/Low Break, Monthly High/Low Break
• Toggle switches to enable/disable alerts per timeframe
• Clear messages showing which level was broken and at what price
---
How to Use
Setup:
1. Enable your preferred timeframes in "Highs & Lows MTF" settings
2. Customize colors and styles to match your chart
3. Turn on visual features like price labels and range percentages
4. Set up alerts by creating specific alert conditions or using toggle switches
Trading Applications:
Breakout Trading: Watch for strong momentum when price breaks above previous highs or below previous lows
Support/Resistance: Use these levels as potential reversal points for entry/exit signals
Range Trading: Trade between previous highs and lows using the range position indicator
Stop Loss Placement: Place stops just beyond previous highs (shorts) or lows (longs)
Multiple Timeframe Confirmation: Combine timeframes for stronger signals (e.g., Daily near Weekly support)
---
Best Practices
• Use Weekly/Monthly for swing trading, Daily/4H/8H for day trading
• Combine with volume or momentum indicators for confirmation
• Multiple timeframe levels clustering together create high-probability zones
• The more touches a level has, the more significant it becomes
---
Disclaimer
This indicator is a technical analysis tool for identifying price levels based on historical data. It does not guarantee profits or predict future movements. Trading involves substantial risk. Always use proper risk management and never risk more than you can afford to lose.
Highlow

Moving Average Channel Breakout (No Repaint) This indicator creates a channel using two simple moving averages: SMA of highs (upper line) and SMA of lows (lower line).
How it works:
- When a candle closes above the upper channel line, the following candles turn green (bullish trend)
- When a candle closes below the lower channel line, the following candles turn red (bearish trend)
- The trend color remains until a breakout in the opposite direction occurs
Anti-repaint:
This indicator does NOT repaint. The candle color is determined at the open, based on the previous candle's close. Once a candle opens with a color, that color never changes.
Breakout strategy:
- Candle opens green → Long entry signal
- Candle opens red → Short entry signal
The signal and entry moment are perfectly synchronized at the candle open, making it ideal for systematic breakout strategies.

Previous Day Candle [ApexFX]Previous Day Candle is a precision tool designed for intraday traders who rely on previous daily structures to find support and resistance.
While most indicators simply mark the previous high and low, this tool focuses on Session Continuity. It highlights the full 24-hour range of the previous day and extends those levels into the "Killzone" of the current trading day (up to 2:00 PM EST / 12:00 PM MST).
Why use this? Market reaction often occurs at the previous day's extremes. By extending these lines into the current session, you can easily spot:
Breakouts: Price pushing through yesterday's high.
Failed Auctions: Price sweeping yesterday's low and reversing.
Support/Resistance Flips: Old highs becoming new support.
Main Features:
Asset Class Presets: Don't worry about timezones. Simply select your market:
Forex: Aligns to the standard 5:00 PM EST New York Open.
Indices: Aligns to the 6:00 PM EST Globex Open.
Crypto: Aligns to UTC Midnight.
Custom: Full manual control for specific needs.
Visual "Boxing": Vertical dotted lines clearly demarcate the start and end of the previous trading day.
Dynamic History: Choose to show just yesterday's levels or look back at the last 5+ days.
Smart Color Coding: The indicator automatically cycles colors for each day (Blue = Yesterday, Green = 2 Days Ago, etc.), making it instant to read historical price action.
Best Used On: Intraday timeframes (5m, 15m, 1h).

1st 4H Candle [ApexFX]Overview
This indicator identifies the very first 4-hour candle of the trading day and plots its high and low as horizontal lines. These levels are designed to act as key support and resistance for the rest of the 24-hour session.
The lines are calculated using 4-hour data but display on any timeframe, allowing you to see these key daily levels while trading on lower timeframes like the 15-minute or 5-minute chart. The lines extend for the first six 4-hour candles (24 hours) before stopping.
Features
Flexible Timezone: A simple dropdown menu to select your local timezone (e.g., "America/New_York", "Europe/London", "UTC") to ensure the candle is always correctly identified.
Asset Presets: Instantly set the correct start time for major asset classes:
Forex (23:00)
Indices (00:00)
Crypto (21:00)
Fully Custom: A "Custom" option lets you define any hour and minute for the start of your session, giving you full control for other assets like Gold or Oil.
Custom Colors: Change the color of the high and low lines from the settings menu.
How to Use
Add the indicator to your chart.
Open the indicator's "Settings".
In the "Your Timezone" dropdown, select the same timezone you use for your chart (e.g., "America/New_York").
In the "Asset Type Preset" dropdown, choose the asset you are trading (e.g., "Indices").
The indicator will wait for the first 4-hour candle (e.g., the 00:00 candle for Indices) to close, and then it will automatically draw the high and low lines.

Apex FX - 1st 4H CandleApex FX - 1st 4H Candle
Overview
This indicator identifies the very first 4-hour candle of the trading day and plots its high and low as horizontal lines. These levels are designed to act as key support and resistance for the rest of the 24-hour session.
The lines are calculated using 4-hour data but display on any timeframe, allowing you to see these key daily levels while trading on lower timeframes like the 15-minute or 5-minute chart. The lines extend for the first six 4-hour candles (24 hours) before stopping.
Features
Flexible Timezone: A simple dropdown menu to select your local timezone (e.g., "America/New_York", "Europe/London", "UTC") to ensure the candle is always correctly identified.
Asset Presets: Instantly set the correct start time for major asset classes:
Forex (23:00)
Indices (00:00)
Crypto (21:00)
Fully Custom: A "Custom" option lets you define any hour and minute for the start of your session, giving you full control for other assets like Gold or Oil.
Custom Colors: Change the color of the high and low lines from the settings menu.
How to Use
Add the indicator to your chart.
Open the indicator's "Settings".
In the "Your Timezone" dropdown, select the same timezone you use for your chart (e.g., "America/New_York").
In the "Asset Type Preset" dropdown, choose the asset you are trading (e.g., "Indices").
The indicator will wait for the first 4-hour candle (e.g., the 00:00 candle for Indices) to close, and then it will automatically draw the high and low lines.

Quantura - Session High/LowIntroduction
“Quantura – Session High/Low” is a professional-grade session mapping indicator that automatically identifies and visualizes the highs, lows, and ranges of key global trading sessions — London, New York, and Asia. It helps traders understand when and where liquidity tends to accumulate, allowing for better market structure analysis and session-based strategy alignment.
Originality & Value
This indicator unifies the three most influential global sessions into a single, adaptive visualization tool. Unlike typical session indicators, it dynamically updates live session highs and lows in real time while marking session boundaries and transitions. Its multi-session management system allows for immediate recognition of overlapping liquidity zones — a crucial feature for institutional and intraday traders.
The value and originality come from:
Real-time tracking of session highs, lows, and developing ranges.
Simultaneous visualization of multiple global sessions.
Optional vertical range lines for clearer visual segmentation.
Customizable session times, colors, and time zone offset for global accuracy.
Automatically extending and updating lines as each session progresses.
Functionality & Core Logic
Detects the start and end of each trading session (London, New York, Asia) using built-in time logic and user-defined UTC offsets.
Initializes session-specific high and low variables at the start of each new session.
Continuously updates session high/low levels as new candles form.
Draws color-coded horizontal lines for each session’s high and low.
Optionally adds vertical dotted lines to visually connect session range extremes.
Locks each session’s range once it ends, preserving historical structure for review.
Parameters & Customization
New York Session: Enable/disable, customize time (default 15:30–21:30), and set color.
London Session: Enable/disable, customize time (default 09:00–16:30), and set color.
Asia Session: Enable/disable, customize time (default 02:30–08:00), and set color.
Vertical Line: Toggle dotted vertical lines connecting session high and low levels.
UTC Offset: Adjust session timing to align with your chart’s local time zone.
Visualization & Display
Each session is color-coded for quick identification (default: blue for London, red for New York, green for Asia).
Horizontal lines track evolving session highs and lows in real time.
Once a session closes, the lines remain fixed to mark historical range boundaries.
Vertical dotted lines (optional) visually connect the session’s high and low for clarity.
Supports full overlay display without interfering with other technical indicators.
Use Cases
Identify liquidity zones and range extremes formed during active trading sessions.
Observe session overlaps (London–New York) to anticipate volatility spikes.
Combine with volume or market structure tools for session-based confluence.
Track how price interacts with prior session highs/lows to detect potential reversals.
Analyze session-specific performance patterns for algorithmic or discretionary systems.
Limitations & Recommendations
The indicator is designed for intraday analysis and may not provide meaningful output on daily or higher timeframes.
Adjust session times and UTC offset based on your broker’s or exchange’s timezone.
Does not provide trading signals — it visualizes session structure only.
Combine with liquidity and volatility indicators for full contextual understanding.
Markets & Timeframes
Compatible with all asset classes — including crypto, forex, indices, and commodities — and optimized for intraday timeframes (1m–4h). Particularly useful for traders analyzing session overlaps and volatility transitions.
Author & Access
Developed 100% by Quantura. Published as a Open-source script indicator. Access is free.
Compliance Note
This description fully complies with TradingView’s Script Publishing Rules and House Rules . It provides a detailed explanation of functionality, parameters, and realistic use cases without making any performance or predictive claims.

Sessions Highs/LowsThis indicator plots the High and Low of the three main trading sessions:
Asia (20:00–03:00) – green lines
London (03:00–08:00) – blue lines
New York (08:00–13:00) – red lines
Features:
Levels update in real time during each session.
When a new session starts, the previous lines are deleted – only the latest active sessions remain visible.
Default session times are set to Asia (20:00–03:00), London (03:00–08:00), and New York (08:00–13:00), but you can adjust them to your own custom hours in the settings.
Colors can also be customized.
Use cases:
Quickly visualize session ranges.
Track session highs/lows for breakouts, fakeouts, and reactions around liquidity zones.

ICT Session High/Low LevelsThis indicator automatically plots the Highs and Lows of completed sessions and draws lines for the Asian session and London session. Levels are displayed only after each session has closed. A simple tool for liquidity work and intraday context (SMC/ICT).

Multi Ranges Volume Distribution [LuxAlgo]The Multi Ranges Volume Distribution tool allows traders to see the volume distribution by price for three different timeframes simultaneously. Each distribution can report the total amount of accumulated volume or the accumulated buy/sell volume separately.
Levels are displayed at the top and bottom of each timeframe's range, as well as the POC or level with the most volume.
🔶 USAGE
By default, the tool displays daily, weekly, and monthly volume distributions, highlighting the accumulated volume within each row.
Each distribution shows the volume at each price, as well as three lines: the top and bottom prices, and the price at which the most volume was traded.
The reported accumulated volume can be useful for highlighting which price areas are of the most interest to traders, with the specific timeframe specifying whether this interest is long-term or short-term.
🔹 Timeframes & Rows
Traders can adjust the timeframe and the number of rows for each volume distribution.
This is useful for multi-timeframe analysis of volume at the same price levels, or for obtaining detailed data within the same timeframe.
The chart above shows three volume distributions with the same monthly timeframe but a different number of rows; each is more detailed than the previous one.
🔹 Total vs Buy & Sell Volume
Traders can choose to display either the total volume or the buy and sell volumes.
As we can see on the above chart, the background of each row uses a gradient that is a function of the delta between the buy and sell volumes.
This is useful to determine which areas attract buyers and sellers.
🔶 SETTINGS
Volume Display: Select between total volume and buy and sell volume.
Distance between each box: Adjust the spacing of the volume distributions.
Period A: Select a timeframe and the number of rows.
Period B: Select a timeframe and the number of rows.
Period C: Select a timeframe and the number of rows.

Absolute High and Low {Darkoexe}This indicator identifies and visually highlights the absolute highest and lowest closing prices on a chart. It is designed to help traders quickly recognize major price extremes that can serve as significant support/resistance levels or turning points in historical price action.
🔧 What It Does
The script plots persistent horizontal lines on your chart to mark either:
The absolute highest and lowest closing prices of the entire visible chart, or
The highest and lowest closing prices within a custom range of candles, defined by the user.
These price levels are plotted using thick green and red lines, respectively, and are updated dynamically as new highs or lows are set.
⚙️ How It Works
When “Use all candles” is enabled, the script continuously updates the high and low lines based on the full price history of the chart. These lines remain until a new extreme is made.
When disabled, the script checks only the most recent N candles (max bars back input). It scans this window to find and plot the highest and lowest closes.
The lines extend to the right to help users visually anchor these key levels in future price action.
🎯 Use Cases
Spotting extreme price levels for potential mean-reversion strategies.
Confirming breakout or breakdown conditions.
Defining long-term support and resistance zones.
This tool is especially useful for discretionary traders who value historical context and want clear visual markers for past price extremes.
⚠️ Notes and Limitations
This script is not predictive. It simply marks historical price extremes based on closing values.
When using the fixed range mode (max bars back), be aware that values outside this range will not be considered.
The indicator does not repaint, but in full chart mode, it updates only when a new extreme is formed.

Swing-Based Volatility IndexSwing-Based Volatility Index
This indicator helps traders quickly determine whether the market has moved enough over the past few hours to justify scalping.
It measures the percentage price swing (high to low) over a configurable time window (e.g., last 4–8 hours) and compares it to a minimum threshold (e.g., 1%).
✅ If the percent move exceeds the threshold → Market is volatile enough to scalp (green background).
🚫 If it's below the threshold → Market is too quiet (red background).
Features:
Adjustable lookback period in hours
Custom threshold for volatility sensitivity
Automatically adapts to the current chart timeframe
This tool is ideal for scalpers and short-term traders who want to avoid entering trades in low-volatility environments.

Intraday Pivot Highs & Lows (Asia London NY)Intraday Pivot Highs & Lows (Asia London NY)
Script Description
This TradingView indicator is optimized for Forex, scalping, intraday, and day trading strategies. It accurately plots Pivot Points and levels, high/low, support and resistance levels. These are clearly identified to aid the trader during killzone sessions and session opens. Ideal for scalp trading, intraday sessions, and leveraging SMT (Smart Money Techniques). Utilize these Price Levels effectively during London Open, NY Open, and the Asia Session, utilizing Market Structure to pinpoint key levels and reversal zones for successful trading. Improve your Trade Setups, recognize reliable Chart Patterns, identify critical Price Pivots, and trade confidently off Institutional Levels.
This script marks the intraday pivot highs, lows and midpoints retracement levels for
Asia
London
New York
It also plots the previous day's high, low, midpoint, and 0.618 Fibonacci retracement levels, providing traders with critical price reference points for making intraday trading decisions.
Originality & Usefulness
This indicator uniquely integrates pivot calculations across three major Forex sessions (Asia, London, NY), clearly delineating session boundaries.
It enhances visibility by using distinct styling
solid for New York
dashed for London
dotted lines for Asia
And colour co-ordinated labeling, improving traders' ability to identify important intraday price action zones efficiently. Unlike standard pivot indicators, this script emphasizes session-specific trading dynamics.
### Key Features ###
Session-Based Levels: Automatically plots high, low, midpoint, and Fibonacci (.618) levels for each major session (Asia, London, NY).
Distinct Visual Cues: Lines and labels use session-specific styles and colors to easily differentiate between sessions.
Previous Day Reference: Clearly plots and labels yesterday's high, low, midpoint, and Fibonacci levels.
Flexible Visibility: Traders can set timeframe visibility to maintain clean charts on higher timeframes.
### How It Works
At the start of next day's session, previous session lines are cleared, ensuring the chart remains uncluttered.
High, low, midpoint, and Fibonacci retracement levels (.618) are dynamically calculated and displayed at the close of each session.
All session levels remain visible until the start of the next respective session, providing continuous actionable insights.
Trading Application:
Session highs and lows act as strong intraday support and resistance zones.
Midpoints and Fibonacci levels are effective for identifying potential reversal zones and retracements.
Daily levels provide a broader context, useful for gauging intraday volatility and range.
### Limitations and Considerations ##
Best used on liquid assets with clear session-based price action, such as Forex major pairs, if used on indexes make sure they contain 24 hour price action not just New York session.
This indicator is designed to streamline intraday trading by clearly marking essential pivot points and session-based levels, significantly improving traders' market context and decision-making accuracy. Can be used to enhance SMT decision making when scalping killzones.

Enhanced HHLL Time Confirmation with EMAStrong recommendation , remove the green and red circle , or leave it how it is ;)
To be used on 1 minute chart MSTR , Stock
other time frames are good , ;)
How to Use
HHLL Signals: Look for green triangles (buy) below bars or red triangles (sell) above bars to identify confirmed HH/LL setups with trend alignment.
EMA Signals: Watch for lime circles (buy) below bars or maroon circles (sell) above bars when price crosses the EMA 400 in a trending market.
Trend Context: Use the EMA 400 as a dynamic support/resistance level and the SMA trend filter to gauge market direction.
Enable alerts to get notified of signals in real-time.
Best Practices
Adjust the Lookback Period and Confirmation Minutes to suit your timeframe (e.g., shorter for scalping, longer for swing trading).
Combine with other indicators (e.g., volume, RSI) for additional confirmation.
Test on your preferred market and timeframe to optimize settings.
Indicator Description: Enhanced HHLL Time Confirmation with EMA
Overview
The "Enhanced HHLL Time Confirmation with EMA" is a versatile trading indicator designed to identify key reversal and continuation signals based on Higher Highs (HH), Lower Lows (LL), and a 400-period Exponential Moving Average (EMA). It incorporates time-based confirmation and trend filters to reduce noise and improve signal reliability. This indicator is ideal for traders looking to spot trend shifts or confirm momentum with a combination of price structure and moving average crossovers.
Key Features
Higher High / Lower Low Detection:
Identifies HH and LL based on a customizable lookback period (default: 30 bars).
Signals are confirmed only after a user-defined time period (in minutes, default: 60) has passed since the last HH or LL, ensuring stability.
Trend Filter:
Uses a fast (10-period) and slow (30-period) Simple Moving Average (SMA) crossover to confirm bullish or bearish trends.
Buy signals require a bullish trend (Fast SMA > Slow SMA), and sell signals require a bearish trend (Fast SMA < Slow SMA).
EMA 400 Integration:
Plots a 400-period EMA (customizable) as a long-term trend reference.
Generates additional buy/sell signals when price crosses above (buy) or below (sell) the EMA 400, filtered by trend direction.
Visualizations:
Optional dashed lines for HH and LL levels (toggleable).
Debug markers (diamonds) to visualize HH/LL detection points.
Distinct signal shapes: triangles for HHLL signals (green/red) and circles for EMA signals (lime/maroon).
Alerts:
Built-in alert conditions for HHLL Buy/Sell and EMA Buy/Sell signals, making it easy to stay informed of key events.
Input Parameters
Lookback Period (default: 30): Number of bars to look back for HH/LL detection.
Confirmation Minutes (default: 60): Time (in minutes) required to confirm HH/LL signals.
High/Low Source: Select the price source for HH (default: high) and LL (default: low).
Show HH/LL Lines (default: true): Toggle visibility of HH/LL dashed lines.
Show Debug Markers (default: true): Toggle HH/LL detection markers.
EMA Period (default: 400): Adjust the EMA length.

Fibonacci Pivot Points & Previous D,W&M Highs/LowsIndicator Overview
This indicator combines Fibonacci Pivot Points with previous high and low levels for different timeframes (day, week, month). It plots these levels on the chart to provide traders with key support and resistance areas, making it easier to identify potential trading opportunities.
Features
Fibonacci Pivot Points:
The indicator calculates pivot points based on the high, low, and close prices.
Fibonacci levels are used to determine support (S1, S2, S3, S4, S5) and resistance (R1, R2, R3, R4, R5) levels.
Users can customize the Fibonacci levels for both support and resistance.
Previous Highs and Lows:
The indicator plots previous day, week, and month high and low levels.
Each of these lines can be customized in terms of visibility, color, and width.
This helps traders to see key historical levels that might act as support or resistance in the future.
Inputs and Customization:
Fibonacci Time Frame:
Users can select the timeframe for calculating the pivot points (Daily, Weekly, Monthly).
Fibonacci Levels:
Customizable input fields for each Fibonacci level (R1, R2, R3, R4, R5, S1, S2, S3, S4, S5).
Previous High/Low Lines:
Day Lines:
Options to show or hide previous day's high/low lines.
Customizable color and width for these lines.
Week Lines:
Options to show or hide previous week's high/low lines.
Customizable color and width for these lines.
Month Lines:
Options to show or hide previous month's high/low lines.
Customizable color and width for these lines.
Technical Calculations:
Fibonacci Pivot Points:
Calculated as:
pp = (High + Low + Close) / 3
S1 = pp - ((High - Low) * Fibonacci Level)
R1 = pp + ((High - Low) * Fibonacci Level)
Previous High/Low Levels:
Uses request.security to fetch previous high and low values for the selected timeframe.
Plotted using line.new to draw lines across the chart.
Plotting:
The indicator plots Fibonacci Pivot Points and previous high/low lines on the chart, using distinct colors for each level.
Customizable transparency and linewidths make it easier to visually interpret the levels.
This indicator is particularly useful for traders who rely on technical analysis to identify key support and resistance levels, offering a blend of historical data and Fibonacci-based predictions.
Feel free to ask if you have any specific questions or need further adjustments!

Swing Structure Scanner [LuxAlgo]The Swing Structure Scanner Indicator is a dashboard type indicator which displays a Consolidated "High/Low-Only" view of swing structure, with the capability to retrieve and display swing points from up to 6 different tickers and timeframes at once.
🔶 USAGE
This indicator displays swing structure data from up to 6 unique tickers or timeframes; Each graph represents the current swing structure retrieved from the requested chart/s.
Each swing graph displays the current live swing point positioning relative to the previous swing points. By analyzing the different formations, patterns can more easily be recognized and found across multiple tickers or timeframes at once.
This indicator serves as a nifty tool for confluence recognition, whether that's confluence throughout market tickers, or confluence through higher timeframes on the same ticker.
Alternatively, viewing the relative positioning of each swing point to each other, should give a clearer idea when higher lows or lower highs are formed. This can potentially indicate a newly forming trend, as well as serving as a warning to watch for breakouts.
The swing length can be changed to align with each individual's strategy, as well as a display look back can be adjusted to show more or less swing points at one time.
The display is fairly customizable, it is not fixed to 6 symbols at all times and can be minimized to only display the number of symbols needed; Additionally, the display can be set to vertical mode or horizontal(default) to utilize as needed.
Note: Hover over the swing point in the dashboard to get a readout of the exact price level of the swing point.
🔶 SETTINGS
Swing Length: Set the swing length for the structure calculations.
Swing Display Lookback: Sets the number of swing points (Pairs) to display in each Swing Graph display.
Symbols: Sets the Timeframe and Symbol for each Swing Graph.
Vertical Display: Display the Swing Graphs up and down, rather than side to side.
Scaling Factor: Scales the entire indicator up or down, to fit your needs.

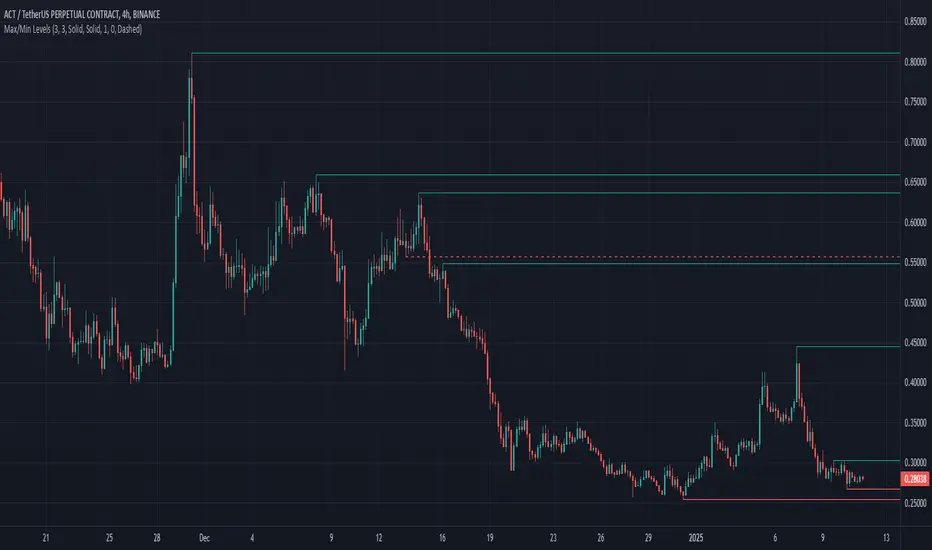
Max/Min LevelsHighlights highs and lows that match the search criteria. A high is considered to be broken if the candlestick breaks through its shadow
A three-candlestick pattern will match the parameters:
Candle before - 1
Candle after - 1
A five-candlestick pattern will match the parameters:
Candle before - 2
Candle after - 2
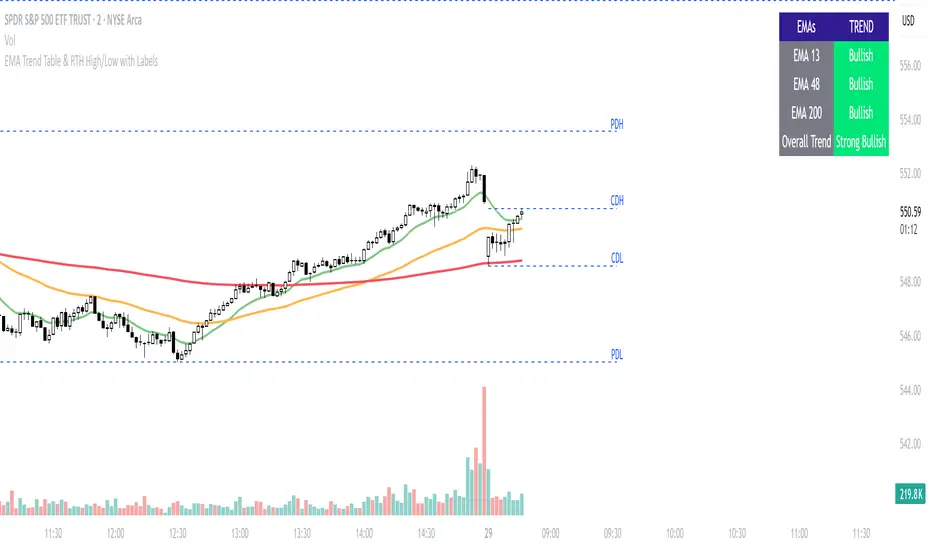
Previous Day and Current Day High/LowKey Features:
Previous Day High and Low Lines:
Displays the high (PDH) and low (PDL) levels of the previous trading day.
Allows customization of line colors, styles (solid, dashed, or dotted), and widths.
Extends these lines by a specified number of candles into the current day for better visualization.
Current Day High and Low Lines:
Displays the high (CDH) and low (CDL) levels during the current day's regular trading hours.
Customizable line attributes, including color, style, width, and extension length.
Customizable Input Options:
User-configurable settings for both the previous and current day high/low lines, grouped under respective sections for clarity.
Regular trading hours can be defined manually (default is 9:30 AM to 4:00 PM).
Ability to toggle the visibility of the lines for both the previous and current days.
Automatic Reset at the Start of a New Day:
Captures the high and low values of the completed day and resets for the new day.
Deletes old lines and labels to ensure clarity and avoid overlap.
Dynamic Updates:
Updates the current day's high and low lines and labels as new data comes in.
Adjusts previous day lines dynamically based on the user-defined number of candles to extend.
Session-Based Filtering:
Ensures the calculations and updates are restricted to the defined regular trading hours.
Code Logic:
Input Groups: The script uses grouped inputs to allow users to configure settings for previous and current day levels separately.
Line and Label Management: It creates and deletes lines and labels dynamically to prevent clutter and keep the chart organized.
Session Check: Uses the session input to determine if a bar falls within regular trading hours.
High/Low Calculation: Tracks the high and low for both the previous and current days during regular trading hours.
New Day Detection: Identifies the start of a new trading day to update previous day values and reset current day variables.
Applications:
Intraday Trading: Helps traders identify critical support and resistance levels from the previous and current days.
Trend Analysis: Provides visual cues for price movement trends across consecutive days.
Custom Visualization: With extensive customization options, traders can adapt the indicator to suit their trading style and chart aesthetics.
This script is highly configurable, making it versatile for a wide range of trading strategies and styles.
Last Candle OHLC (Ticks or Points)What the Code Does
1. **Draws Lines and Labels**:
- It draws lines on your chart to show the high, low, open, and close prices from the previous period (like the previous day or week).
- It also labels these lines with numbers that tell you how far the current price is from these levels.
2. **Shows Price Movement**:
- You can see how far the price has moved from these levels in terms of small price changes (ticks) or larger units (points).
- This helps you understand price movements and potential levels of support or resistance.
3. **Customizable**:
- You can choose whether to show these lines and labels, and you can select if you want to see the movement in ticks or points.
- The lines can extend into the future on your chart to help you anticipate where prices might be in the coming days.
### How It’s Useful:
1. **Identify Key Levels**:
- It helps you spot important price levels from past periods, which can act as support or resistance.
2. **Understand Price Movement**:
- You get a visual sense of how much the price has moved from key levels, which can help you gauge market volatility.
3. **Plan Trades**:
- By seeing where the price has been and how it has moved, you can better plan your trades, like deciding where to enter or exit based on these levels.
4. **Flexible for Different Markets**:
- It works across various markets, like stocks, futures, and forex, adjusting to the specific characteristics of each instrument.
In short, this tool helps you visualize and understand past price movements and levels on your chart, aiding in your trading decisions.

HT: Intraday LevelsIndicator draws several most important intraday levels: last day RTH high/low, ETH high/low, Half Back, Day Close and current day RTH Day Open. These levels often act as support/resistance for intraday price movements. Also, they can help to assess day character and control of power.
Indicator can be used for ETH + RTH sessions.
Important notes:
• User must specify RTH session time, appropriate for his time zone and exchange
• Half-back is calculated as a middle line between RTH High and Low.
• Day Close is always equal to close of the last bar of the previous day
• RTH Day Open will be redrawn for the current day as soon as it is known (after RTH session opens and at least one bar gets confirmed).
Known issues:
• Day open will not be shown if there is no bar, clearly corresponding to RTH open time (e.g. if 4h timeframe is selected)
• For some ETH sessions it is not possible to determine session’s last bar (this is pine script limitation) until next day trading starts. This means that daily levels will be also update with only then.
Parameters:
Date – user can select date, for which levels will be plotted. Works only if “Use” check box is on. Otherwise, levels will be plotted for the last day. (“time” value doesn’t matter; unfortunately, there is no way to hide the input box)
RTH Open/Close time – it is important to specify time, appropriate for your time zone.
Time zone – your chart time zone (as UTC offset)
Visuals – controls visibility and colors
Script is published as an open source. It uses two libraries: Levels Lib and Functions Lib. First one demonstrates how to work with pine-script object model and arrays. You can also reuse it in your custom scripts where there is need to construct any support/resistance levels. The second library contains some useful functions for working with time and dates.
Disclaimer
This indicator should not be used as a standalone tool to make trading decisions but only in conjunction with other technical analysis methods.

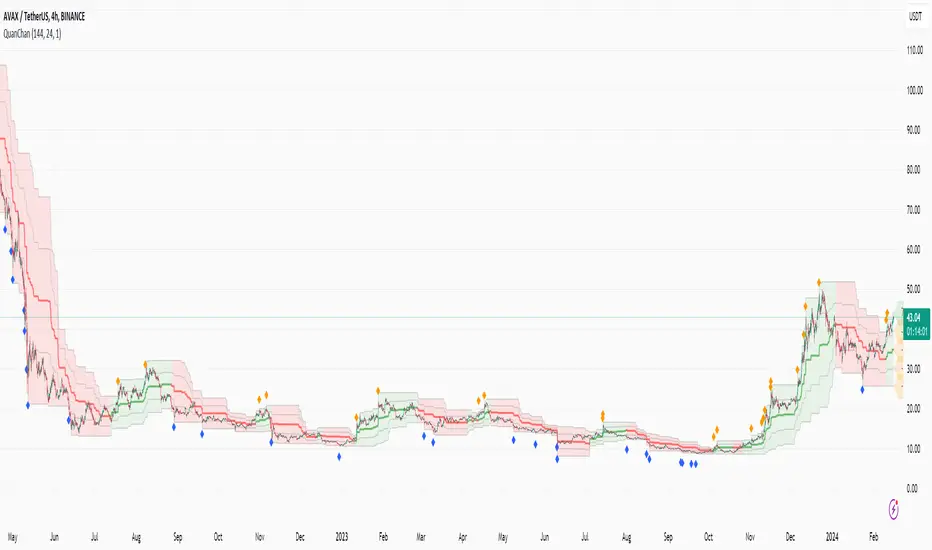
Quan Channel - Quan DaoI tried several channels, like the supertrend, ATR, Donchian or Bollingers, but they do not seem to fit my needs.
So I created a new channel to PREDICT the next impulse move of a price.
The current value of the top or bottom of the channel is based on 2 previous candles (not the candle itself), and it takes into account:
- The Direction of the previous candles (red or green) and
- The Width of their bodies
In my channel, the top or bottom lines will cover the price movement most of the time. But in some cases, when the price is on a big move, it will go out of the channel. And this is the time we need to consider a buy/sell (or take some profit) as well (not necessarily 100% of the time, though).
Personally, I like to use another oscillator in combination with this channel to predict whether it will reverse after the breakouts or continue to make another peak. If you are a DCA or long-term investor, I guess it would be safe to buy at the blue signals (out of bottom) and take some profits at the orange signals (out of top).
I also added an alert when the price breaks out of the channel for easier tracking.
Market Pivot Levels [Past & Live]Market Levels provide a robust view of daily pivot points of markets such as high/low/close with both past and live values shown at the same time using the recently updated system of polylines of pinescript.
The main need for this script arose from not being able to use plots for daily points because plots are inherently once drawn can't be erased and because we can't plot stuff for previous bars after values are determined we can't use them reliably. And while we can use traditional lines, because we would have extremely high amount of lines and we would have to keep removing the previous ones it wouldn't be that effective way for us. So we try to do it with the new method of polylines .
Features of this script:
- Daily High/Low Points
- Yesterday High/Low/Close Points
- Pre-Market High-Low points.
Now let's preview some of the important points of code and see how we achieve this:
With the code below we make sure no matter which chart we are using we are getting the extended hours version of sessions so our calculations are made safely for viewing pre-market conditions.
// Let's get ticker extended no matter what the current chart is
tc = ticker.new(syminfo.prefix, syminfo.ticker, session.extended)
Coding our own function to calculate high's and low's because inbuilt pinescript function cannot take series and we send this function to retrieve our high's and lows.
// On the fly function to calculate daily highlows instead of tv inbuilt because tv's length cannot take series
f_highlow(int last) =>
bardiff = last
float _low = low, float _high = high
for i = bardiff to 0 by 1
if high > _high
_high := high
if low < _low
_low := low
With doing calculations at the bars of day ending points we can retrieve the correct points and values and push them for our polylines array so it can be used in best way possible.
// Daily change points
changeD = timeframe.change("D")
// When new day starts fill polyline arrays with previous day values for polylines to draw on chart
// We also update prevtime values with current ones after we pushed to the arrays
if changeD
f_arrFill(cpArrHigh, cpArrLow, prevArrh, prevArrl, prevArrc, prevMarh, prevMarl)
valHolder.unshift(valueHold.new(_high, _low, _high, _close, _low, time, pr_h, pr_l))
The rest of the code is annotated and commented. You can let me know in comments if you have any questions. Happy trading.

HighLowBox+220MAs[libHTF]HighLowBox+220MAs
This is a sample script of libHTF to use HTF values without request.security().
import nazomobile/libHTFwoRS/1
HTF candles are calculated internally using 'GMT+3' from current TF candles by libHTF .
To calcurate Higher TF candles, please display many past bars at first.
The advantage and disadvantage is that the data can be generated at the current TF granularity.
Although the signal can be displayed more sensitively, plots such as MAs are not smooth.
In this script, assigned ➊,➋,➌,➍ for htf1,htf2,htf3,htf4.
HTF candles
Draw candles for HTF1-4 on the right edge of the chart. 2 candles for each HTF.
They are updated with every current TF bar update.
Left edge of HTF candles is located at the x-postion latest bar_index + offset.
DMI HTF
ADX/+DI/DI arrows(8lines) are shown each timeframes range.
Current TF's is located at left side of the HighLowBox.
HTF's are located at HighLowBox of HTF candles.
The top of HighLowBox is 100, The bottom of HighLowBox is 0.
HighLowBox HTF
Enclose in a square high and low range in each timeframe.
Shows price range and duration of each box.
In current timeframe, shows Fibonacci Scale inside(23.6%, 38.2%, 50.0%, 61.8%, 76.4%)/outside of each box.
Outside(161.8%,261.8,361.8%) would be shown as next target, if break top/bottom of each box.
In HTF, shows Fibonacci Level of the current price at latest box only.
Boxes:
1 for current timeframe.
4 for higher timeframes.(Steps of timeframe: 5, 15, 60, 240, D, W, M, 3M, 6M, Y)
HighLowBox TrendLine
Draw TrendLine for each HighLow Range. TrendLine is drawn between high and return high(or low and return low) of each HighLowBox.
Style of TrendLine is same as each HighLowBox.
HighLowBox RSI
RSI Signals are shown at the bottom(RSI<=30) or the top(RSI>=70) of HighLowBox in each timeframe.
RSI Signal is color coded by RSI9 and RSI14 in each timeframe.(current TF: ●, HTF1-4: ➊➋➌➍)
In case of RSI<=30, Location: bottom of the HighLowBox
white: only RSI9 is <=30
aqua: RSI9&RSI14; <=30 and RSI9RSI14
green: only RSI14 <=30
In case of RSI>=70, Location: top of the HighLowBox
white: only RSI9 is >=70
yellow: RSI9&RSI14; >=70 and RSI9>RSI14
orange: RSI9&RSI14; >=70 and RSI9=70
blue/green and orange/red could be a oversold/overbought sign.
20/200 MAs
Shows 20 and 200 MAs in each TFs(tfChart and 4 Higher).
TFs:
current TF
HTF1-4
MAs:
20SMA
20EMA
200SMA
200EMA

Range Based Signals and AlertsThis script produces a compiled version of rule based signals that is meant to be used mainly on 5 Min timeframe based on daily(as default) Highs and Lows on average and the main purpose is to give user settings to change and adapt based on their needs and make it as adjustable as possible. This entry strategy idea does not belong to me but for TV's in-house rule reasons i can't disclose whose idea it is but i think people that will use this indicator will know who the original idea belongs to.
Rules used for signal production:
- Daily(As default) High-Low points
- Moving Average for detecting reversing of price
- MTF MACD (Daily as default) for detecting overall trend
Signals produced based on extensions of price out of daily zones and when they drop or rise back into moving average. A conditional checker is used for reducing repeated unnecessary signals and alerts.
Happy trading.
