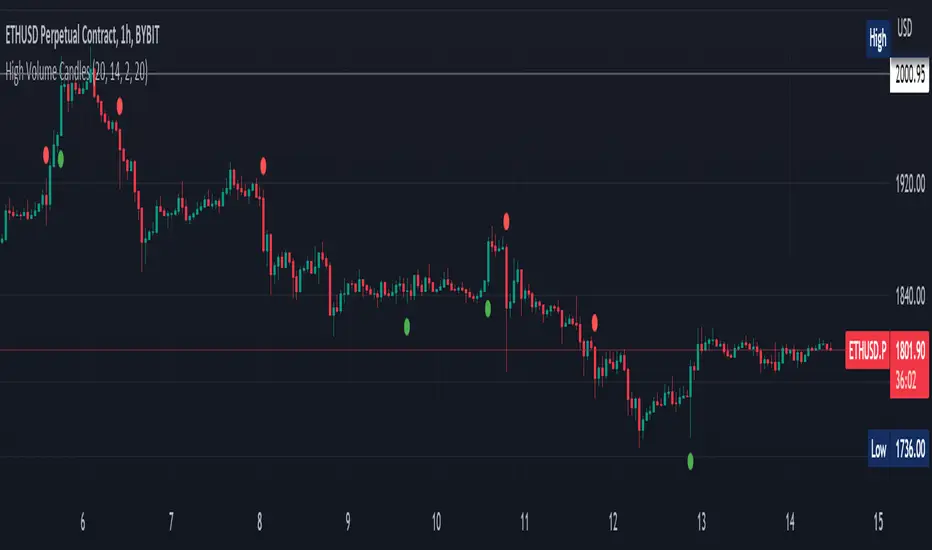
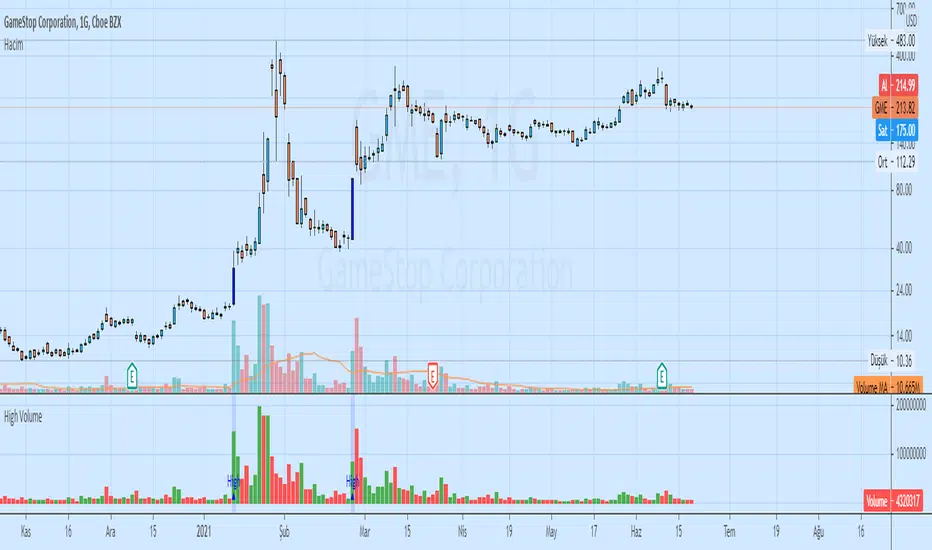
High Volume Bars (Advanced)High Volume Bars (Advanced)
High Volume Bars (Advanced) is a Pine Script v6 indicator for TradingView that highlights bars with unusually high volume, with several ways to define “unusual”:
Classic: volume > moving average + N × standard deviation
Change-based: large change in volume vs previous bar
Z-score: statistically extreme volume values
Robust mode (optional): median + MAD, less sensitive to outliers
It can:
Recolor candles when volume is high
Optionally highlight the background
Optionally plot volume bands (center ± spread × multiplier)
⸻
1. How it works
At each bar the script:
Picks the volume source:
If Use Volume Change vs Previous Bar? is off → uses raw volume
If on → uses abs(volume - volume )
Computes baseline statistics over the chosen source:
Lookback bars
Moving average (SMA or EMA)
Standard deviation
Optionally replaces mean/std with robust stats:
Center = median (50th percentile)
Spread = MAD (median absolute deviation, scaled to approx σ)
Builds bands:
upper = center + spread * multiplier
lower = max(center - spread * multiplier, 0)
Flags a bar as “high volume” if:
It passes the mode logic:
Classic abs: volume > upper
Change mode: abs(volume - volume ) > upper
Z-score mode: z-score ≥ multiplier
AND the relative filter (optional): volume > average_volume * Min Volume vs Avg
AND it is past the first Skip First N Bars from the start of the chart
Colors the bar and (optionally) the background accordingly.
⸻
2. Inputs
2.1. Statistics
Lookback (len)
Number of bars used to compute the baseline stats (mean / median, std / MAD).
Typical values: 50–200.
StdDev / Z-Score Multiplier (mult)
How far from the baseline a bar must be to count as “high volume”.
In classic mode: volume > mean + mult × std
In z-score mode: z ≥ mult
Typical values: 1.0–2.5.
Use EMA Instead of SMA? (smooth_with_ema)
Off → uses SMA (slower but smoother).
On → uses EMA (reacts faster to recent changes).
Use Robust Stats (Median & MAD)? (use_robust)
Off → mean + standard deviation
On → median + MAD (less sensitive to a few insane spikes)
Useful for assets with occasional volume blow-ups.
⸻
2.2. Detection Mode
These inputs control how “unusual” is defined.
• Use Volume Change vs Previous Bar? (mode_change)
• Off (default) → uses absolute volume.
• On → uses abs(volume - volume ).
You then detect jumps in volume rather than absolute size.
Note: This is ignored if Z-Score mode is switched on (see below).
• Use Z-Score on Volume? (Overrides change) (mode_zscore)
• Off → high volume when raw value exceeds the upper band.
• On → computes z-score = (value − center) / spread and flags a bar as high when z ≥ multiplier.
Z-score mode can be combined with robust stats for more stable thresholds.
• Min Volume vs Avg (Filter) (min_rel_mult)
An extra filter to ignore tiny-volume bars that are statistically “weird” but not meaningful.
• 0.0 → no filter (all stats-based candidates allowed).
• 1.0 → high-volume bar must also be at least equal to average volume.
• 1.5 → bar must be ≥ 1.5 × average volume.
• Skip First N Bars (from start of chart) (skip_open_bars)
Skips the first N bars of the chart when evaluating high-volume conditions.
This is mostly a safety / cosmetic option to avoid weird behavior on very early bars or backfill.
⸻
2.3. Visuals
• Show Volume Bands? (show_bands)
• If on, plots:
• Upper band (upper)
• Lower band (lower)
• Center line (vol_center)
These are plotted on the same pane as the script (usually the price chart).
• Also Highlight Background? (use_bg)
• If on, fills the background on high-volume bars with High-Vol Background.
• High-Vol Bar Transparency (0–100) (bar_transp)
Controls the opacity of the high-volume bar colors (up / down).
• 0 → fully opaque
• 100 → fully transparent (no visible effect)
• Up Color (upColor) / Down Color (dnColor)
• Regular bar colors (non high-volume) for up and down bars.
• Up High-Vol Base Color (upHighVolBase) / Down High-Vol Base Color (dnHighVolBase)
Base colors used for high-volume up/down bars. Transparency is applied on top of these via bar_transp.
• High-Vol Background (bgHighVolColor)
Background color used when Also Highlight Background? is enabled.
⸻
3. What gets colored and how
• Bar color (barcolor)
• Up bar:
• High volume → Up High-Vol Color
• Normal volume → Up Color
• Down bar:
• High volume → Down High-Vol Color
• Normal volume → Down Color
• Flat bar → neutral gray
• Background color (bgcolor)
• If Also Highlight Background? is on, high-volume bars get High-Vol Background.
• Otherwise, background is unchanged.
⸻
4. Alerts
The indicator exposes three alert conditions:
• High Volume Bar
Triggers whenever is_high is true (up or down).
• High Volume Up Bar
Triggers only when is_high is true and the bar closed up (close > open).
• High Volume Down Bar
Triggers only when is_high is true and the bar closed down (close < open).
You can use these in TradingView’s “Create Alert” dialog to:
• Get notified of potential breakout / exhaustion bars.
• Trigger webhook events for bots / custom infra.
⸻
5. Recommended presets
5.1. “Classic” high-volume detector (closest to original)
• Lookback: 150–200
• StdDev / Z-Score Multiplier: 1.0–1.5
• Use EMA Instead of SMA?: off
• Use Robust Stats?: off
• Use Volume Change vs Previous Bar?: off
• Use Z-Score on Volume?: off
• Min Volume vs Avg (Filter): 0.0–1.0
Behavior: Flags bars whose volume is notably above the recent average (plus a bit of noise filtering), same spirit as your initial implementation.
⸻
5.2. Volatility-aware (Z-score) mode
• Lookback: 100–200
• StdDev / Z-Score Multiplier: 1.5–2.0
• Use EMA Instead of SMA?: on
• Use Robust Stats?: on (if asset has huge spikes)
• Use Volume Change vs Previous Bar?: off (ignored anyway in z-score mode)
• Use Z-Score on Volume?: on
• Min Volume vs Avg (Filter): 0.5–1.0
Behavior: Flags bars that are “statistically extreme” relative to recent volume behavior, not just absolutely large. Good for assets where baseline volume drifts over time.
⸻
5.3. “Wake-up bar” (volume acceleration)
• Lookback: 50–100
• StdDev / Z-Score Multiplier: 1.0–1.5
• Use EMA Instead of SMA?: on
• Use Robust Stats?: optional
• Use Volume Change vs Previous Bar?: on
• Use Z-Score on Volume?: off
• Min Volume vs Avg (Filter): 0.5–1.0
Behavior: Emphasis on sudden increases in volume rather than absolute size – useful to catch “first active bar” after a quiet period.
⸻
6. Limitations / notes
• Time-of-day effects
The script currently treats the entire chart as one continuous “session”. On 24/7 markets (crypto) this is fine. For regular-session assets (equities, futures), volume naturally spikes at open/close; you may want to:
• Use a shorter Lookback, or
• Add a session-aware filter in a future iteration.
• Illiquid symbols
On very low-liquidity symbols, robust stats (Use Robust Stats) and a non-zero Min Volume vs Avg can help avoid “everything looks extreme” problems.
• Overlay behavior
overlay = true means:
• Bars are recolored on the price pane.
• Volume bands are also drawn on the price pane if enabled.
If you want a dedicated panel for the bands, duplicate the logic in a separate script with overlay = false.
Penunjuk Pine Script®