Exponential Hull MA Oscillator PrototypeClamped EHMA Oscillator Prototype with 21/200 EHMA with additional JMA smoothing (Credit: @everget)
Note: This is an experiment - this is not a polished indicator
Hullmovingaverage

Hull MAThis Hull MA uses the default settings of the built-in MA. The basic idea is that we are in a buy setup when hull is below price, and a sell setup when hull is above price. The indicator is extended with slightly change in contrast when moving average is declining and it plot the ma/price crossovers: green dot when a buy setup is appearing, and red dot when a sell setup is forming. It is possible to hide crossovers in the option panel.
Three alert conditions is added "Hull MA cross", "Hull MA sell" and "Hull MA buy". I use "Hull MA cross" on slow frames (2w, M) and "Hull MA buy/sell" on faster frames.

Multi SMA EMA WMA HMA BB (5x8 MAs Bollinger Bands) MAX MTF - RRBMulti SMA EMA WMA HMA 4x7 Moving Averages with Bollinger Bands MAX MTF by RagingRocketBull 2019
Version 1.0
All available MAX MTF versions are listed below (They are very similar and I don't want to publish them as separate indicators):
ver 1.0: 4x7 = 28 MTF MAs + 28 Levels + 3 BB = 59 < 64
ver 2.0: 5x6 = 30 MTF MAs + 30 Levels + 3 BB = 63 < 64
ver 3.0: 3x10 = 30 MTF MAs + 30 Levels + 3 BB = 63 < 64
ver 4.0: 5(4+1)x8 = 8 CurTF MAs + 32 MTF MAs + 20 Levels + 3 BB = 63 < 64
ver 5.0: 6(5+1)x6 = 6 CurTF MAs + 30 MTF MAs + 24 Levels + 3 BB = 63 < 64
ver 6.0: 4(3+1)x10 = 10 CurTF MAs + 30 MTF MAs + 20 Levels + 3 BB = 63 < 64
Fib numbers: 8, 13, 21, 34, 55, 89, 144, 233, 377
This indicator shows multiple MAs of any type SMA EMA WMA HMA etc with BB and MTF support, can show MAs as dynamically moving levels.
There are 4 MA groups + 1 BB group, a total of 4 TFs * 7 MAs = 28 MAs. You can assign any type/timeframe combo to a group, for example:
- EMAs 9,12,26,50,100,200,400 x H1, H4, D1, W1 (4 TFs x 7 MAs x 1 type)
- EMAs 8,13,21,30,34,50,55,89,100,144,200,233,377,400 x M15, H1 (2 TFs x 14 MAs x 1 type)
- D1 EMAs and SMAs 8,13,21,30,34,50,55,89,100,144,200,233,377,400 (1 TF x 14 MAs x 2 types)
- H1 WMAs 13,21,34,55,89,144,233; H4 HMAs 9,12,26,50,100,200,400; D1 EMAs 12,26,89,144,169,233,377; W1 SMAs 9,12,26,50,100,200,400 (4 TFs x 7 MAs x 4 types)
- +1 extra MA type/timeframe for BB
There are several versions: Simple, MTF, Pro MTF, Advanced MTF, MAX MTF and Ultimate MTF. This is the MAX MTF version. The Differences are listed below. All versions have BB
- Simple: you have 2 groups of MAs that can be assigned any type (5+5)
- MTF: +2 custom Timeframes for each group (2x5 MTF) +1 TF for BB, TF XY smoothing
- Pro MTF: 4 custom Timeframes for each group (4x3 MTF), 1 TF for BB, MA levels and show max bars back options
- Advanced MTF: +4 extra MAs/group (4x7 MTF), custom Ticker/Symbols, Timeframe <>= filter, Remove Duplicates Option
- MAX MTF: +2 subtypes/group, packed to the limit with max possible MAs/TFs: 4x7, 5x6, 3x10, 4(3+1)x10, 5(4+1)x8, 6(5+1)x6
- Ultimate MTF: +individual settings for each MA, custom Ticker/Symbols
MAX MTF version tests the limits of Pinescript trying to squeeze as many MAs/TFs as possible into a single indicator.
It's basically a maxed out Advanced version with subtypes allowing for mixed types within a group (i.e. both emas and smas in a single group/TF)
Pinescript has the following limits:
- max 40 security calls (6 calls are reserved for dupe checks and smoothing, 2 are used for BB, so only 32 calls are available)
- max 64 plot outputs (BB uses 3 outputs, so only 61 plot outputs are available)
- max 50000 (50kb) size of the compiled code
Based on those limits, you can only have the following MAs/TFs combos in a single script:
1. 4x7, 5x6, 3x10 - total number of MTF MAs must always be <= 32, and you can still have BB and Num Levels = total MAs, without any compromises
2. 5(4+1)x8, 6(5+1)x6, 4(3+1)x10 - you can use the Current Symbol/Timeframe as an extra (+1) fixed TF with the same number of MTF MAs
- you don't need to call security to display MAs on the Current Symbol/Timeframe, so the total number of MTF MAs remains the same and is still <= 32
- to fit that many MAs into the max 64 plot outputs limit you need to reduce the number of levels (not every MA Group will have corresponding levels)
Features:
- 4x7 = 28 MAs of any type
- 4x MTF groups with XY step line smoothing
- +1 extra TF/type for BB MAs
- 2 MA subtypes within each group/TF
- 4x7 = 28 MA levels with adjustable group offsets, indents and shift
- supports any existing type of MA: SMA, EMA, WMA, Hull Moving Average (HMA)
- custom tickers/symbols for each group
- show max bars back option
- show/hide both groups of MAs/levels/BB and individual MAs
- timeframe filter: show only MAs/Levels with TFs <>= Current TF
- hide MAs/Levels with duplicate TFs
- support for custom TFs that are not available in free accounts: 2D, 3D etc
- support for timeframes in H: H, 2H, 4H etc
Notes:
- Uses timeframe textbox instead of input resolution dropdown to allow for 240 120 and other custom TFs
- Uses symbol textbox instead of input symbol to avoid establishing multiple dummy security connections to the current ticker - otherwise empty symbols will prevent script from running
- Possible reasons for missing MAs on a chart:
- there may not be enough bars in history to start plotting it. For example, W1 EMA200 needs at least 200 bars on a weekly chart.
- for charts with low/fractional prices i.e. 0.00002 << 0.001 (default Y smoothing step) decrease Y smoothing as needed (set Y = 0.0000001) or disable it completely (set X,Y to 0,0)
- for charts with high price values i.e. 20000 >> 0.001 increase Y smoothing as needed (set Y = 10-20). Higher values exceeding MAs point density will cause it to disappear as there will be no points to plot. Different TFs may require diff adjustments
- TradingView Replay Mode UI and Pinescript security calls are limited to TFs >= D (D,2D,W,MN...) for free accounts
- attempting to plot any TF < D1 in Replay Mode will only result in straight lines, but all TFs will work properly in history and real-time modes. This is not a bug.
- Max Bars Back (num_bars) is limited to 5000 for free accounts (10000 for paid), will show error when exceeded. To plot on all available history set to 0 (default)
- Slow load/redraw times. This indicator becomes slower, its UI less responsive when:
- Pinescript Node.js graphics library is too slow and inefficient at plotting bars/objects in a browser window. Code optimization doesn't help much - the graphics engine is the main reason for general slowness.
- the chart has a long history (10000+ bars) in a browser's cache (you have scrolled back a couple of screens in a max zoom mode).
- Reload the page/Load a fresh chart and then apply the indicator or
- Switch to another Timeframe (old TF history will still remain in cache and that TF will be slow)
- in max possible zoom mode around 4500 bars can fit on 1 screen - this also slows down responsiveness. Reset Zoom level
- initial load and redraw times after a param change in UI also depend on TF. For example: D1/W1 - 2 sec, H1/H4 - 5-6 sec, M30 - 10 sec, M15/M5 - 4 sec, M1 - 5 sec. M30 usually has the longest history (up to 16000 bars) and W1 - the shortest (1000 bars).
- when indicator uses more MAs (plots) and timeframes it will redraw slower. Seems that up to 5 Timeframes is acceptable, but 6+ Timeframes can become very slow.
- show_last=last_bars plot limit doesn't affect load/redraw times, so it was removed from MA plot
- Max Bars Back (num_bars) default/custom set UI value doesn't seem to affect load/redraw times
- In max zoom mode all dynamic levels disappear (they behave like text)
- Dupe check includes symbol: symbol, tf, both subtypes - all must match for a duplicate group
- For the dupe check to work correctly a custom symbol must always include an exchange prefix. BB is not checked for dupes
Good Luck! Feel free to learn from/reuse the code to build your own indicators.

Exponential Hull Moving Average (EHMA)Source for Exponential Hull Moving Average (EHMA) formula:
Raudys, Aistis & Lenčiauskas, Vaidotas & Malčius, Edmundas. (2013). Moving Averages for Financial Data Smoothing. Communications in Computer and Information Science. 403. 34-45. 10.1007/978-3-642-41947-8_4.
The Exponential Hull Moving Average is nearly identical to the Hull MA, but EMA used instead of WMA.
Credit to @RicardoSantos for the existing implementation of the Hull Moving Average in pinescript:

Multi SMA EMA WMA HMA BB (4x5 MAs Bollinger Bands) Adv MTF - RRBMulti SMA EMA WMA HMA 4x5 Moving Averages with Bollinger Bands Advanced MTF by RagingRocketBull 2019
Version 1.0
This indicator shows multiple MAs of any type SMA EMA WMA HMA etc with BB and MTF support, can show MAs as dynamically moving levels.
There are 4 MA groups + 1 BB group, a total of 4 TFs * 5 MAs = 20 MAs. You can assign any type/timeframe combo to a group, for example:
- EMAs 12,26,50,100,200 x H1, H4, D1, W1 (4 TFs x 5 MAs x 1 type)
- EMAs 8,10,13,21,30,50,55,100,200,400 x M15, H1 (2 TFs x 10 MAs x 1 type)
- D1 EMAs and SMAs 8,10,12,26,30,50,55,100,200,400 (1 TF x 10 MAs x 2 types)
- H1 WMAs 7,77,89,167,231; H4 HMAs 12,26,50,100,200; D1 EMAs 89,144,169,233,377; W1 SMAs 12,26,50,100,200 (4 TFs x 5 MAs x 4 types)
- +1 extra MA type/timeframe for BB
There are several versions: Simple, MTF, Pro MTF, Advanced MTF and Ultimate MTF. This is the Advanced MTF version. The Differences are listed below. All versions have BB
- Simple: you have 2 groups of MAs that can be assigned any type (5+5)
- MTF: +2 custom Timeframes for each group (2x5 MTF) +1 TF for BB, TF XY smoothing
- Pro MTF: 4 custom Timeframes for each group (4x3 MTF), 1 TF for BB, MA levels and show max bars back options
- Advanced MTF: +2 extra MAs/group (4x5 MTF), custom Ticker/Symbols, Timeframe <>= filter, Remove Duplicates Option
- Ultimate MTF: +individual settings for each MA, custom Ticker/Symbols
Features:
- 4x5 = 20 MAs of any type
- 4x MTF groups with XY step line smoothing
- +1 extra TF/type for BB MAs
- 4x5 = 20 MA levels with adjustable group offsets, indents and shift
- supports any existing type of MA: SMA, EMA, WMA, Hull Moving Average (HMA)
- custom tickers/symbols for each group - you can compare MAs of the same symbol across exchanges
- show max bars back option
- show/hide both groups of MAs/levels/BB and individual MAs
- timeframe filter: show only MAs/Levels with TFs <>= Current TF
- hide MAs/Levels with duplicate TFs
- support for custom TFs that are not available in free accounts: 2D, 3D etc
- support for timeframes in H: H, 2H, 4H etc
Notes:
- Uses timeframe textbox instead of input resolution dropdown to allow for 240 120 and other custom TFs
- Uses symbol textbox instead of input symbol to avoid establishing multiple dummy security connections to the current ticker - otherwise empty symbols will prevent script from running
- Possible reasons for missing MAs on a chart:
- there may not be enough bars in history to start plotting it. For example, W1 EMA200 needs at least 200 bars on a weekly chart.
- price << default Y smoothing step 5. For charts with low/fractional prices (i.e. 0.00002 << 5) adjust X Y smoothing as needed (set Y = 0.0000001) or disable it completely (set X,Y to 0,0)
- TradingView Replay Mode UI and Pinescript security calls are limited to TFs >= D (D,2D,W,MN...) for free accounts
- attempting to plot any TF < D1 in Replay Mode will only result in straight lines, but all TFs will work properly in history and real-time modes. This is not a bug.
- Max Bars Back (num_bars) is limited to 5000 for free accounts (10000 for paid), will show error when exceeded. To plot on all available history set to 0 (default)
- Slow load/redraw times. This indicator becomes slower, its UI less responsive when:
- Pinescript Node.js graphics library is too slow and inefficient at plotting bars/objects in a browser window. Code optimization doesn't help much - the graphics engine is the main reason for general slowness.
- the chart has a long history (10000+ bars) in a browser's cache (you have scrolled back a couple of screens in a max zoom mode).
- Reload the page/Load a fresh chart and then apply the indicator or
- Switch to another Timeframe (old TF history will still remain in cache and that TF will be slow)
- in max possible zoom mode around 4500 bars can fit on 1 screen - this also slows down responsiveness. Reset Zoom level
- initial load and redraw times after a param change in UI also depend on TF. For example:
D1/W1 - 2 sec, H1/H4 - 5-6 sec, M30 - 10 sec, M15/M5 - 4 sec, M1 - 5 sec.
M30 usually has the longest history (up to 16000 bars) and W1 - the shortest (1000 bars).
- when indicator uses more MAs (plots) and timeframes it will redraw slower. Seems that up to 5 Timeframes is acceptable, but 6+ Timeframes can become very slow.
- show_last=last_bars plot limit doesn't affect load/redraw times, so it was removed from MA plot
- Max Bars Back (num_bars) default/custom set UI value doesn't seem to affect load/redraw times
- In max zoom mode all dynamic levels disappear (they behave like text)
1. based on 3EmaBB, uses plot*, barssince and security functions
2. you can't set certain constants from input due to Pinescript limitations - change the code as needed, recompile and use as a private version
3. Levels = trackprice implementation
4. Show Max Bars Back = show_last implementation
5. swma has a fixed length = 4, alma and linreg have additional offset and smoothing params
6. Smoothing is applied by default for visual aesthetics on MTF. To use exact ma mtf values (lines with stair stepping) - disable it
Good Luck! You can explore, modify/reuse the code to build your own indicators.

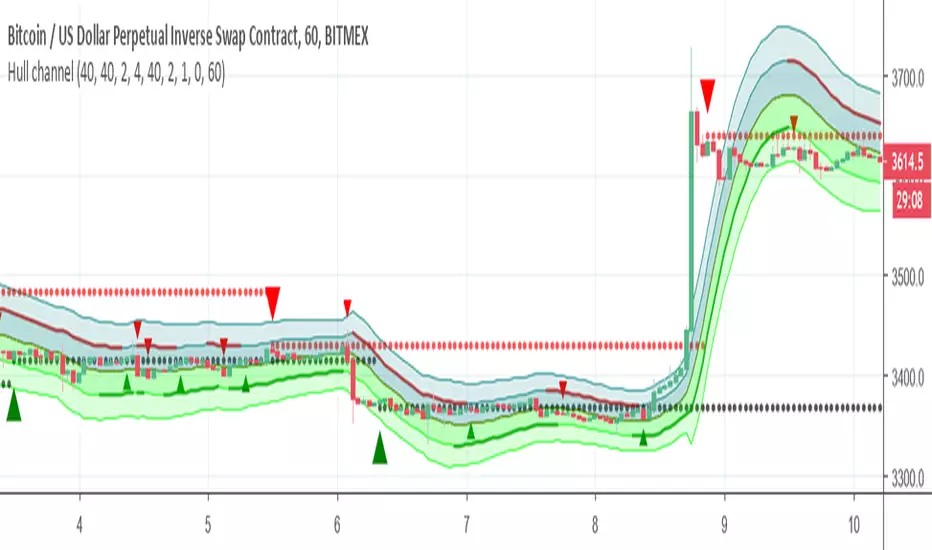
Hull channelThis Hull based channel , the resistance and the support based on Hull which also can be calculated as signal (big triangle) and represent by circles (red and black)
the channel has bands that are based on ATR and std (2 or 4) you can change as you like
The small arrow in green and red are the slope calculation (this also has signal and alerts)
there is bullish and bearish zone that you can highlight to see where you are according to slope
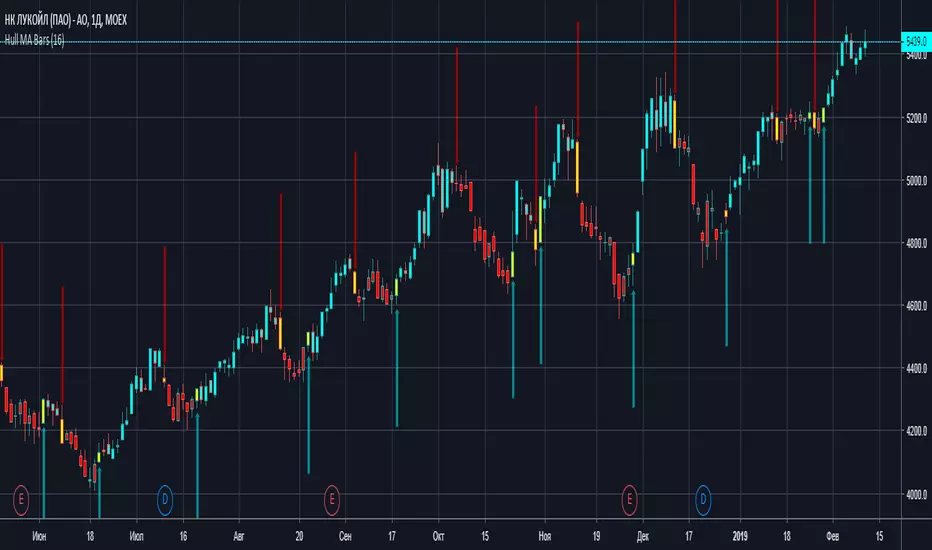
Hull MA BarsThis indicator fill bars with color of HullMA + warning yellow bars, then trend reversing
HullMA Strategy--HULL 20 Hisse senedinin hull moving average gibi hızlı bir hareketli ortalamada 20 li paremetrege performansını göstermektedir. Kodu trdingwiewswn alınmıştır.

CryptoCoyns HullMA [v2018-12-10]CryptoCoyns Hull Moving Average
This indicator implements the Hull moving average.
The Hull Moving Average (HMA), developed by Alan Hull, is an extremely
fast and smooth moving average. In fact, the HMA almost eliminates lag
altogether and manages to improve smoothing at the same time. A longer
period HMA may be used to identify trend. If the HMA is rising, the
prevailing trend is rising, indicating it may be better to enter long
positions. If the HMA is falling, the prevailing trend is also falling,
indicating it may be better to enter short positions. A shorter period
HMA may be used for entry signals in the direction of the prevailing trend.
The Source for price can be defined. i.e. Close, Open, High, Low, etc.
The period length used can be defined.
MA Line colour is fully configurable.
If you get some value out of this indicator please consider making
a small donation to my favourite charity the Save the Childrens Fund.
Every donation will make a difference to the lives of children.
All donations over $2 are tax deductable. You can donate here:
savethechildrenfundraising.org.au
Copyright (c) 2018, Grant Cause aka CryptoCoyns

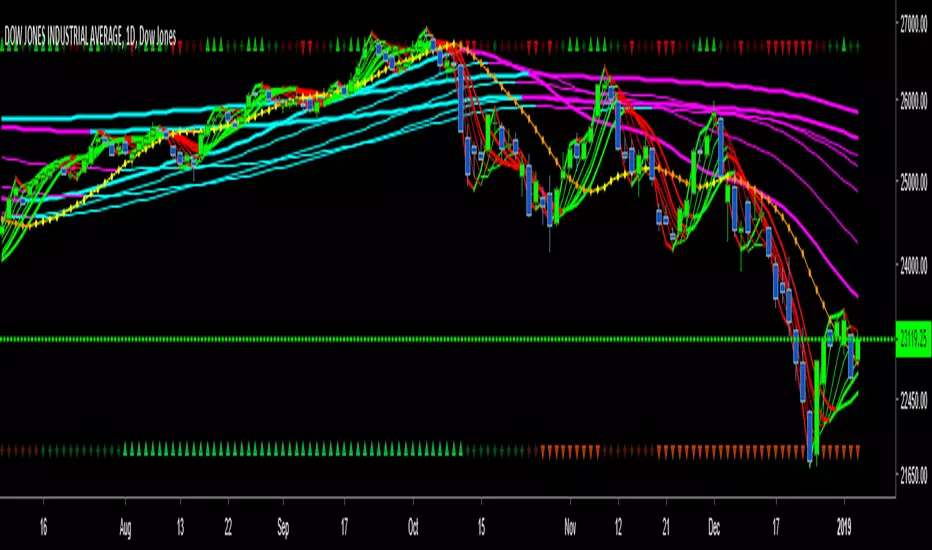
Multiple Moving Average Colors7 moving averages in 1 indicator, including the Hull Moving Average.
I've updated with some graphics that print at the top of the chart (you can change color and placement on the indicator settings page)
All 7 MAs Up - Green and up triangle
All 7 MAs Down - Red and down triangle
4, 5 or 6 MAs Up - Dark green and a square
4, 5 or 6 MAs Down - Maroon and a square

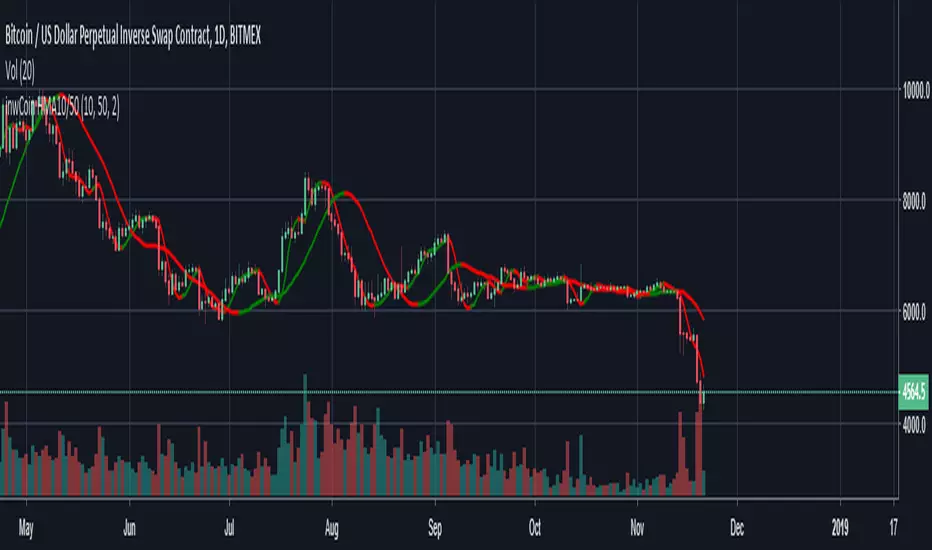
inwCoin HMA10/50Just simple HMA 10/50 with color change when trend change ( Red = downtrend / Green = uptrend )
Hull50Signals are based on Hull 50 length
You can change the length if you want it to buy more or less
have fun

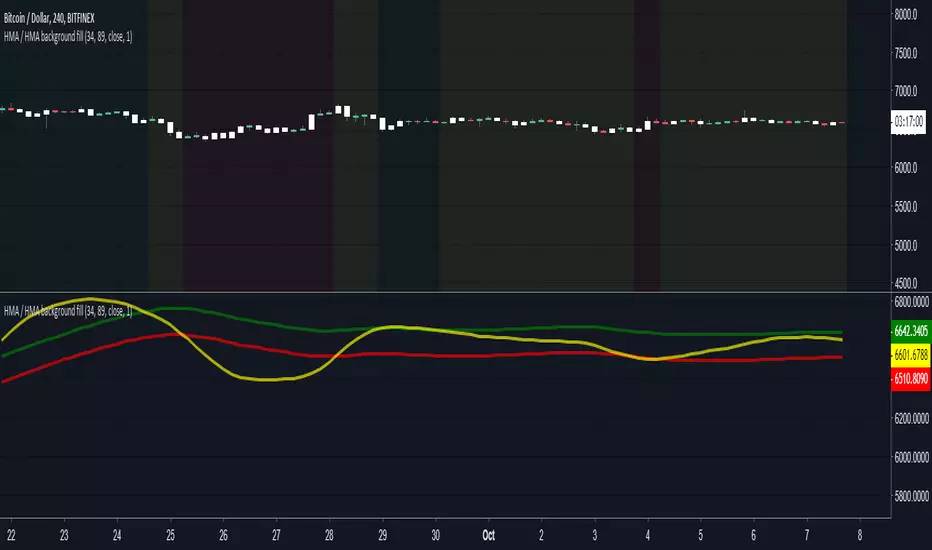
HMA + HMA + Dispersion background fill (ver 2.0)fast HMA • slow HMA • Dispersion Zone| background color's
---
Background colors: Red, Green and Yellow. Default transperent = 5%
• Green background: fast HMA above the dispersion zone
• Red background: fast HMA below the dispersion zone
• Yellow background: fast HMA inside the Dispersion Zone
---
# Alerts only for cross Yellow to Green and Yellow to Red zones.
---
• The dispersion zone is calculated relative to the slow HMA.
Fast - Slow HMA background fillfast HMA • slow HMA | background
---
Background colors: Red and Green. Default transperent = 2%
• Green background: "fastHMA" crossover "slowHMA"
• Red background: "fastHMA" crossdown "slowHMA"

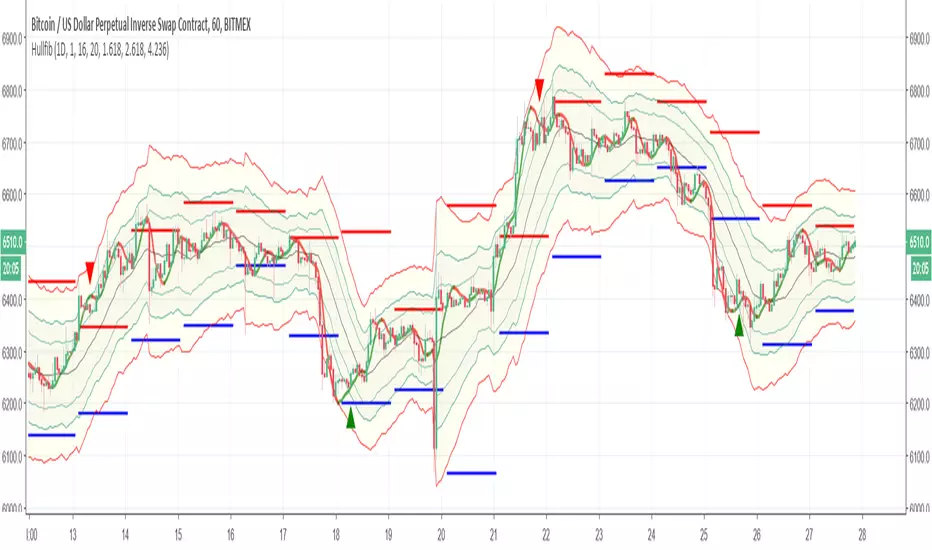
HullfibSo this indicator is just to show a concept
it based on Bollinger type of fibs with regular daily fibs (upper =red,lower= blue) and the signal produce by the Hull moving average
the idea is to compare the regular fibs and the Bollinger type of fibs so it easy in this way to see where the real low and where the real high
the hull moving average can be set to be faster or shorter for the buy signal. since it open code you can add or change what ever you want
have fun
Uncle Mo's Ultimate Ichimoku V1Main features:
2 x Ichimoku Cloud
5 x EMA
2 x MA
1 x HullMA
Williams Fractals
Study is based around trader @br0qn 's Ichimoku script.
Credits also go to:
@RicardoSantos for the Bill Williams Fractals
@EmilianoMesa for the EMAs/MAs
@mohamed982 for the HullMA
The script is open source so please feel free to change it around. I'd greatly appreciate it if you could suggest ways to improve it.
Happy trading!

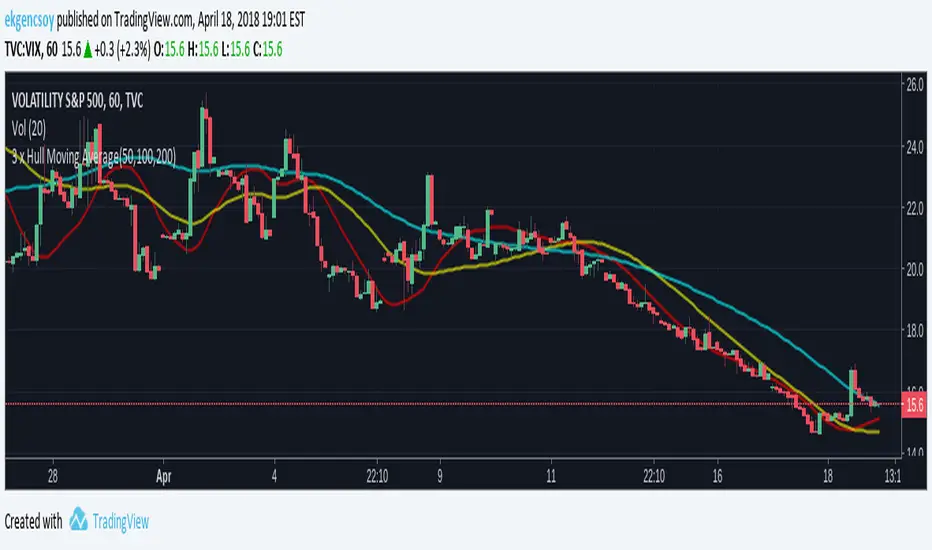
CryptogramTR with OPEN CODEIndicator is obtained by importing RSI(14) into HULL moving average source with 2 different periods, as one is long period and the other is short.
When green line (short period) cross upward the red line (long period) , this is a BUY; vice versa it is a SELL.
When HMA Short Period is set to 1 (one), yielding line is absolutely the same line of RSI (14). You can change it into 8(eight) preferably.
İndikatör, RSI(14) indikatörünün, hull hareketli ortalamasının kod kaynağı olarak atanması ile elde edilmiştir. Uzun ve kısa olmak üzere 2 ayrı periyot kullanılmıştır.
Yeşil çizgi yani kısa periyotlu çizgi, kırmızı yani uzun periyotlu olanı yukarı keserse AL, tersi durum SAT olarak düşünülmelidir.
Hull Kısa Periyodu 1 iken oluşan yeşil çizgi, RSI(14) indikatörünü vermektedir. Kısa periyot olarak tercihinize göre bu değeri 8 olarak da kullanabilirsiniz.

(YEK) Bollinger Bands & DoubleHMA & MA CrossMy favorite indicators ALL-IN-1: Bollinger Bands, Double Hull Moving Average (21,8), Double Moving Average (200,50)
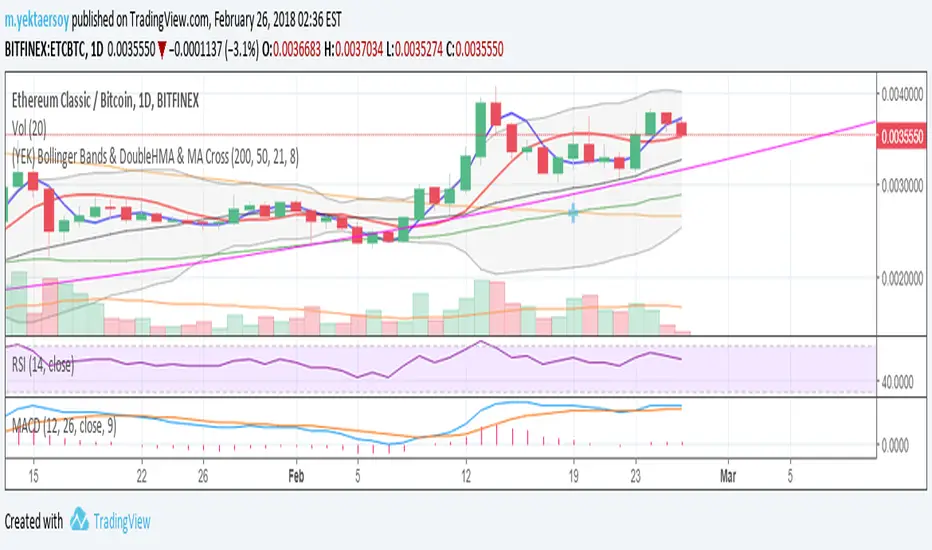
Hull Moving Average + Bollinger BandsThis study make use of Hull Moving Average and Bollinger Bands.
The crosses give signal about HMA and BB crossovers, they are a bit lagging, if you stare well you will spot them a little earlier. It look like a good idea to buy and sell when HMA is near or on the outside of the outer bands.
By default the Bollinger Bands uses Simple Moving Average with 21 periodes, and Hull Moving Average use 9 periodes. You can alter the settings in the format dialog.
Please use as pleased, and if you do something clever with it I'll be happy to know :D


Double HULL Moving AverageTHIS IS A COMBINATION OF TWO HULL MOVING AVERAGE LINES
-ONE WITH LONGER PERIOD
-OTHER WITH SHORTER PERIOD TO INDICATE BUY/SELL SIGNALS
AS THE KNOWN GENERAL RULE;
IT WOULD BE A BUY SIGNAL WHEN SHORTER(BLUE LINE) HULL CROSSES ABOVE LONGER (RED LINE) ONE
AND CONVERSELY A SELL SIGNAL WHEN LONGER HULL CROSSES ABOVE SHORTER ONE
THIS STUFF IS USEFUL FOR USERS COMPLAINING ABOUTREACHING THE MAXIMUM NUMBER OF INDICATORS :)
KıvanÇ
@fr3762 on twitter (only tweeting in TURKISH)
fr3762 on youtube for indicator explanations in TURKISH)
TURKISH EXPLANATION:
2 HULL hareketli ortalaması aynı grafikte:
Kısa periyotlu (mavi) olan uzunu yukarı kestiğinde AL
Uzun periyotlu (kırmızı) olan kısayı yukarı kestiğinde SAT sinyalleri üretir
Varsayılan periyotlar, birer Fibonacci sayıları olan 8 ve 21 olarak belirlenmiştir, değiştirilebilir.
İndikatör sayısı sınırlamasının önüne geçmek amacıyla geliştirilmiştir.
