LVN/HVN Auto Detection [PhenLabs]📊 PhenLabs - LVN/HVN Auto Detection
Version: PineScript™ v6
📌 Description
The PhenLabs LVN/HVN Auto Detection indicator is an advanced volume profile analysis tool that automatically identifies Low Volume Nodes (LVN) and High Volume Nodes (HVN) across multiple trading sessions. This sophisticated indicator analyzes volume distribution patterns to pinpoint critical support and resistance levels where price is likely to react, providing traders with high-probability zones for entries, exits, and risk management.
Unlike traditional volume indicators that only show current activity, this tool builds comprehensive volume profiles from historical sessions and intelligently filters the most significant levels. It combines real-time volume analysis with dynamic level detection, offering both visual bubbles for immediate volume activity and persistent horizontal lines that act as ongoing support/resistance references.
🚀 Points of Innovation
Multi-Session Volume Profile Analysis - Automatically calculates and analyzes volume profiles across the last 5 trading sessions
Intelligent Level Separation Logic - Prevents overlapping signals by maintaining minimum separation between LVN and HVN levels
Dynamic Timeframe Adaptation - Automatically adjusts session lengths based on chart timeframe for optimal level detection
Real-Time Activity Bubbles - Shows volume activity strength through different bubble sizes at key levels
Persistent Line Management - Creates horizontal lines that extend until price crosses them, providing ongoing reference points
Dual Threshold System - Independent percentage-based thresholds for both LVN and HVN identification
🔧 Core Components
Volume Profile Engine : Builds 20-row volume profiles for each analyzed session, distributing volume across price levels
Level Identification Algorithm : Uses percentage-based thresholds to classify volume distribution patterns
Separation Logic : Ensures minimum distance between conflicting levels, prioritizing HVN when overlap occurs
Line Management System : Tracks active support/resistance lines and removes them when price crosses through
Volume Activity Monitor : Compares current volume to 13-period moving average for activity classification
🔥 Key Features
Customizable Thresholds : LVN threshold (5-35%, default 20%) and HVN threshold (65-95%, default 80%) for precise level filtering
Volume Activity Multiplier : Adjustable volume threshold (0.5+, default 1.5) for bubble and line creation sensitivity
Flexible Display Modes : Choose between Lines only, Bubbles only, or Both for optimal chart clarity
Smart Level Separation : Minimum separation percentage (0.1-2%, default 0.5%) prevents conflicting signals
Color Customization : Independent color controls for LVN (red) and HVN (blue) elements
Performance Optimization : Processes every 15 bars with maximum 500 active lines for smooth operation
🎨 Visualization
Colored Bubbles : Three sizes (large, medium, small) indicate volume activity strength at key levels
Horizontal Lines : Persistent support/resistance lines with width corresponding to volume activity
Dual Color System : Semi-transparent red for LVN areas, semi-transparent blue for HVN zones
Information Tooltip : Optional table showing usage guidelines and optimization tips
📖 Usage Guidelines
Volume Thresholds
LVN Threshold
○ Default: 20.0%
○ Range: 5.0-35.0%
○ Description: Price levels with volume below this percentage are marked as LVNs. Lower values create fewer, more significant levels. Typical range 15-25% works for most instruments.
HVN Threshold
○ Default: 80.0%
○ Range: 65.0-95.0%
○ Description: Price levels with volume above this percentage are marked as HVNs. Higher values create fewer, stronger levels. Range 75-85% is optimal for most trading.
Display Controls
Volume Threshold
○ Default: 1.5
○ Range: 0.5+
○ Description: Multiplier for volume significance (High=2+threshold, Medium=1+threshold, Low=0+threshold). Higher values require more volume for signals.
✅ Best Use Cases
Swing Trading : Identify key levels for position entries and exits over multiple days
Scalping : Use bubbles for immediate volume activity confirmation at critical levels
Risk Management : Place stops beyond LVN levels where price moves quickly
Breakout Trading : Monitor HVN levels for potential breakout or rejection scenarios
Multi-Timeframe Analysis : Combine with higher timeframe levels for confluence
⚠️ Limitations
Timeframe Sensitivity : Lower timeframes may produce too many levels; higher timeframes recommended for cleaner signals
Volume Data Dependency : Accuracy depends on reliable volume data from your data provider
Historical Analysis : Uses past volume data which may not predict future price behavior
Performance Impact : High number of active lines may affect chart performance on slower devices
💡 What Makes This Unique
Automated Session Analysis : No manual drawing required - automatically analyzes multiple sessions
Intelligent Filtering : Advanced separation logic prevents overlapping and conflicting signals
Adaptive Processing : Adjusts to different timeframes automatically for optimal level detection
Dual Visualization System : Combines persistent lines with real-time activity indicators
🔬 How It Works
1. Volume Profile Construction :
Analyzes the last 5 trading sessions with dynamic session length based on timeframe
Divides each session’s price range into 20 equal levels for volume distribution analysis
2. Level Classification :
Calculates volume percentage at each price level relative to session maximum
Identifies LVN levels below threshold and HVN levels above threshold
3. Signal Generation :
Creates bubbles when volume activity exceeds thresholds at identified levels
Draws horizontal lines that persist until price crosses through them
💡 Note : For optimal results, increase your chart timeframe if you see too many levels. The indicator performs best on 15-minute and higher timeframes where volume patterns are more meaningful and less noisy.
HVN

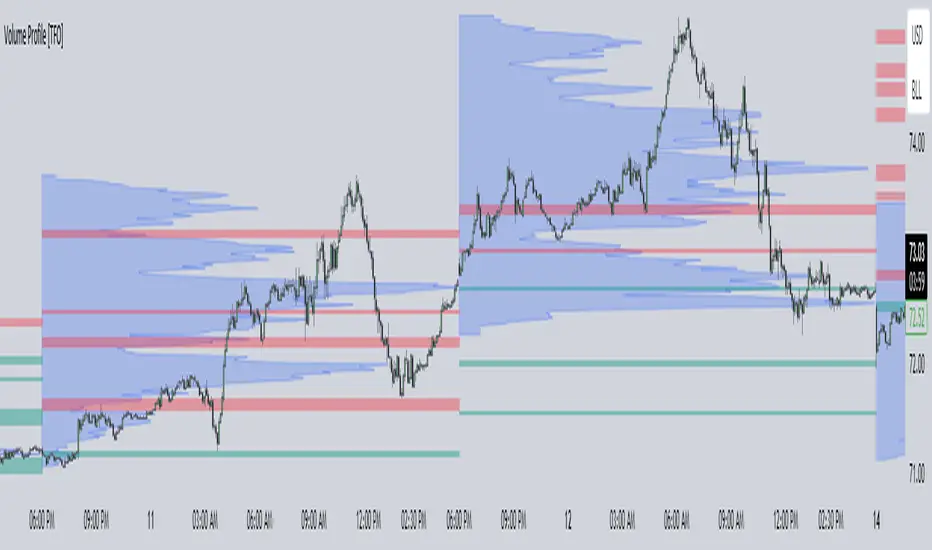
Volume Profile [TFO]This indicator generates Volume Profiles from which to display insights about recent Volume Points of Control and High Volume Nodes. Volume Profile is a way to view trading volume by the price where trades have occurred, rather than the time when they occur (as seen by traditional Volume indicators).
By selecting a Resolution Timeframe (1m in this example), we can aggregate the volume at different prices to build a Volume Profile for a specified Profile Timeframe (1D in this example). In this indicator, we make the simple assumption that a given candle's volume is distributed evenly across all points. Realistically, this is seldom the case, but it gives us a starting point to easily estimate the volume at a given price, in turn helping us to build our profiles in a trivial way.
If we do this for all Resolution Timeframe candles within a Profile Timeframe (all 1m candles in a single 1D candle, in this example), then we can successfully aggregate this data and build a full Volume Profile. And thankfully, Pine Script's new polyline feature ultimately allow us to keep more Volume Profiles on our charts. Before polylines, we would have to consider using lines or boxes to represent the individual levels within a given profile, and each script currently has a cap of 500 lines and boxes, respectively. However, one single polyline can be used to draw the complex shape of an entire profile, and we may show up to 100 polylines in a given script. This helps us keep a lot more data on our charts!
Compared to TradingView's Session Volume Profile indicator (blue/yellow), we can see that our indicator (grey) is nearly identical, which verifies that our assumption of a uniform volume distribution is enough to roughly estimate a given Volume Profile. Note in this example the Row Size was set to 200, meaning that 200 levels are used to approximate profiles from each session's high to its low.
Show VPOC will show the volume point of control of each profile, which represents the price level where the largest amount of volume was traded for a given profile. This is shown with the red lines in the following chart.
Extend Last N VPOCs will look for the most recent, user-defined number of VPOCs (not including the current session's VPOC that's still developing) and extend them to the right of the chart as points of reference. The Show Labels Above option will annotate each VPOC with its respective date above a specified timeframe. This way, if one was using Volume Profiles on intraday timeframes, there wouldn't need to be several date strings all showing the same day.
Show Previous HVNs will show high volume nodes from the previous session. The HVN Strength setting is similar to a "pivot strength" that I use in a lot of my scripts - essentially, HVNs are validated by treating them as local highs. With a HVN Strength of 10 for example, if a given level contains more volume than the 10 levels above and below it, then it is validated as a HVN.
For a cleaner look and feel, HVNs can instead be shown as levels (lines) instead of areas (boxes). With levels enabled, solid lines denote the previous session's VPOC, and dotted lines represent all other HVNs. With areas enabled instead, the tops and bottoms will extend above/below the HVN level until a point with greater volume is discovered (marking the "end" of the node).
This indicator can be computationally intensive and may crash from taking too long to execute. In these cases, it's best to disable unused features, decrease the number of Rows, and/or simply reload the chart until it populates.