[SHORT ONLY] 10 Bar Low Pullback█ STRATEGY DESCRIPTION
The "10 Bar Low Pullback" strategy is a contrarian short trading system designed to capture pullbacks after a new 10‐bar low is made. it identifies a potential short opportunity when the current bar’s low breaks below the lowest low of the previous 10 bars, provided that the bar exhibits strong internal momentum as measured by its IBS value. An optional trend filter further refines entries by requiring that the close is below a 200-period EMA.
█ WHAT IS INTERNAL BAR STRENGTH (IBS)?
Internal Bar Strength (IBS) measures where the closing price falls within the high-low range of a bar. It is calculated as:
ibs = (close - low) / (high - low)
- Low IBS (≤ 0.2): Indicates the close is near the bar's low, suggesting oversold conditions.
- High IBS (≥ 0.8): Indicates the close is near the bar's high, suggesting overbought conditions.
█ SIGNAL GENERATION
1. SHORT ENTRY
A Short Signal is triggered when:
The current bar’s low is below the lowest low of the past X bars (default: 10).
The bar’s IBS is greater than the specified threshold (default: 0.85).
The signal occurs within the defined trading window (between Start Time and End Time).
If the EMA Filter is enabled, the close must be below the 200-period EMA.
2. EXIT CONDITION
An exit Signal is generated when the current close falls below the previous bar’s low (close < low ), indicating a potential bearish reversal and prompting the strategy to close its short position.
█ ADDITIONAL SETTINGS
Lookback Period: Defines the number of bars (default is 10) over which the lowest low is calculated.
IBS Threshold: Sets the minimum required IBS value (default is 0.85) to qualify as a pullback.
Trading Window: Trades are only executed between the user-defined Start Time and End Time.
EMA Filter (Optional): When enabled, short entries are only considered if the current close is below the 200-period EMA, with the EMA period being adjustable (default is 200).
█ PERFORMANCE OVERVIEW
Designed for shorting opportunities, this strategy aims to capture pullbacks following an aggressive 10-bar low break.
It leverages a combination of a lookback low and IBS measurement to identify overextended bullish moves that may revert.
The optional EMA filter helps confirm a bearish market environment by ensuring the price remains under the trend line.
Suitable for use on various assets, including stocks and ETFs, on daily or similar timeframes.
Backtesting and parameter optimization are recommended to tailor the strategy to specific market conditions.
IBS

[SHORT ONLY] Internal Bar Strength (IBS) Mean Reversion Strategy█ STRATEGY DESCRIPTION
The "Internal Bar Strength (IBS) Strategy" is a mean-reversion strategy designed to identify trading opportunities based on the closing price's position within the daily price range. It enters a short position when the IBS indicates overbought conditions and exits when the IBS reaches oversold levels. This strategy is Short-Only and was designed to be used on the Daily timeframe for Stocks and ETFs.
█ WHAT IS INTERNAL BAR STRENGTH (IBS)?
Internal Bar Strength (IBS) measures where the closing price falls within the high-low range of a bar. It is calculated as:
IBS = (Close - Low) / (High - Low)
- Low IBS (≤ 0.2) : Indicates the close is near the bar's low, suggesting oversold conditions.
- High IBS (≥ 0.8) : Indicates the close is near the bar's high, suggesting overbought conditions.
█ SIGNAL GENERATION
1. SHORT ENTRY
A Short Signal is triggered when:
The IBS value rises to or above the Upper Threshold (default: 0.9).
The Closing price is greater than the previous bars High (close>high ).
The signal occurs within the specified time window (between `Start Time` and `End Time`).
2. EXIT CONDITION
An exit Signal is generated when the IBS value drops to or below the Lower Threshold (default: 0.3). This prompts the strategy to exit the position.
█ ADDITIONAL SETTINGS
Upper Threshold: The IBS level at which the strategy enters trades. Default is 0.9.
Lower Threshold: The IBS level at which the strategy exits short positions. Default is 0.3.
Start Time and End Time: The time window during which the strategy is allowed to execute trades.
█ PERFORMANCE OVERVIEW
This strategy is designed for Stocks and ETFs markets and performs best when prices frequently revert to the mean.
The strategy can be optimized further using additional conditions such as using volume or volatility filters.
It is sensitive to extreme IBS values, which help identify potential reversals.
Backtesting results should be analyzed to optimize the Upper/Lower Thresholds for specific instruments and market conditions.

Internal Bar Strength (IBS) Strategy█ STRATEGY DESCRIPTION
The "Internal Bar Strength (IBS) Strategy" is a mean-reversion strategy designed to identify trading opportunities based on the closing price's position within the daily price range. It enters a long position when the IBS indicates oversold conditions and exits when the IBS reaches overbought levels. This strategy was designed to be used on the daily timeframe.
█ WHAT IS INTERNAL BAR STRENGTH (IBS)?
Internal Bar Strength (IBS) measures where the closing price falls within the high-low range of a bar. It is calculated as:
IBS = (Close - Low) / (High - Low)
- **Low IBS (≤ 0.2)**: Indicates the close is near the bar's low, suggesting oversold conditions.
- **High IBS (≥ 0.8)**: Indicates the close is near the bar's high, suggesting overbought conditions.
█ SIGNAL GENERATION
1. LONG ENTRY
A Buy Signal is triggered when:
The IBS value drops below the Lower Threshold (default: 0.2).
The signal occurs within the specified time window (between `Start Time` and `End Time`).
2. EXIT CONDITION
A Sell Signal is generated when the IBS value rises to or above the Upper Threshold (default: 0.8). This prompts the strategy to exit the position.
█ ADDITIONAL SETTINGS
Upper Threshold: The IBS level at which the strategy exits trades. Default is 0.8.
Lower Threshold: The IBS level at which the strategy enters long positions. Default is 0.2.
Start Time and End Time: The time window during which the strategy is allowed to execute trades.
█ PERFORMANCE OVERVIEW
This strategy is designed for ranging markets and performs best when prices frequently revert to the mean.
It is sensitive to extreme IBS values, which help identify potential reversals.
Backtesting results should be analyzed to optimize the Upper/Lower Thresholds for specific instruments and market conditions.

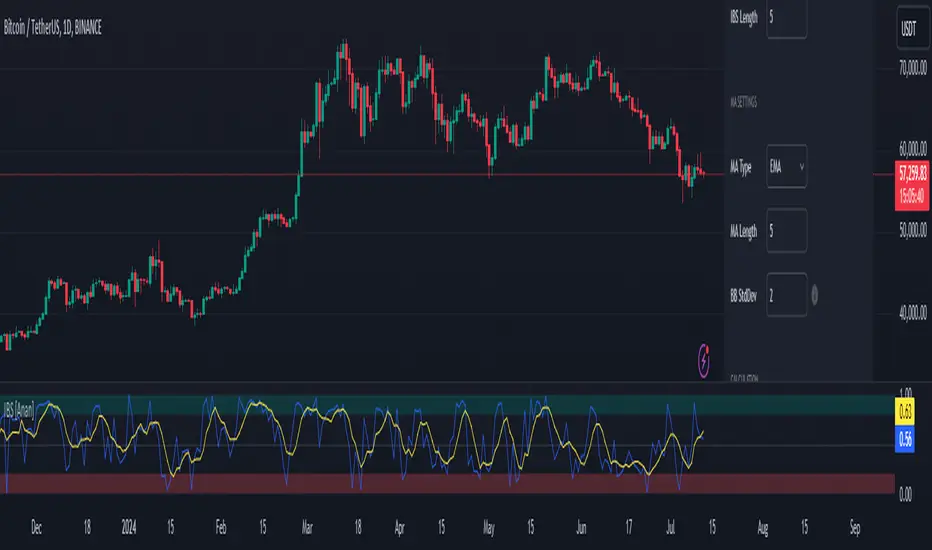
Internal Bar Strength IBS [Anan]This indicator calculates and displays the Internal Bar Strength (IBS) along with its moving average. The IBS is a measure that represents where the closing price is relative to the high-low range of a given period.
█ Main Formula
The core of this indicator is the Internal Bar Strength (IBS) calculation. The basic IBS formula is:
ibs = (close - low) / (high - low)
I enhanced the original formula by incorporating a user-defined length parameter. This modification allows for greater flexibility in analysis and interpretation. The extended version enables users to adjust the indicator's length according to their specific needs or market conditions. Notably, setting the length parameter to 1 reproduces the behavior of the original formula, maintaining backward compatibility while offering expanded functionality:
ibs = (close - ta.lowest(low, ibs_length)) / (ta.highest(high, ibs_length) - ta.lowest(low, ibs_length))
Where:
- `close` is the closing price of the current bar
- `lowest low` is the lowest low price over the specified IBS length
- `highest high` is the highest high price over the specified IBS length
█ Key Features
- Calculates IBS using a user-defined length
- Applies a moving average to the IBS values
- Offers multiple moving average types
- Includes optional Bollinger Bands or Donchian Channel overlays
- Visualizes bull and bear areas
█ Inputs
- IBS Length: The period used for IBS calculation
- MA Type: The type of moving average applied to IBS (options: SMA, EMA, SMMA, WMA, VWMA, Bollinger Bands, Donchian)
- MA Length: The period used for the moving average calculation
- BB StdDev: Standard deviation multiplier for Bollinger Bands
█ How to Use and Interpret
1. IBS Line Interpretation:
- IBS values range from 0 to 1
- Values close to 1 indicate the close was near the high, suggesting a bullish sentiment
- Values close to 0 indicate the close was near the low, suggesting a bearish sentiment
- Values around 0.5 suggest the close was near the middle of the range
2. Overbought/Oversold Conditions:
- IBS values above 0.8 (teal zone) may indicate overbought conditions
- IBS values below 0.2 (red zone) may indicate oversold conditions
- These zones can be used to identify potential reversal points
3. Trend Identification:
- Consistent IBS values above 0.5 may indicate an uptrend
- Consistent IBS values below 0.5 may indicate a downtrend
4. Using Moving Averages:
- The yellow MA line can help smooth out IBS fluctuations
- Crossovers between the IBS and its MA can signal potential trend changes
5. Bollinger Bands/Donchian Channel:
- When enabled, these can provide additional context for overbought/oversold conditions
- IBS touching or exceeding the upper band may indicate overbought conditions
- IBS touching or falling below the lower band may indicate oversold conditions
Remember that no single indicator should be used in isolation. Always combine IBS analysis with other technical indicators, price action analysis, and broader market context for more reliable trading decisions.
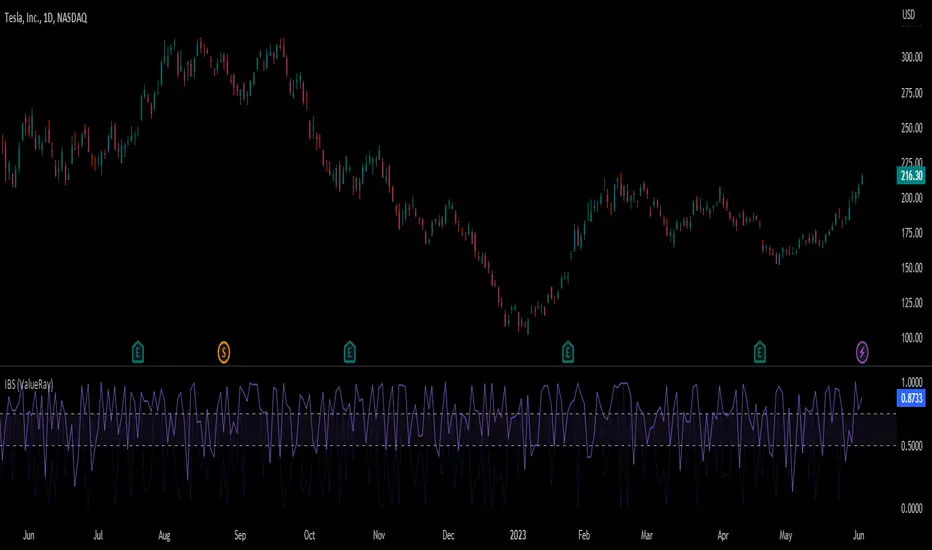
Internal Bar Strength (ValueRay)The IBS (Internal Bar Strength) as we know it, calculates only correctly on the long side. When the candle closes in loss, the original IBS still uses the upper wick.
This IBS checks first if its an up or down candle and then uses the top or bottom wick to calculate the IBS.
The yellow line is the corrected IBS, the blue line the original
Internal Bar Strength IndicatorThe Internal Bar Strength Indicator is pretty basic but very intuitive. Most stocks that close near their high of the day tend to fall the next day and stocks that close near their low tend to rise the next day. This indicator has very similar buy and sell signals as the RSI. Buy when the indicator rises above its signal or if the indicator is in the red zone and rises up outside of the red zone. Sell when the indicator falls below its signal or if the indicator is in the green zone and falls down outside of the green zone.
Let me know if you would like to see other indicators from me!
