Wobbly (Swing) This Script contain ichimoku's Cloud, Kijunsan, Takensan in multi different Time_Frames ( 30', 60', 240', 1D ) as Resistance and Support
It is useful for Swing in time_frames less than 1H
You can easily understand which line related to which time_frame by Width of lines ( Thicker lines shows Higher Time_Frame )
U can also disable the one might not useful for u on Settings
HoPe U aLl EnJoY NeW_YeAr & This ScRiPt
Awan Ichimoku

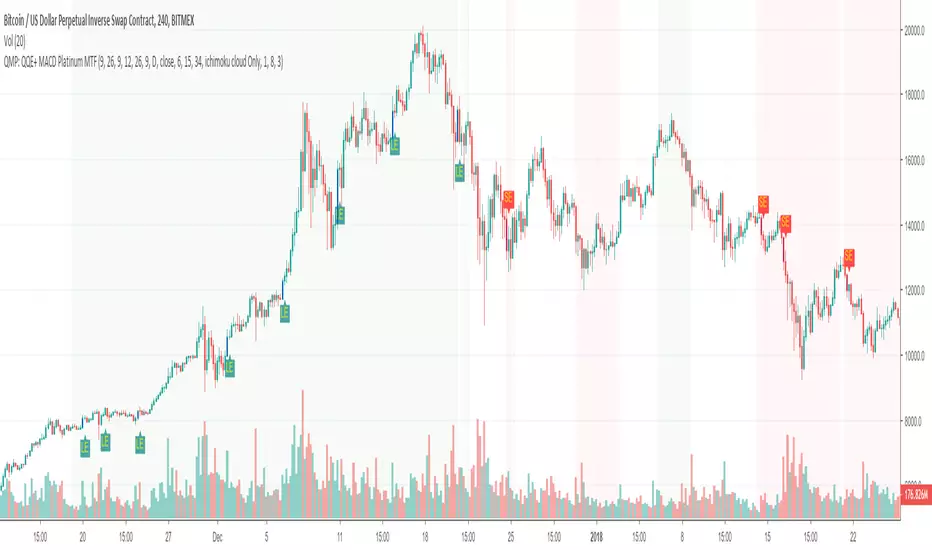
Trend following and reversal strategy for cryptoThe idea of this indicator comes from Jim Brown's book.
using the "MACD Platinum" and "QQE advanced" and multi-timeframe.
The difference to the original idea is that I use Ichimoku cloud for trend detection.


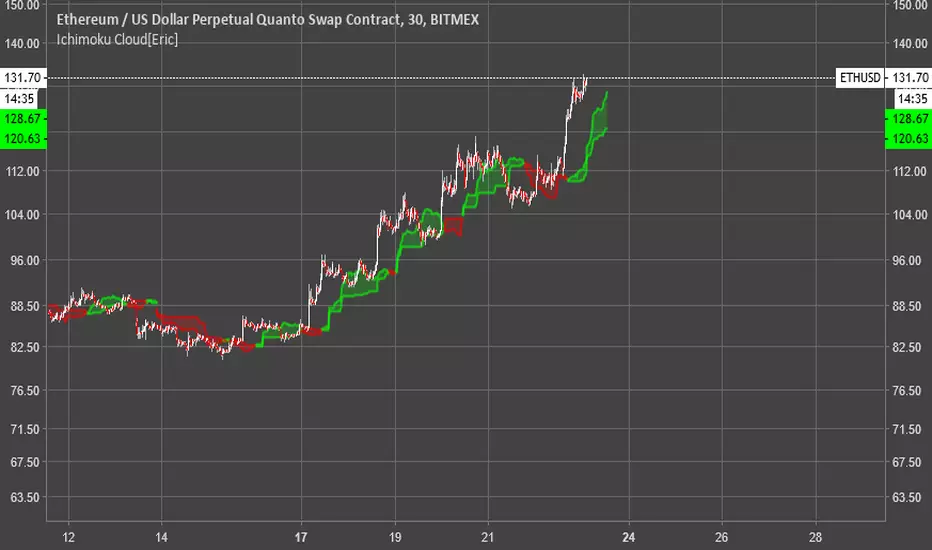
Ichimoku Cloud [Eric]Phase 1: Ichimoku Cloud
Phase 2: Dynamic Ichimoku Cloud
Phase 3: Artificial Intelligence Ichimoku Cloud
Combination Ichimoku CloudThis indicator allows you to display two Ichimoku Cloud settings simultaneously. Each variable can be set independently, including its visibility.
Basically a way to combine two "Ichimoku Cloud" indicators into one slot.

Quad Moving Avarage-Ichimoku Cloud-ALMA-Bollinger BandsAll-in-One
Ingradients:
* Ichimoku Cloud,
* 2 Simple Moving Avarage (SMA),
* 2 Exponential Moving Avarage (EMA),
* 2 Arnoud Legoux Moving Avarage (ALMA),
* Bollinger Bands and
* Volume Based Colored Bars (developed by KIVANÇ fr3762).
Compiled for limitations. Thank you.

Trend Master CryptoFeatures:
Show price trend very clearly.
Mark entry signals on candles.
Getting Started:
Green candle is time to buy or long.
Red candle is time to sell or short.
Set your stoploss around cloud upper or lower ranges.
Contributing:
You can report bugs or issues under this page.
Any advice would be helpful for improving this indicator's accuracy.
Application:
This is an invite only indicator.

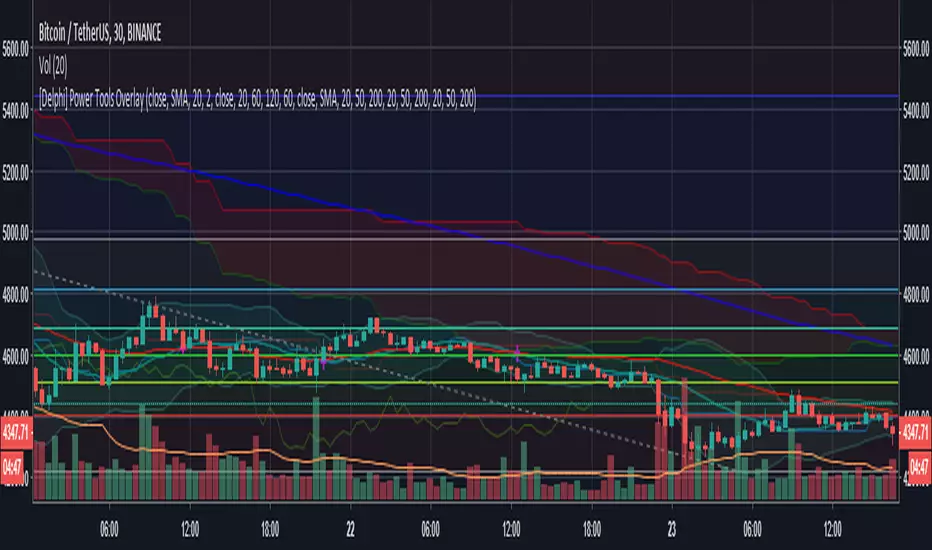
[astropark] Power Tools Overlay//******************************************************************************
// Power Tools Overlay
// Inner Version 1.2 20/12/2018
// Developer: iDelphi
// Developer: astropark (Ichimoku Cloud), SMA EMA & Cross tools
//------------------------------------------------------------------------------
// 21/11/2018 Added EMA SMA WMA
// 21/11/2018 Added SMA-EMA EMA-WMA WMA-SMA (Thanks to mariobros1 for the idea of the Simultaneous MA)
// 21/11/2018 Added Bollinger Bands
// 21/11/2018 Added Ichimoku Cloud (Thanks to astropark for all the code of the Ichimoku Cloud)
// 23/11/2018 Show all the indicator as default
// 23/11/2018 Added a cross when single Moving Averages crossing (Thanks to astropark for the idea)
// 24/11/2018 Descriptions Fix
// 24/11/2018 Added Option to enable/disable all Moving Averages
// 10/12/2018 Added EMAs and Crosses
//******************************************************************************

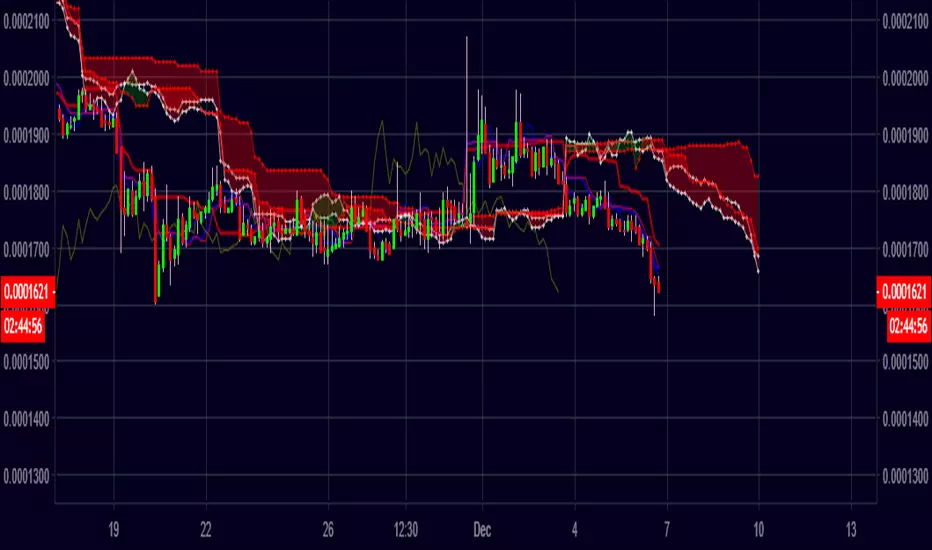
CryptocloudHere's a cloud witn both, original & crypto settings.
I had to make some little tweaks in order to get the cloud accurate.
Works well & has more fun in low timeframes. 3D effect :)


two Ichimoku ITNG
with this indicator you can have 2 ichimoku clouds on chart
first one with chart timeframe
and second one with your choosen timeframe
Enjoy

two Ichimoku ITNG
with this indicator you can have 2 ichimoku clouds on chart
first one with chart timeframe
and second one with your choosen timeframe
Enjoy
CryptologicxThis script includes the following indicators:
Bollinger Bands
SMA 5 10 20 50 100 200
EMA 14 50 55 100 200
HMA 20 / 50
Ichimoku Cloud
The MA have fixed inputs, if you wish to see different you can contact me.

Ichimoku Cloud + 3MASimple combination of Ichimoku and 3 moving averages. You can show/hide the MA's change their types and sources

[Delphi] Power Tools OverlayFEATURE
3EMA 3MA 3WMA 3MA-3EMA 3EMA-3WMA 3WMA-3MA
Bollinger Bands
Ichimoku Cloud
//******************************************************************************
// Power Tools Overlay
// Inner Version 1.0 21/11/2018
// Developer: iDelphi
// Developer: astropark (Ichimoku Cloud)
//------------------------------------------------------------------------------
// 21/11/2018 Added EMA MA WMA
// 21/11/2018 Added MA-EMA EMA-WMA WMA-MA (Thanks to mariobros1 for the idea of the Simultaneous MA)
// 21/11/2018 Added Bollinger Bands
// 21/11/2018 Added Ichimoku Cloud (Thanks to astropark for all the code of the Ichimoku Cloud)
//******************************************************************************
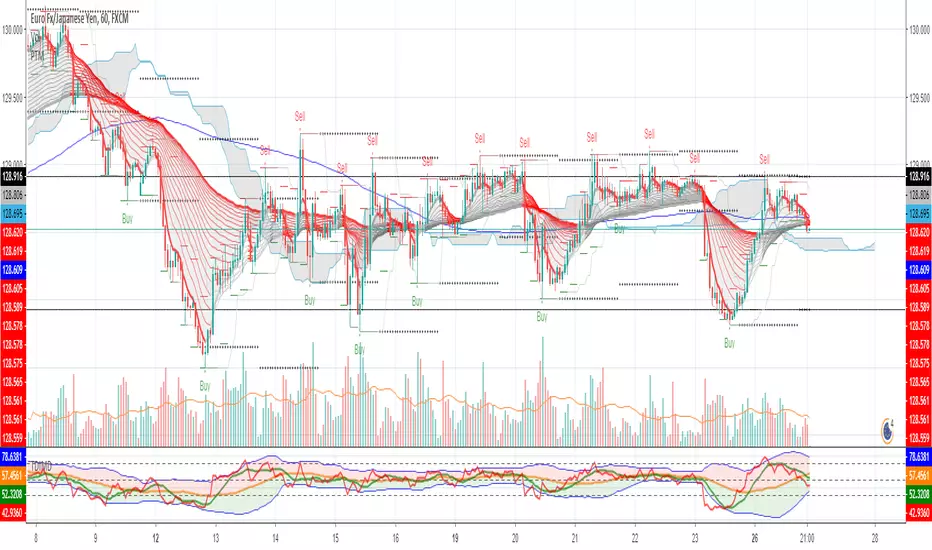
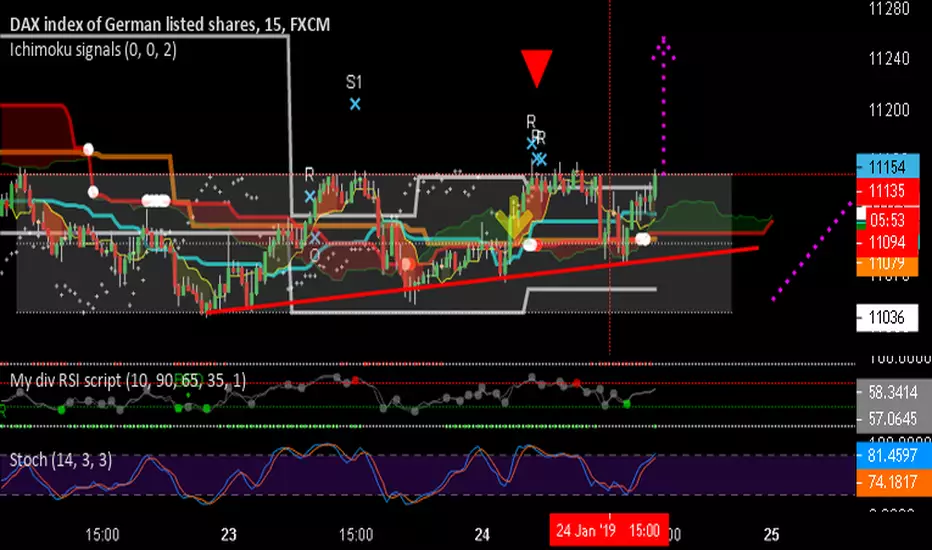
JPCOQ Ichimoku V2INDICATORS:
Show Yellow zone between price and tenkan when oversold/overbought
Show splits : white when to come, yellow when occurs, red when occurs with a flat Senkou Span B, blue when occurs with a flat Senkou Span B and kijun
Show probable range in white lines
Show last higher highs & lower lows in orange lines
SIGNALS (when ichimoku meet candle patterns)
L/H = rebound signals on higher highs / Lower Lows, target can be lower kj flat
C = potential rebound on overbought oversold zone, target can be lower kj flat
R = rebound signal on range edges, target can be last split
B = pullback/throwback rebound after break out of probable range, target can be last higher high (lower low)
K = rebound on Kj in a trend (out of range), target can be last higher high (lower low)
OTHER PARAMETERS
checkHaram = take Harami pattern into account
CheckallCandle = include all candle patterns
checkVol = show "V" when volume is higher than last 9 periods average
showFuture = next kijun/ssa/ssb values in thin lines
closeToChikou = the greater the value close to ichimoku lines is the test
showChikou = red cross on price when close to chikou in TF or upper one
Flatlen = bars of same value to validate an ichimoku flat
CheckSignal1 = check and show upper TF signals => manual check because not perfect, to unset when study error message !!
ShowEntry = green buy signal (red sell) when buy signal and chikou free and ratio >=2
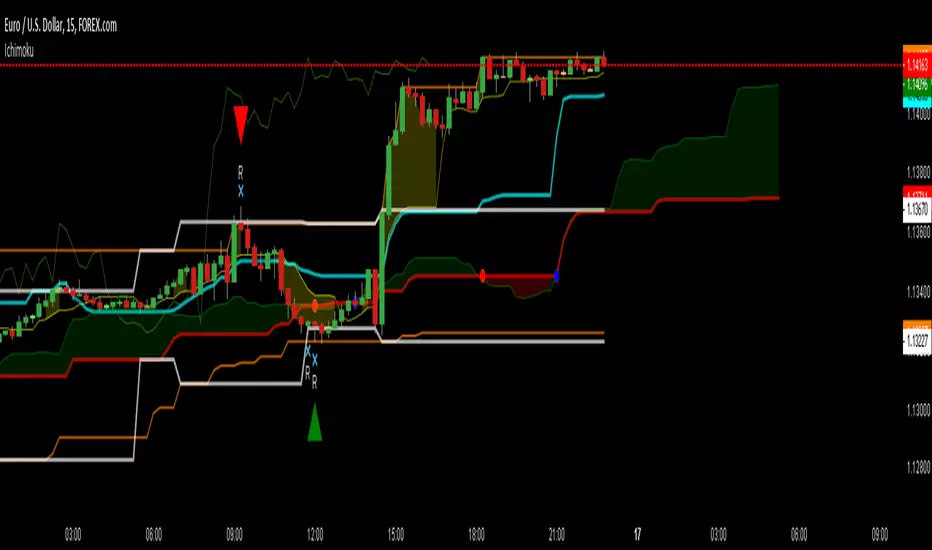
Ichimoku signals by Jean-Philippe COQINDICATORS:
Show Yellow zone when oversold/overbought
Show splits : white when to come, yellow when occurs, red when flat with ssb, blue when flat with ssb and kj
Show probable range when appears in white lines
Show last higher highs lower lows in orange lines
Show probable next Kj values in thin aqua lines
checkChikou = blue diamond on price when close to chikou in TF or upper one
checkVol = show "V" when volume is higher than last 9 periods avg
checkRot = show "Z" when potential partial rotation in range is at work
checkHaram = take Harami pattern into account
SIGNALS (when ichimoku meet candle patterns)
L/H = rebound signals on higher highs / Lower Lows
C = potential rebound on overbought oversold zone
R = rebound signal on range edges
P = pullback rebound after break out of probable range
K = rebound on Kj in a trend (out of range)
ICHIMOKU MTFMultiple Time Frame Version of Ichimoku Kinko Hyo Indicator.
Created in 1940's by Goichi Hosoda withe the help of University students in Japan.
Ichimoku is one of the best trend following indicators that works nearly perfect in all markets and time frames.
Ichimoku is originally an built in indicator in Tradingview but there are some problems like:
the indicator hast 5 lines but you can change only 4 parameters in the settings menu of Tradingview Charts which you could only control 3 of the lines effectively. A second problem is that Tradingview preferred to use English titles for the ICHIMOKU lines instead of giving them the most common original Japanese ones. (So I rewrite the indicator)
Kijun Sen (blue line): Also called standard line or base line, this is calculated by averaging the highest high and the lowest low for the past 26 periods.
Tenkan Sen (red line): This is also known as the turning line and is derived by averaging the highest high and the lowest low for the past nine periods.
Chikou Span (Plum line): This is called the lagging line. It is today’s closing price plotted 26 periods behind.
Senkou SpanA (green line): The first Senkou line is calculated by averaging the Tenkan Sen and the Kijun Sen and plotted 26 periods ahead.
Senkou SpanB (purple line):
The second Senkou line is determined by averaging the highest high and the lowest low for the past 52 periods and plotted 26 periods ahead.
PERSONALLY I ADVISE YOU TO USE ICHIMOKU WITH DEAFULT LENGTHS (9,26,26,52,26) IN ORDER FOR STOCK MARKETS AND FOREX MARKETS
FOR CRYPTO YOU'D BETTER USE:
10,30,30,60,30 OR 20,60,60,120,60
THE TRICKY THING IS THAT KEEPING THE 1-3-3-6-3 RATIO CONSTANT IS NECESSARY
Here's a link of my Youtube video explaining ICHIMOKU but unfortunately only in TURKISH:
www.youtube.com
Developed by: Goichi Hosoda
Here's the link to a complete list of all my indicators:
tr.tradingview.com
Ichimoku kullanımı anlattığım detaylı video serisini linkten izleyebilirsiniz:
www.youtube.com
İndikatörü geliştiren: Goichi Hosoda

SSABU MTF Ichimoku Cloud✅ MTF Ichimoku Cloud (multi-time frame Ichimoku cloud) is an indicator.
This indicator is a supplementary indicator for viewing the cloud profile of a high-frame burst in a low-frame burst.
If you set the indicator instead of entering the time directly, you can set 1/3/5/13/30/45 minutes 1/2/3 / hour 1 day 1 day in Cloud MTF Set (Minute).
The default setting is 4H.
The screenshot above shows the Ichimoku Cloud with a 4-hour bar on a 15-minute chart.
Clouds of 4 hours seen from 15 minutes of sky blue, cloud of 15 minutes of blue
✅ MTF Ichimoku Cloud (멀티 타임 프레임 이치모쿠 클라우드) 지표입니다.
본 지표는 낮은 프레임의 분봉에서 높은 프레임의 분봉의 구름대 모습을 볼 수 있는 보조지표 입니다.
직접 시간을 입력 하는 건 아니고 지표를 설치하시면 Cloud MTF Set(Minute)에서 1/3/5/13/30/45분 1/2/3/시간 1일 1주로 설정이 가능합니다.
기본설정은 4H으로 되어있습니다.
위의 스크린샷은 15분봉의 차트에서 4시간봉의 Ichimoku Cloud를 적용한 모습입니다.
하늘색이 15분봉에서 보는 4시간봉의 구름, 파란색이 15분봉에 해당하는 구름
✅ Other indicators to help you trade
✅ 매매에 도움되는 다른 보조지표
Basel major 2.2


OBV-Ts-Ks [by: Bijan Ajdary]This indicator adds Tenkansen and 3 types of Kijunsen to the OBV chart And making it highly efficient for professional traders.
Written based on the teachings of dear Chris
