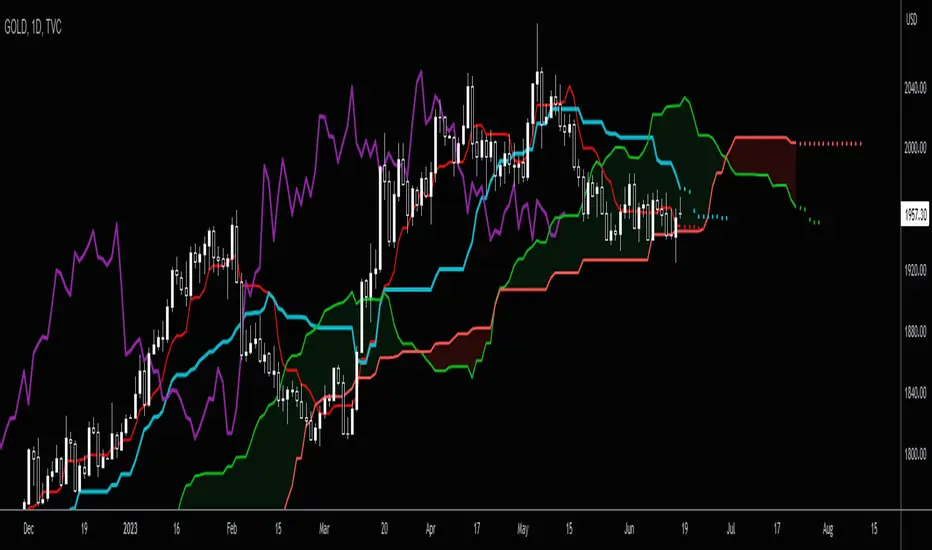
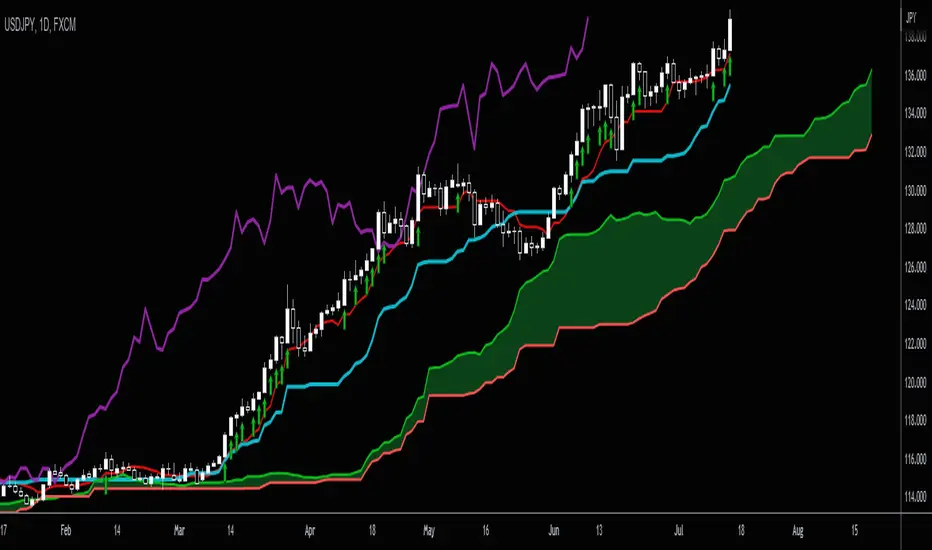
3SMA + Ichimoku 2leadlineThis indicator simultaneously displays two lines, which are the leading spans of the Ichimoku Kinko Hyo, and three simple moving averages.
To make it easier to distinguish between the simple moving average line and the line of the Ichimoku Kinko Hyo, the simple moving average line is set to level 2 thickness by default.
Also, the color of Reading Span 1 in the Ichimoku Kinko Hyo has been changed from green to lime to improve color visibility.
I (author of this indicator) use this indicator especially as a simple perspective on the cryptocurrency BTC / USD(USDT).
If this indicator is a problem, moderators don't know about tradingview beginners.
" Visibility " should be a high-priority item not only for indicators but also for graph requirements.
Visibility is one of the most important factors for investors who have to make instant decisions in one minute and one second.
The purpose of this indicator is to display two leading spans that are easily noticed in the Ichimoku cloud and three simple moving averages whose set values can be changed.
This is because chart analysis often uses a combination of a simple moving average of three periods and two lead spans of the Ichimoku cloud.
Also, in chart analysis, green is often displayed with the same thickness on both the moving average line and the Ichimoku cloud.
Therefore, if the moving average line and the Ichimoku cloud often use the same green color, the visibility will drop. Therefore, the green color of Ichimoku cloud was changed to lime color by default.
Tradingview beginners often refer only to the two lines of the leading span of Ichimoku Cloud. Therefore, we decided not to draw lines that are difficult to use.
Many Tradingview beginners don't know that you can change the thickness of the indicator .
Therefore, this indicator shows by DEFAULT the three commonly used simple moving averages that are thickened by one step at the same time.
Also, since the same green color is often used for the Ichimoku cloud and the moving average line, the green color of the preceding span of the Ichimoku cloud is changed to lime color by default.
The originality of this indicator is that it enhances " visibility " so that novice tradingview users will not be confused on the chart screen.
The lines other than the preceding span of the Ichimoku cloud are not displayed, and the moving average line is level 2 thick so that the user can easily see it.
This indicator not only combines a simple moving average and Ichimoku cloud, but also improves "visibility" by not incorporating lines that are difficult to see from the beginning and making it only the minimum display, making it easy for beginners to understand. The purpose is to do.
If any of the other TradingView indicators already meet the following, acknowledge that this indicator is not original.
・Display 3 simple moving averages at the same time
・For visibility, the thickness of the simple moving average line is set to level 2 from the beginning.
・A setting that does not dare to draw lines other than the lead span of Ichimoku cloud.
・Make the moving average line and the Ichimoku cloud line different colors and thicknesses from the beginning.
Awan Ichimoku

Ichimoku Kinkō HyōThe Ichimoku Kinko Hyo is an trading system developed by the late Goichi Hosoda (pen name "Ichimokusanjin") when he was the general manager of the business conditions department of Miyako Shinbun, the predecessor of the Tokyo Shimbun. Currently, it is a registered trademark of Economic Fluctuation Research Institute Co., Ltd., which is run by the bereaved family of Hosoda as a private research institute.
The Ichimoku Kinko Hyo is composed of time theory, price range theory (target price theory) and wave movement theory. Ichimoku means "At One Glace". The equilibrium table is famous for its span, but the first in the equilibrium table is the time relationship.
In the theory of time, the change date is the day after the number of periods classified into the basic numerical value such as 9, 17, 26, etc., the equal numerical value that takes the number of periods of the past wave motion, and the habit numerical value that appears for each issue is there. The market is based on the idea that the buying and selling equilibrium will move in the wrong direction. Another feature is that time is emphasized in order to estimate when changes will occur.
In the price range theory, there are E・V・N・NT calculated values and multiple values of 4 to 8E as target values. In addition, in order to determine the momentum and direction of the market, we will consider other price ranges and ying and yang numbers.
If the calculated value is realized on the change date calculated by each numerical value, the market price is likely to reverse.
転換線 (Tenkansen) (Conversion Line) = (highest price in the past 9 periods + lowest price) ÷ 2
基準線 (Kijunsen) (Base Line) = (highest price in the past 26 periods + lowest price) ÷ 2
It represents Support/Resistance for 16 bars. It is a 50% Fibonacci Retracement. The Kijun sen is knows as the "container" of the trend. It is prefect to use as an initial stop and/or trailing stop.
先行スパン1 (Senkou span 1) (Lagging Span 1) = {(conversion value + reference value) ÷ 2} 25 periods ahead (26 periods ahead including the current day, that is)
先行スパン2 (Senkou span 2) (Lagging Span 2) = {(highest price in the past 52 periods + lowest price) ÷ 2} 25 periods ahead (26 periods ahead including the current day, that is)
遅行スパン (Chikou span) (Lagging Span) = (current candle closing price) plotted 26 periods before (that is, including the current day) 25 periods ago
It is the only Ichimoku indicator that uses the closing price. It is used for momentum of the trend.
The area surrounded by the two lagging span lines is called a cloud. This is the foundation of the system. It determines the sentiment (Bull/Bear) for the insrument. If price is above the cloud, the instrument is bullish. If price is below the cloud, the instrument is bearish.
-
The wave theory of the Ichimoku Kinko Hyo has the following waves.
All about the rising market. If it is the falling market, the opposite is true.
I wave rise one market price.
V wave the market price that raises and lowers.
N wave the market price for raising, lowering, and raising.
P wave the high price depreciates and the low price rises with the passage of time. Leave either.
Y wave the high price rises and the low price falls with the passage of time. Leave either.
S wave A market in which the lowered market rebounds and rises at the previous high level.
There are the above 6 types but the basis of the Ichimoku Kinko Hyo is the N wave of 3 waves.
In Elliott wave theory and similar theories, basically there are 5 waves but 5 waves are a series of 2 and 3 waves N, 3 for 7 waves, 4 for 9 waves and so on.
Even if it keep continuing, it will be based on N wave. In addition, since the P wave and the Y wave are separated from each other, they can be seen as N waves from a large perspective.
-
There are basic E・V・N・NT calculated values and several other calculation methods for the Ichimoku Kinko Hyo. It is the only calculated value that gives a concrete value in the Ichimoku Kinko Hyo, which is difficult to understand, but since we focus only on the price difference and do not consider the supply and demand, it is forbidden to stick to the calculated value alone.
(The calculation method of the following five calculated values is based on the rising market price, which is raised from the low price A to the high price B and lowered from the high price B to the low price C. Therefore, the low price C is higher than the low price A)
E calculated value The amount of increase from the low price A to the high price B is added to the high price B. = B + (BA)
V calculated value Adds the amount of decline from the high price B to the low price C to the high price B. = B + (BC)
N calculated value The amount of increase from the low price A to the high price B is added to the low price C. = C + (BA)
NT calculated value Adds the amount of increase from the low price A to the low price C to the low price C. = C + (CA)
4E calculated value (four-layer double / quadruple value) Adds three times the amount of increase from the low price A to the high price B to the high price B. = B + 3 × (BA)
Calculated value of P wave The upper price is devalued and the lower price is rounded up, and the price range of both is the same.
Calculated value of Y wave The upper price is rounded up and the lower price is rounded down, and the price range of both is the same.

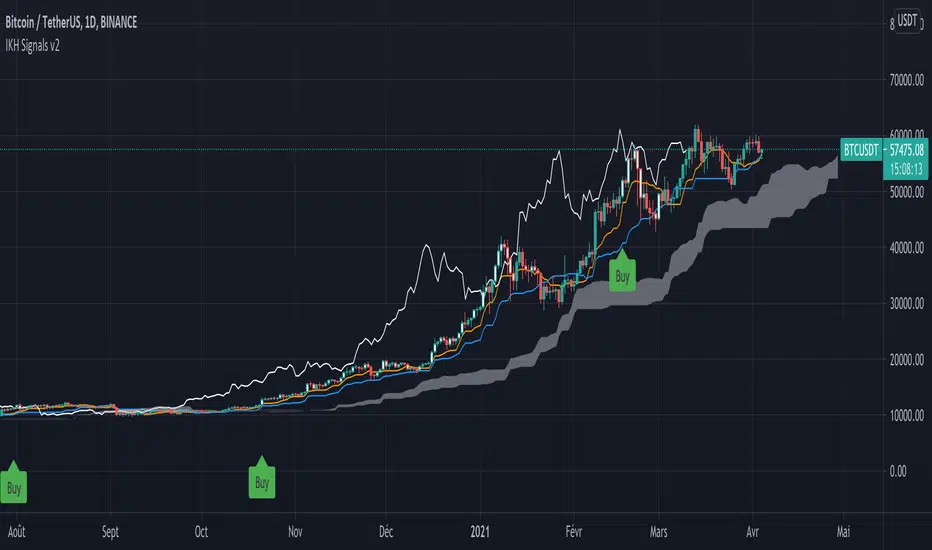
IKH Signals v2Hi,
I'm happy to release this new update after few weeks working.
Fixes
Fix kumo break-out of Chiku span and close price
Fix buy trigger and strong buy trigger
Improvement
Signals take now the kumo thickness and kumo angle
Signals does not trigger on doji candles
Multi time frame validation is now available
I hope this fixes and new features will improve the signals for you too.
Let me know if you find strange behavior or possible improvments.
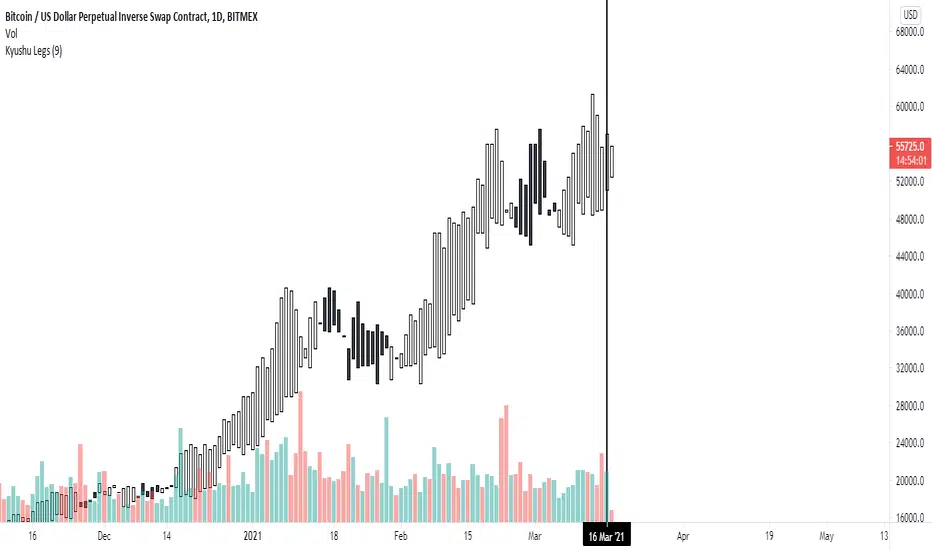
Kyushu LegsKyushu Legs is part of the Ichimoku strategy. Kyushu Legs shows new candle bars which help to find a change of trend.
Legs Kyushu is created every candle based on close 9 candles before the actual open candle. Also, there is a possibility of changing the settings of counting the Legs Kyushu.
Colors change based on trend: the white candles show that the market is bullish, black candles that the market is bearish.
source of the code:
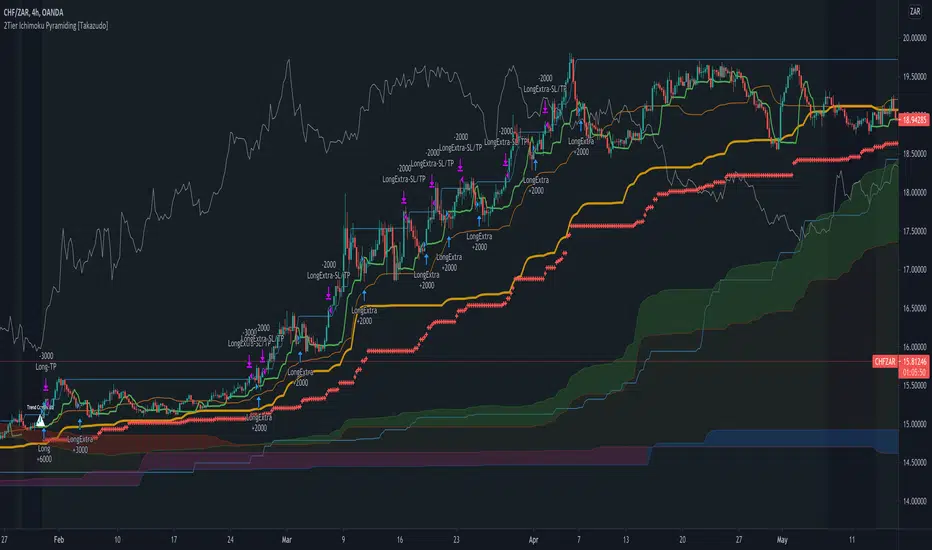
2Tier Ichimoku Pyramiding [Takazudo]Ichimoku based pyramiding strategy example that was tested on 4h TF.
makes the first entry when 2Tier Kumo breakout was occurred.
makes the extra entries when higher-low (on long) or lower-high (on short) was occurred.
uses short term MACD reversal + stop entry as a confirmation of the trend.
slack trailing stop loss.
changes entry quantity by the percentage of SL.
prevents the ranged entry.
This is just an example of how to trade using Ichimoku signals.
Ichimoku + 2 base linesIchimoku + 2 base line
This indicator is a combination of Ichimoku cloud indicator with two base lines.
The first base line is the same as the Ichimoku default settings but the baseline 2 indicates an average of 108 candles in the past and it acts as a strong support and resistance level.
How to use this indicator?
You can use this indicator to see if a break out is true or is a false break. For example if the price broke up the Ichimoku cloud and base line 2 is above the price, it will probably react to that area but if it's below the price, it is a good opportunity to buy. (for sell/short position it is in the opposite way the base line 2 should be above the price)
If you want to trade in support zones base line 2 (108) is a very good area that you can wait for a good candlestick pattern to enter a position.
Caution: before using this indicator please back test it and if the results were good enough, use it as a confirmation.

Multi Timeframe Silent IchimokuMulti Timeframe Silent Ichimoku
Is an upgrade on my previous Silent Ichimoku indicator witch attempts to filter out the noise from the Ichimoku indicator By only coloring the bars
Green if the Ichimoku spots an uptrend
Red if Ichimoku spots a downtrend
And Gray if Ichimoku spots consolidation
This Indicator adds the ability to filter out some bad signals by taking the Ichimoku from the higher time frame into consideration and providing a visual back test
Huge shout out to fareidzulkifli for the Quick Backtest Framework Awesome tool to add to your framework


Silent IchimokuSilent Ichimoku
attempts to filter out the noise from the Ichimoku indicator By only coloring the bars
Green if the Ichimoku spots an uptrend
Red if Ichimoku spots a downtrend
And Gray if Ichimoku spots consolidation

Ichimoku Strategy [CDI]Strategy used in the CDI community that consists of having as a signal to enter long when it crosses the entire Ichimoku cloud .
It is recommended to use the strategy in one hour candles and the profit / loss ratio is 2 to 1 for swing trading, however it can be used at any time frame.
The purpose is to perform a bakctesting quickly by setting the limit and stop in the study settings (Proffit and Loss). It is also possible to deactivate the trades on chart changing the configuration in the settings pannel to visualize more clearly the yellow candles that are marked on the chart to identify the signal of the strategy.
Strategy settings:
- Profit %: approximate profit on each entry
- Loss %: approximate loss limit in each entry
- Crossing Candles: number of candles that establishes the crossing of the Ichimoku clouds
Alerts can be configured.
For more information about the strategy, you can search on YouTube for Hyenuk Chu's video "Cómo construir una buena tasa Riesgo Beneficio"
WARNING:
- For purpose educate only
- The entries are used under your responsibility

Ichimoku LiteIchimoku Kinko Hyo (often called Ichimoku Cloud) is a technical analysis method and trading system developed by Hosoda Goichi in 1935 and first published in 1975 under the pen-name Ichimoku Sanjin. The indicator shows the overall market state and reveals the equilibrium point of the price movement. The key idea of developing this indicator is to know the presence of the market. However, most of the default setting of this indicator is difficult to its elaborate visual presentation. Here, I modify the indicator by removing the lagging span and applying a lower color contrast of the cloud. This indicator can be combined with the turbulence indicator to provide a better confirmation of breakout signals.

MTF Ichimoku Signal [Takazudo]A multi timeframe Ichimoku Signal indicator. This indicator shows the status of each Ichimoku Signals.
1. TK-Cross
Tenkan-Sen & Kijun-Sen cross status
2. Future Kumo
The newest Kumo color
3. Kumo & Current Relation
The relation between current price & Kumo.
4. Kumo & Chikou-Span Relation
The relation between Kumo & Chikou-Span.
5. Chikou-Span & Candle Cross
Chikou-Span & Candle cross status

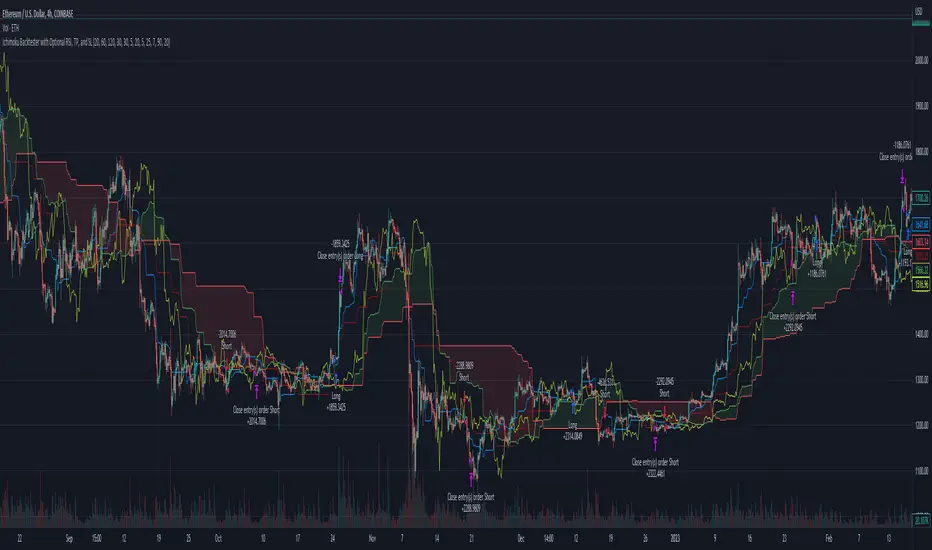
Ichimoku Backtester with TP, SL, and Cloud Confirmation OptionStarted with the Basic Ichimoku strategy from Mizuki32. Added Take Profit, Stop Loss (for both long and short), and a toggle to wait for confirmation from the cloud.
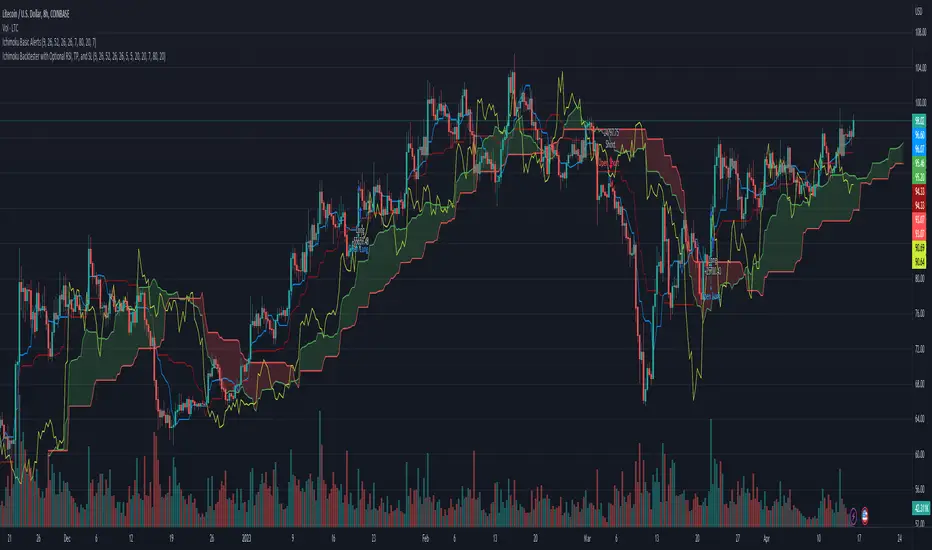
Ichimoku Basic AlertsStarted with Ichimoku Kinko Hyo by Mizuki32. Converted to study and added alerting and cloud confirmation.
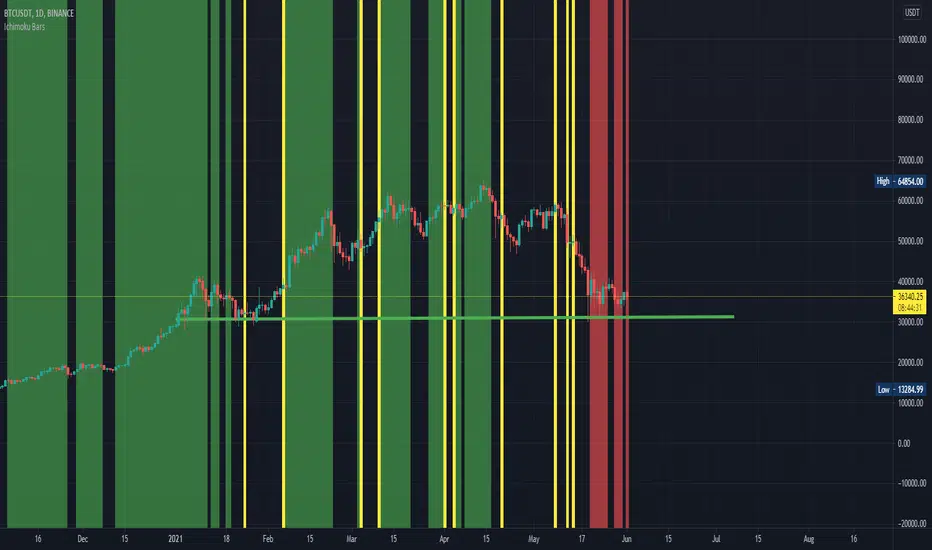
Ichimoku BarsThis script follows off the principles of the Ichimoku Cloud indicator. The green zones display optimal time to buy according to the Ichimoku model. The red zones show optimal time to sell according to the Ichimoku model inverse. The yellow zones show where the conversion line meets the base line (potential up or down movement at this point). Feel free to contact me to fix any problems or add additional info.
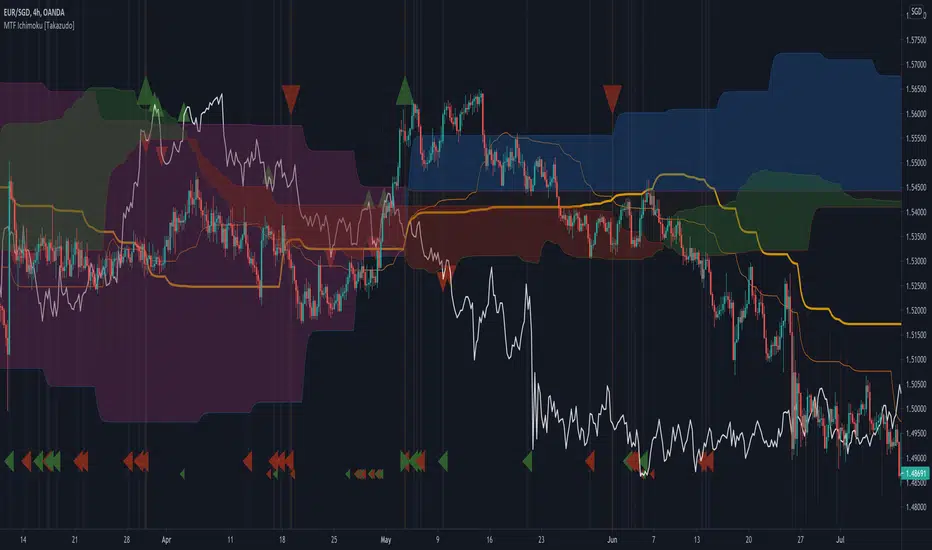
MTF Ichimoku [Takazudo]- A multi time frame Ichimoku with messy hint highlights.
- Most of MTF Ichimoku scripts doesn't handle Chikou-span's place correctly. This script does.
- This script was made to refer the 1day timeframe Ichimoku in lower timeframes.
- I use 1day timeframe mainly. But my entry is always in 4h or 1h timeframe.
OANDA:USDJPY
LAGging span leaves Bollinger Bands strategyAbstract
This script points out the positions a lagging span leaves a Bollinger Band.
This script does not plot a lagging span but moves the Bollinger Band forward.
You can find profit opportunities by combining this script and risk management.
Introduction
Bollinger Bands is a popular indicator.
It contains a moving average, an upper band and a lower band.
The moving average can indicate trend, the upper band and the lower band can indicate if the price is far away from the moving average.
However, in trading markets, anything can happen.
Both continuation and reversal are possible when the price touches the moving average, the upper band or the lower band.
Therefore, many traders adjust the parameters of the Bollinder Band or add other indicators to improve their trading strategies.
@Daveatt et. al. provided an idea that uses a lagging span.
A lagging span is a line chart. It displays the reference price but in earlier time.
For example, if the offset of a lagging span is 26 days, the value of the lagging span on 29 days ago is the reference price 3 days ago.
A lagging span is a part of Ichimoku Cloud.
It can compare the price to the earlier price and the values of indicators in the past.
To compare the price to the values of indicators in the past, we can also shift indicators forward instead of adding a lagging span into the chart.
This script uses shift-the-indicators-forward method.
In other words, this script plots the Bollinger Band forward so that the price can be compared to the values of the Bollinger Band in the past.
Computing and Adjusting
(1) Compute Moving Average
(2) Compute Standard Derivation
(3) Upper Band = Moving Average + Standard Derivation * Multi
(4) Lower Band = Moving Average - Standard Derivation * Multi
(5) Shift the Bollinger Band forward according to the offset parameter.
(6) Mark the points the price leaves the shifted Bollinger Band
(7) Compute the most possible loss and profit before the next opposite signal.
Parameters
source : the data for computing the bollinger band. can be open, high, low, close or their combination.
length : how many days are calculated by the bollinger band
mult : the distance from the moving average to the upper band and the distance from the moving average to the upper band is equal to ( mult * standard derivation ) .
x_offset : the offset of the lagging span
Conclusion
This script can find signals for potential breakout or trend continuation.
If you want to use this signal well, you need to know when to cut loss and protect the profit.
Reference
@Daveatt , Bollinger bands/Lagging span cross , BGyrPgOA , Tradingview 2019
How to trade with Bollinger Bands
How to use Ichimoku Cloud
How to trade with a line chart

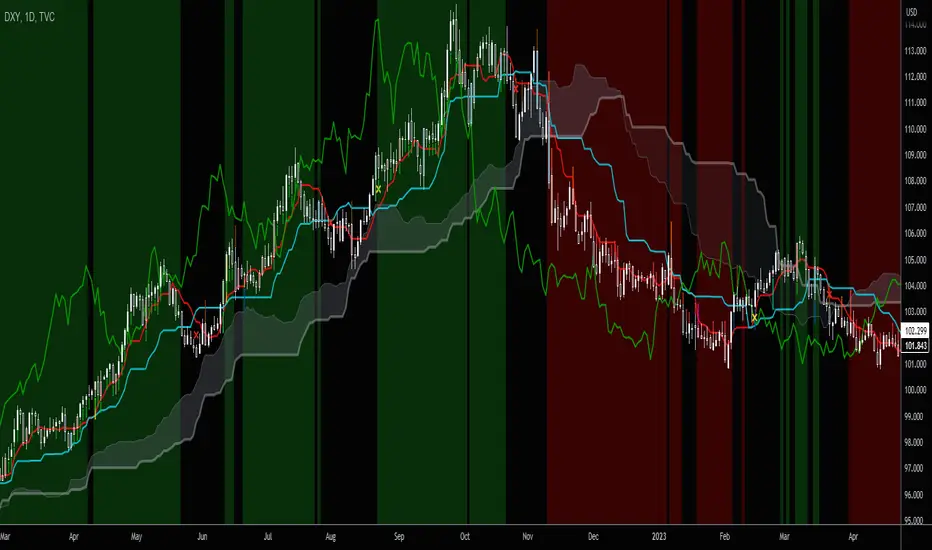
Ichimoku Trend DirectionThis script will help you detect the current trend of market use Ichimoku trading system. We use the default parameters.
To reduce risk, ONLY trade follow the trend of high time frame!
Very simple to use:
- Green background when market Up trend
- Red background when market Down trend
Have a nice trade! :P
Future Ichimoku LinesFuture Ichimoku Lines Plot: Tenkan-sen next 5 days, Kijun-sen next 10 days, Kumo A next 5 days and Kumo B next 14 days will be display
This will help you forecast the future of price and increase winning probability!
Always remember, risk management is the key of a successful trader
Have a nice trade! :D
Ichimoku Line CounterThis simple script will help you seen the range of Kijun-sen, Tenkan-sen and Senkou span B. You can use it to analyze the direction of Ichimoku components. Very useful for Ichimoku trader!
Example: how many days Kijun, Kumo, ... still flat or become flat?
We use the default number: 9, 26 and 52. You absolutely can modify it if your system use different numbers :P
Have a nice trade! :D
Simple Ichimoku Signal v1Simple Ichimoku Signal v1 - Use Original Japanese Ichimoku System
You can set alert to get notify on your phone when the signals appear:
- BUY signal (green arrow): when all lines of Ichimoku system have bullish
- SELL signal (red arrow): when all lines of Ichimoku system have bearish
Very easy to use for everyone expecially people who has less time for trading. Simple but very effective!
Please remember: all trading system can be right/wrong so the risk management is super important!
Good luck!
Ichimoku Crypto LONG 3h ANY CRYPTO PairThis is a strategy which works with most of the crypto pairs on the 3H time frames.
It beats easily on the long term buy and hold strategy.
This strategy is made from the baseline from ichimoku together with ema 200
This is a long only strategy.
THe condition is : our candle is above ema 200 and our ichimoku its telling we have a long trend. We exit on the opposite signal.
If you have any questions private message me !

Ichimoku Kinko Hyo SignalsIchimoku Kinko Hyo Signals
This script show signals based on my understanding in Ichimoku Kinko Hyo.
/!\ Please do not follow signals blindly and always make your own analysis /!\
Buy : Han Ne lines are up, price is up, and also stochastic (K=30, D=10) is up
Strong Buy : Is a Sanyaku Kouten and can show a potential reverse in current tendance and Buy Signal conditions
Sell : Han Ne lines are down, price is down, and also stochastic (K=30, D=10) is down
Strong Sell : Is a Sanyaku Gyakuten and can show a potential reverse in current tendance and Sell Signal conditions
Exit : Show a potential time to take profit based on previous Sell, Strong Sell, Buy, or Strong Buy signal
