One for AllOne for All (OFA) - Complete ICT Analysis Suite
Version 3.3.0 by theCodeman
📊 Overview
One for All (OFA) is a comprehensive TradingView indicator designed for traders who follow Inner Circle Trader (ICT) concepts. This all-in-one tool combines essential ICT analysis features—sessions, kill zones, previous period levels, and higher timeframe candles with Fair Value Gaps (FVGs) and Volume Imbalances (VIs)—into a single, highly customizable indicator. Whether you're a beginner learning ICT concepts or an experienced trader refining your edge, OFA provides the visual structure needed for precise market analysis and execution.
✨ Key Features
- 🏷️ Customizable Watermark**: Display your trading identity with customizable titles, subtitles, symbol info, and full style control
- 🌍 Trading Sessions**: Visualize Asian, London, and New York sessions with high/low lines, range boxes, and open/close markers
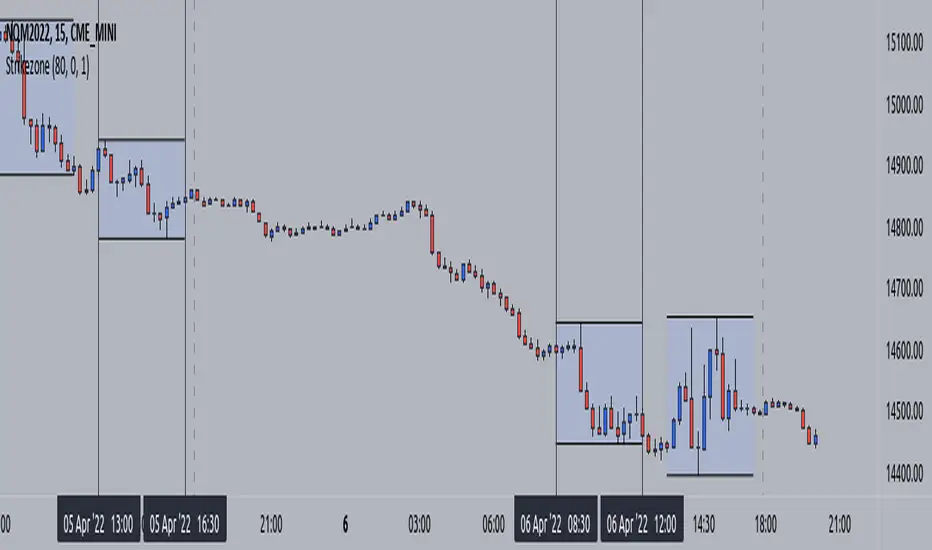
- 🎯 Kill Zones**: Highlight 5 critical ICT kill zones with precise timing and visual boxes
- 📈 Previous Period H/L**: Track Daily, Weekly, and Monthly highs/lows with customizable styles and lookback periods
- 🕐 Higher Timeframe Candles**: Display up to 5 HTF timeframes with OHLC trace lines, timers, and interval labels
- 🔍 FVG & VI Detection**: Automatically detect and visualize Fair Value Gaps and Volume Imbalances on HTF candles
- ⚙️ Universal Timezone Support**: Works globally with GMT-12 to GMT+14 timezone selection
- 🎨 Full Customization**: Control colors, styles, visibility, and layout for every feature
🚀 How to Use
Watermark Setup
The watermark overlay helps you identify your charts and maintain focus on your trading principles:
1. Enable/disable watermark via "Show Watermark" toggle
2. Customize the title (default: "Name") to display your trading name or account identifier
3. Set up to 3 subtitles (default: "Patience", "Confidence", "Execution") as trading reminders
4. Choose position (9 locations available), size, color, and transparency
5. Toggle symbol and timeframe display as needed
Use Case: Display your trading principles or account name for multi-monitor setups or content creation.
Trading Sessions Analysis
Sessions define market character and liquidity availability:
1. Enable "Show All Sessions" to visualize all three sessions
2. Adjust timezone to match your local market (default: UTC-5 for EST)
3. Customize session times if needed (defaults cover standard hours)
4. Enable session range boxes to see consolidation zones
5. Use session high/low lines to identify key levels for the current session
6. Enable open/close markers to track session transitions
Use Case: Identify which session you're trading in, track session highs/lows for liquidity, and anticipate session transition volatility.
Kill Zones Trading
Kill zones are ICT's high-probability trading windows:
1. Enable individual kill zones or use "Show All Kill Zones"
2. **Asian Kill Zone** (2000-0000 GMT): Early positioning and smart money accumulation
3. **London Kill Zone** (0300-0500 GMT): European market opening volatility
4. **NY AM Kill Zone** (0930-1100 EST): Post-NYSE open expansion
5. **NY Lunch Kill Zone** (1200-1300 EST): Midday consolidation or manipulation
6. **NY PM Kill Zone** (1330-1600 EST): Afternoon positioning and closes
7. Customize colors and times to match your trading style
8. Set max days display to control historical visibility (default: 30 days)
Use Case: Focus entries during high-probability windows. Watch for liquidity sweeps at kill zone openings and institutional positioning.
Previous Period High/Low Levels
Previous period levels act as magnetic price targets and support/resistance:
1. Enable Daily (PDH/PDL), Weekly (PWH/PWL), or Monthly (PMH/PML) levels individually
2. Set lookback period (how many previous periods to display)
3. Choose line style: Solid (current emphasis), Dashed (standard), or Dotted (subtle)
4. Customize colors per timeframe for visual hierarchy
5. Adjust line width (1-5) for visibility preference
6. Enable gradient effect to fade older periods
7. Position labels left or right based on chart layout
8. Customize label text for your preferred notation
Use Case: Identify key levels where price is likely to react. Daily levels work on intraday timeframes, Weekly on daily charts, Monthly for swing trading.
Higher Timeframe (HTF) Candles
HTF candles reveal the larger market context while trading lower timeframes:
1. Enable up to 5 HTF slots simultaneously (default: 5m, 15m, 1H, 4H, Daily)
2. Choose display mode: "Below Chart" (stacked rows) or "Right Side" (compact column)
3. Customize timeframe, colors (bull/bear), and titles for each slot
4. **OHLC Trace Lines**: Visual lines connecting HTF candle levels to chart bars
5. **HTF Timer**: Countdown showing time remaining until HTF candle close
6. **Interval Labels**: Display day of week (Daily+) or time (intraday) on each candle
7. For Daily candles: Choose open time (Midnight, 8:30, 9:30) to match your market structure preference
Use Case: Trade lower timeframes while respecting higher timeframe structure. Watch for HTF candle closes to confirm directional bias.
FVG & VI Detection
Fair Value Gaps and Volume Imbalances highlight inefficiencies that price often revisits:
1. **Fair Value Gaps (FVGs)**: Detected when HTF candle wicks don't overlap between 3 consecutive candles
- Bullish FVG: Gap between candle 1 high and candle 3 low (green box by default)
- Bearish FVG: Gap between candle 1 low and candle 3 high (red box by default)
2. **Volume Imbalances (VIs)**: Similar detection but focuses on body gaps
- Bullish VI: Gap between candle 1 close and candle 3 open
- Bearish VI: Gap between candle 1 open and candle 3 close
3. Enable FVG/VI detection per HTF slot individually
4. Customize colors and transparency for each imbalance type
5. Boxes appear on chart at formation and remain visible as retracement targets
**Use Case**: Identify high-probability retracement zones. Price often returns to fill FVGs and VIs before continuing the trend. Use as entry zones or profit targets.
🎨 Customization
OFA is built for flexibility. Every feature includes extensive customization options:
Visual Customization
- **Colors**: Independent color control for every element (sessions, kill zones, lines, labels, FVGs, VIs)
- **Transparency**: Adjust box and label transparency (0-100%) for clean charts
- **Line Styles**: Choose Solid, Dashed, or Dotted for previous period lines
- **Sizes**: Control text size, line width, and box borders
- **Positions**: Place watermark in 9 positions, labels left/right
Layout Control
- **HTF Display Mode**: "Below Chart" for detailed analysis, "Right Side" for space efficiency
- **Drawing Limits**: Set max days for sessions/kill zones to manage chart clutter
- **Lookback Periods**: Control how many previous periods to display (1-10)
- **Gradient Effects**: Enable fading for older previous period lines
Timing Adjustments
- **Timezone**: Universal GMT offset selector (-12 to +14) for global markets
- **Session Times**: Customize each session's start/end times
- **Kill Zone Times**: Adjust kill zone windows to match your market's characteristics
- **Daily Open**: Choose Midnight, 8:30, or 9:30 for Daily HTF candle open time
💡 Best Practices
1. Start Simple: Enable one feature at a time to learn how each element affects your analysis
2. Match Your Timeframe: Use Daily levels on intraday charts, Weekly on daily charts, HTF candles one or two levels above your trading timeframe
3. Kill Zone Focus: Concentrate your trading activity during kill zones for higher probability setups
4. HTF Confirmation: Wait for HTF candle closes before committing to directional bias
5. FVG/VI Entries: Look for price to return to unfilled FVGs/VIs for entry opportunities with favorable risk/reward
6. Customize Colors: Use a consistent color scheme that matches your chart theme and reduces visual fatigue
7. Reduce Clutter: Disable features you're not actively using in your current trading plan
8. Session Context: Understand which session controls the market—trade with session direction or anticipate reversals at session transitions
⚙️ Settings Guide
OFA organizes settings into logical groups for easy navigation:
- **═══ WATERMARK ═══**: Title, subtitles, position, style, symbol/timeframe display
- **═══ SESSIONS ═══**: Enable/disable sessions, times, colors, high/low lines, boxes, markers
- **═══ KILL ZONES ═══**: Individual kill zone toggles, times, colors, max days display
- **═══ PREVIOUS H/L - DAILY ═══**: Daily high/low lines, style, color, lookback, labels
- **═══ PREVIOUS H/L - WEEKLY ═══**: Weekly high/low lines, style, color, lookback, labels
- **═══ PREVIOUS H/L - MONTHLY ═══**: Monthly high/low lines, style, color, lookback, labels
- **═══ HTF CANDLES ═══**: Global display mode, layout settings
- **═══ HTF SLOT 1-5 ═══**: Individual HTF configuration (timeframe, colors, title, FVG/VI detection, trace lines, timer, interval labels)
Each setting includes tooltips explaining its function. Hover over any input for detailed guidance.
📝 Final Notes
One for All (OFA) represents a complete ICT analysis toolkit in a single indicator. By combining watermark customization, session visualization, kill zone highlighting, previous period levels, and higher timeframe candles with FVG/VI detection, OFA eliminates the need for multiple indicators cluttering your chart.
**Version**: 3.3.0
**Author**: theCodeman
**Pine Script**: v6
**License**: Mozilla Public License 2.0
Start with default settings to learn the indicator's structure, then customize extensively to match your personal trading style. Remember: tools provide information, but your edge comes from disciplined execution of a proven strategy.
Happy Trading! 📈
Ictkillzones

ICT Essentials [LDT]ICT Essentials
Overview
ICT Essentials is an all-in-one trading utility built to create a natural and efficient workflow for ICT-based traders.
Every component has been designed to integrate seamlessly and update dynamically across timeframes.
The indicator focuses on clarity, performance and customization, allowing traders to tailor every part of their trading experience.
Equal Highs & Lows
This feature automatically detects and marks Equal Highs (EQH) and Equal Lows (EQL) with full control over visuals and behavior.
Users can customize line colors, widths, and styles, label size, color, background transparency and text offset.
The logic uses an optimized scanning and caching system that maintains smooth performance even on higher timeframes.
It provides a precise and adaptive way to identify structural liquidity points whilst keeping the chart clean and readable.
Killzones & Session Pivots
Plots the main trading sessions such as Asia, London and New York (AM, Lunch, PM) with full flexibility and styling options.
Each session can be enabled or disabled individually, with its own color, transparency and label preferences.
Session highs and lows are automatically tracked and plotted as pivots with extension modes like Until Mitigated or Past Mitigation.
This system gives traders the ability to organize market sessions exactly how they prefer whilst keeping the chart consistent and efficient.
Daily Pivots and Tier System
Alongside session pivots, the script tracks daily highs and lows to provide a broader structural view of price. These pivots are stored and displayed on the chart with their appearance updating automatically when price interacts with them.
The system includes a unique tier-based visibility filter that maintains a clean chart by preventing duplicate or overlapping pivots. Recent daily pivots are cached and compared to session pivots and when two levels fall within a defined proximity, the redundant one is automatically hidden. This creates a clear hierarchy of daily and session levels, keeping the most relevant structure visible whilst removing noise.
All aspects of the daily pivot system are fully customizable, including the number of tracked pivots, color, style settings and how mitigated levels are handled. The caching and filtering logic ensures smooth performance and a visually organized workspace even as the data updates in real time.
Key Times
Allows up to five custom key time markers such as the Midnight Open, 6:00 AM or 10:00 AM.
Each marker can be fully customized with its own text, color, line style and thickness.
This makes it simple to visualize key reaction points that align with each traders timing model.
Higher Timeframe Candles
Displays higher timeframe candles such as 1H, 4H or Daily directly on the active chart to provide context without switching views.
Users can customize body, wick and border colors, along with adding optional trace lines for the open, close, high and low and can also show the countdown timers for remaining candle time.
Adjustable spacing, positioning and label visibility makes the display blend naturally with any trading setup.
This module helps traders connect multiple timeframes visually in a clean and intuitive way.
Watermark
Adds a customizable watermark with title, subtitle and symbol or timeframe information.
Every element can be adjusted for color, size, transparency, alignment and position.
The result is a polished, professional chart layout that adapts to the user's personal style.
Optimization and Design
ICT Essentials is built for performance, using cached arrays and lightweight calculations to maintain responsiveness on all timeframes.
Each feature can be toggled individually to suit the traders focus or system performance.
The script delivers a fluid, customizable and highly optimized trading experience designed to feel natural and effortless in day-to-day use.
Credits
This script takes reference and inspiration from several open-source indicators:
Equal Highs and Lows by jzstur
ICT HTF Candles (fadi) by fadizeidan
ICT Killzones + Pivots EP by tradeforopp
AG FX - Watermark by AGFXTRADING
All components have been refactored, optimized and unified into a single framework for a smoother and more efficient workflow.

Midnight 30min High/LowMidnight 30min High/Low — Overnight Liquidity Range Tracker
Capture the Overnight Session: A Strategic Level Identification Tool from Professional Trading Methodology
This indicator captures the high and low prices during the critical 30-minute midnight session (12:00-12:30 AM EST) and projects these levels forward as key support and resistance zones. These overnight ranges often contain significant liquidity and serve as crucial reference points for intraday price action, representing areas where institutional activity may have established important levels.
🔍 What This Script Does:
Identifies Critical Overnight Session Levels
- Automatically detects the 12:00-12:30 AM EST session window
- Captures the highest and lowest prices during this 30-minute period
- Projects these levels forward for multiple trading days
Creates Dynamic Support/Resistance Zones
- Extends midnight high/low levels as horizontal lines with customizable projection periods
- Fills the area between high and low to create a visual trading range
- Updates automatically each trading day with new overnight levels
Provides Clear Visual Reference Points
- Optional session start markers (●) highlight when the midnight session begins
- Color-coded lines distinguish between high and low levels
- Transparent fill area creates an easy-to-identify trading zone
Real-Time Level Tracking
- Updates levels in real-time during the active midnight session
- Maintains historical levels for reference and backtesting
- Compatible with data window for precise level values
⚙️ Customization Options:
Extend Days (1-30):** Control how many days forward the levels are projected (default: 5 days)
High Line Color:** Customize the midnight high line color (default: blue)
Low Line Color:** Customize the midnight low line color (default: orange)
Fill Color:** Adjust the transparency and color of the range area (default: light aqua, 80% transparency)
Show Session Markers:** Toggle yellow session start indicators on/off (default: enabled)
💡 How to Use:
Deploy on lower timeframes (1m-15m) for precise level identification and reaction monitoring**
Watch for key price interactions:
- Rejection at midnight high levels (potential resistance)
- Bounce from midnight low levels (potential support)
- Range-bound trading between the high and low levels
Combine with liquidity concepts:
- Monitor for stop hunts above/below these levels
- Look for false breakouts that snap back into the range
- Use as confluence with other ICT concepts like FVGs and Order Blocks
Strategic Applications:
- Range trading between midnight levels
- Breakout confirmation when price closes decisively outside the range
- Support/resistance validation for entry and exit planning
🔗 Combine With These Tools for Complete Market Structure Analysis:
✅ First FVG — Opening Range Fair Value Gap Detector.
✅ ICT Turtle Soup (Liquidity Reversal)— Spot stop hunts and false breakout scenarios
✅ ICT Macro Zones (Grey Box Version)- It tracks real-time highs and lows for each Silver Bullet session
✅ ICT SMC Liquidity Grabs and OBs- Liquidity Grabs, Order Block Zones, and Fibonacci OTE Levels, allowing traders to identify institutional entry models with clean, rule-based visual signals.
Together, these tools create a comprehensive Smart Money Concepts (SMC) framework — helping traders identify, anticipate, and capitalize on institutional-level price movements with precision and confidence during critical overnight sessions.

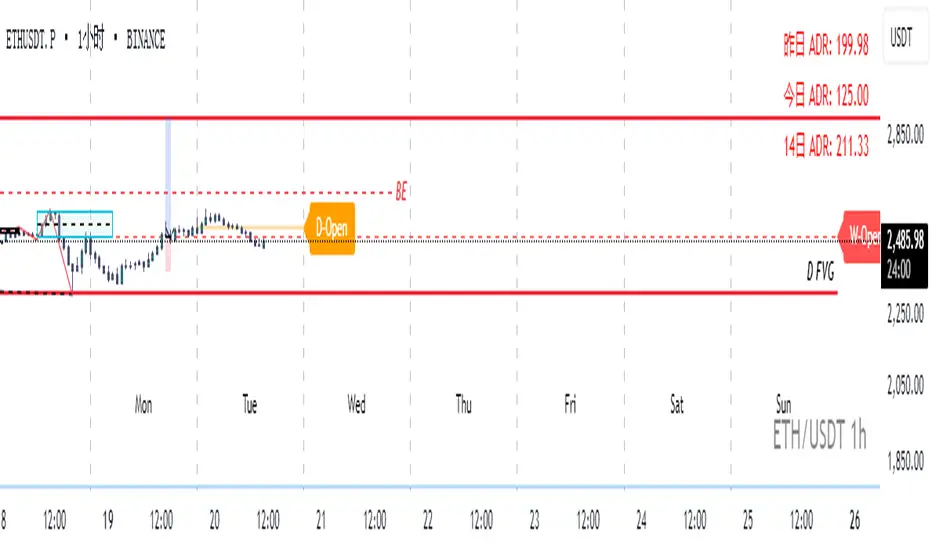
Real-Time Open Levels with Labels + Info TableReal-Time Multi-Timeframe Open Levels with Labels & Info Panel
Overview
This indicator displays real-time opening price levels across multiple timeframes (Monthly, Weekly, Daily, 4H) directly on your chart. It features:
• Dynamic horizontal lines extending through each timeframe period
• Customizable labels with text/colors
• Special 4H line treatment for the last hour (5-min charts only)
• Integrated information panel showing symbol, timeframe, and price changes
! (www.tradingview.com)
*Example showing multiple timeframe levels with labels and info panel*
---
Features & Configuration
1. Monthly Settings
! (www.tradingview.com)
Show Monthly: Toggle visibility of monthly opening price
Color: Semi-transparent blue (#2196F3 at 70% opacity)
Width: 2px line thickness
Style: Solid/Dotted/Dashed
Label: Display "M-Open" text with white text on blue background
2. Weekly Settings
! (www.tradingview.com)
Show Weekly: Toggle weekly opening price visibility
Color: Semi-transparent red (#FF5252 at 70% opacity)
Width: 1px thickness
Style: Dotted by default
Label: "W-Open" text in white on red background
3. Daily Settings
! (www.tradingview.com)
Show Daily: Toggle daily opening price
Color: Amber (#FFA000 at 70% opacity)
Width: 2px thickness
Style: Solid
Label: "D-Open" in white on orange background
---
4. 4-Hour Settings (5-Minute Charts Only)
Special Features for 5-Min Timeframe:
1. Standard 4H Line
• First 3 hours: Green (#4CAF50) dashed line
• Last hour: Bright red solid line (configurable)
• Vertical divider between 3rd/4th hours
2. Configuration Options
• Main 4H Line:
◦ Color/Width/Style for initial 3 hours
◦ Toggle label ("H4-Open") visibility and styling
• Final Hour Enhancement:
*Last Hour Line*
◦ Unique red color and line style
◦ Separate width (1px) and style (Solid)
*Divider Line*
◦ Vertical red dotted line marking last hour
◦ Adjustable position/width/transparency
! (www.tradingview.com)
*4H levels showing 3-hour segment and final hour treatment*
---
5. Info Panel Settings
Positioning:
• Anchor to any chart corner (Top/Bottom + Left/Right combinations)
• Three text sizes: Title (Huge), Change % (Large), Signature (Small)
Display Elements:
• Symbol: Show exchange prefix (e.g., "NASDAQ:")
• Timeframe: Current chart period (e.g., "5m")
• Change %: 24-hour price movement ▲/▼ percentage
• Custom Signature: Add text/username in footer
Styling:
• Semi-transparent white text (#ffffff77)
• Currency pair formatting (e.g., BTC/USD vs BTC-USD)
! (www.tradingview.com)
*Sample info panel with all elements enabled*
---
Usage Tips
1. Multi-Timeframe Context: Use levels to identify key daily/weekly support/resistance
2. 4H Trading: On 5-min charts, watch for price reactions near final hour transition
3. Customization:
• Match line colors to your chart theme
• Use different labels for clarity (e.g., "Weekly Open")
• Disable unused elements to reduce clutter
4. Divider Lines: Helps identify institutional trading periods (hour closes)
---
*Created using Pine Script v6. For optimal performance, use on charts <1H timeframe. ()*
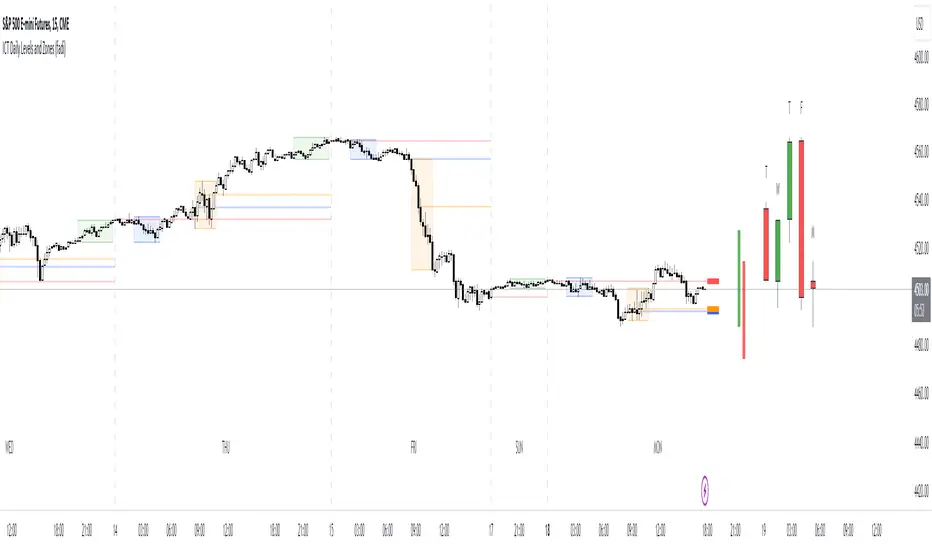
ICT Macro Zone Boxes w/ Individual H/L Tracking v3.1ICT Macro Zones (Grey Box Version
This indicator dynamically highlights key intraday time-based macro sessions using a clean, minimalistic grey box overlay, helping traders align with institutional trading cycles. Inspired by ICT (Inner Circle Trader) concepts, it tracks real-time highs and lows for each session and optionally extends the zone box after the session ends — making it a precision tool for intraday setups, order flow analysis, and macro-level liquidity sweeps.
### 🔍 **What It Does**
- Plots **six predefined macro sessions** used in Smart Money Concepts:
- AM Macro (09:50–10:10)
- London Close (10:50–11:10)
- Lunch Macro (11:30–13:30)
- PM Macro (14:50–15:10)
- London SB (03:00–04:00)
- PM SB (15:00–16:00)
- Each zone:
- **Tracks high and low dynamically** throughout the session.
- **Draws a consistent grey shaded box** to visualize price boundaries.
- **Displays a label** at the first bar of the session (optional).
- **Optionally extends** the box to the right after the session closes.
### 🧠 **How It Works**
- Uses Pine Script arrays to define each session’s time window, label, and color.
- Detects session entry using `time()` within a New York timezone context.
- High/Low values are updated per bar inside the session window.
- Once a session ends, the box is optionally closed and fixed in place.
- All visual zones use a standardized grey tone for clarity and consistency across charts.
### 🛠️ **Settings**
- **Shade Zone High→Low:** Enable/disable the grey macro box.
- **Extend Box After Session:** Keep the zone visible after it ends.
- **Show Entry Label:** Display a label at the start of each session.
### 🎯 **Why This Script is Unique**
Unlike basic session markers or colored backgrounds, this tool:
- Focuses on **macro moments of liquidity and reversal**, not just open/close times.
- Uses **per-session logic** to individually track price behavior inside key time windows.
- Supports **real-time high/low tracking and clean zone drawing**, ideal for Smart Money and ICT-style strategies.
Perfect — based on your list, here's a **bundle-style description** that not only explains the function of each script but also shows how they **work together** in a Smart Money/ICT workflow. This kind of cross-script explanation is exactly what TradingView wants to see to justify closed-source mashups or interdependent tools.
---
📚 ICT SMC Toolkit — Script Integration Guide
This set of advanced Smart Money Concept (SMC) tools is designed for traders who follow ICT-based methodologies, combining liquidity theory, time-based precision, and engineered confluences for high-probability trades. Each indicator is optimized to work both independently and synergistically, forming a comprehensive trading framework.
---
First FVG Custom Time Range
**Purpose:**
Plots the **first Fair Value Gap (FVG)** that appears within a defined session (e.g., NY Kill Zone, Custom range). Includes optional retest alerts.
**Best Used With:**
- Use with **ICT Macro Zones (Grey Box Version)** to isolate FVGs during high-probability times like AM Macro or PM SB.
- Combine with **Liquidity Levels** to assess whether FVGs form near swing points or liquidity voids.
---
ICT SMC Liquidity Grabs and OB s
**Purpose:**
Detects **liquidity grabs** (stop hunts above/below swing highs/lows) and **bullish/bearish order blocks**. Includes optional Fibonacci OTE levels for sniper entries.
**Best Used With:**
- Use with **ICT Turtle Soup (Reversal)** for confirmation after a liquidity grab.
- Combine with **Macro Zones** to catch order blocks forming inside timed macro windows.
- Match with **Smart Swing Levels** to confirm structure breaks before entry.
ICT SMC Liquidity Levels (Smart Swing Lows)
**Purpose:**
Automatically marks swing highs/lows based on user-defined lookbacks. Tracks whether those levels have been breached or respected.
**Best Used With:**
- Combine with **Turtle Soup** to detect if a swing level was swept, then reversed.
- Use with **Liquidity Grabs** to confirm a grab occurred at a meaningful structural point.
- Align with **Macro Zones** to understand when liquidity events occur within macro session timing.
ICT Turtle Soup (Liquidity Reversal)
**Purpose:**
Implements the classic ICT Turtle Soup model. Looks for swing failure and quick reversals after a liquidity sweep — ideal for catching traps.
Best Used With:
- Confirm with **Liquidity Grabs + OBs** to identify institutional activity at the reversal point.
- Use **Liquidity Levels** to ensure the reversal is happening at valid previous swing highs/lows.
- Amplify probability when pattern appears during **Macro Zones** or near the **First FVG**.
ICT Turtle Soup Ultimate V2
**Purpose:**
An enhanced, multi-layer version of the Turtle Soup setup that includes built-in liquidity checks, OTE levels, structure validation, and customizable visual output.
**Best Used With:**
- Use as an **entry signal generator** when other indicators (e.g., OBs, liquidity grabs) are aligned.
- Pair with **Macro Zones** for high-precision timing.
- Combine with **First FVG** to anticipate price rebalancing before explosive moves.
---
## 🧠 Workflow Example:
1. **Start with Macro Zones** to focus only on institutional trading windows.
2. Look for **Liquidity Grabs or Swing Sweeps** around key highs/lows.
3. Check for a **Turtle Soup Reversal** or **Order Block Reaction** near that level.
4. Confirm confluence with a **Fair Value Gap**.
5. Execute using the **OTE level** from the Liquidity Grabs + OB script.
---
Let me know which script you want to publish first — I’ll tailor its **individual TradingView description** and flag its ideal **“Best Used With” partners** to help users see the value in your ecosystem.

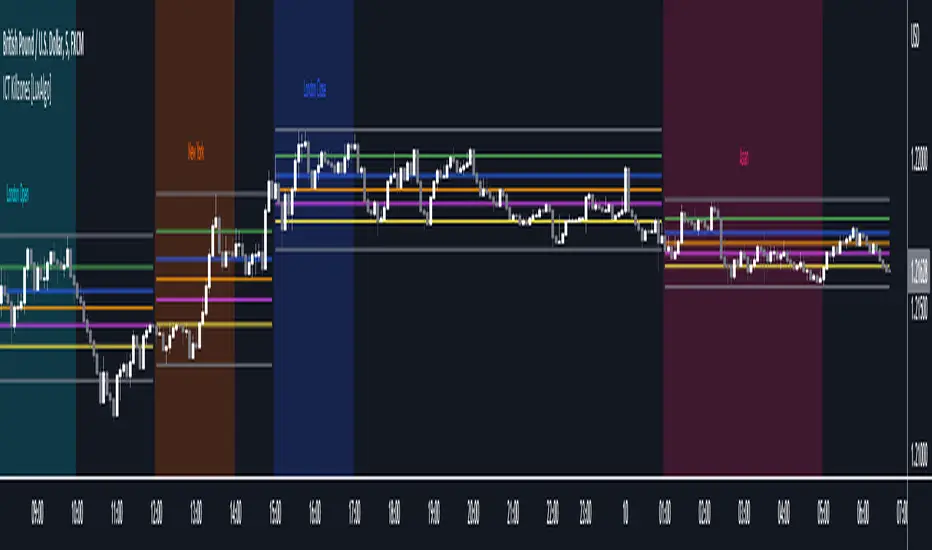
Trading Sessions [BigBeluga]
This indicator brings Smart Money Concept (ICT) session logic to life by plotting key global trading sessions with volume and delta analytics. It not only highlights session ranges but also tracks their midpoints — which often act as intraday support/resistance levels.
🔵 KEY FEATURES
Visual session boxes: Plots boxes for Tokyo, London, New York, and Sydney sessions based on user-defined UTC+0 time ranges.
Volume & delta metrics: Displays total volume and delta volume (buy–sell difference) within each session.
Mid, High & Low Range Extension: Once a session ends, the high, low, and midpoint levels automatically extend — ideal for detecting SR zones.
Session labels: Each box includes a label with session name, time, volume, and delta for quick reference.
Custom session control: Enable or disable sessions individually and configure start/end times.
Clean aesthetics: Transparent shaded boxes with subtle borders make it easy to overlay without clutter.
Sessions Dashboard: Shows the time range of each session and tells you whether the session is currently active.
🔵 USAGE
Enable the sessions you want to monitor (e.g., New York or Tokyo) from the settings.
Use session volume and delta values to gauge the strength and direction of institutional activity.
Watch for price interaction with the extended range — it often acts as dynamic support/resistance after the session ends.
Overlay it with liquidity tools or breaker blocks for intraday strategy alignment.
🔵 EXAMPLES
Extended Future Range acted as resistance/support.
Delta value helped confirm bullish pressure during New York open.
Multiple sessions helped identify kill zone overlaps and high-volume turns.
Trading Sessions is more than just a visual scheduler — it's a precision tool for traders who align with session-based volume dynamics and ICT methodology. Use it to define high-probability zones, confirm volume shifts, and read deeper into the true intent behind market structure.

ICT SB Time (Lee B)A minimal and clean indicator that simply plots the ICT Silver Bullet time windows for you on the chart with vertical lines.
It also has the option to show other important times, like 00:00, 8:30, and 9:30. Toggles in settings let you change line color, turn any of them off temporarily, and can limit their visibility to only the lower timeframes for less clutter.
I hope you find this indicator useful... and happy trading!
Lee B
ICT Silver Bullet Vertical Lines by Fahmi EshaqThis indicator is designed for users interested in backtesting the Silver Bullet strategy. It eliminates the need for manual drawing of vertical lines by automatically highlighting specific times known as ICT Silver Bullet times. These times correspond to periods when smart money are active the market. The indicator marks these Silver Bullet times with vertical lines, making them easily identifiable. The specified Silver Bullet times are 3AM-4AM, 10AM-11AM, and 2PM-3PM New York time. Additionally, a vertical line is added at 12:00AM to demarcate the start of each day, as days begin at midnight.

itradesize /\ Silver Bullet x Macro x KillzoneThis indicator shows the best way to annotate ICT Killzones, Silver Bullet and Macro times on the chart. With the help of a new pane, it will not distract your chart and will not cause any distractions to your eye, or brain but you can see when will they happen.
The indicator also draws everything beforehand when a proper new day starts.
You can customize them how you want to show up.
Collapsed or full view?
You can hide any of them and keep only the ones you would like to.
All the colors can be customized, texts & sizes or just use shortened texts and you are also able to hide those drawings which are older than the actual day.
You should minimize the pane where the script has been automatically drawn to therefore you will have the best experience and not show any distractions.
The script automatically shows the time-based boxes, based on the New York timezone.
Killzone Time windows ( for indices ):
London KZ 02:00 - 05:00
New York AM KZ 07:00 - 10:00
New York PM KZ 13:30 - 16:00
Silver Bullet times:
03:00 - 04:00
10:00 - 11:00
14:00 - 15:00
Macro times:
02:33 - 03:00
04:03 - 04:30
08:50 - 0910
09:50 - 10:10
10:50 - 11:10
11:50 - 12:50

ICT Daily Levels and Zones (fadi)ICT Daily Levels and Zones indicator provides some of the relevant zones and levels for ICT type analysis. The purpose of this indicator is to provide consolidated way of automatically highlighting and identifying relevant levels for ICT type traders.
Daily Separator and Day of Week
Display a separator based on NY Midnight and day of week.
Killzones
Highlight ICT Asia, London, and NY killzones. Please note that the default times are based on Index Futures. Update the times of day if you plan on using it for other instruments such as Forex.
Open Range
The 9:30am to 10:00am open range
(Shown with Extend setting on)
Open Range Gap
The open range Gap is the difference between the 4:15pm close and the 9:30am open.
(Shown with Extend setting on)
Time of Day Levels
The Midnight, 8:30am, and 9:30am open levels.
Daily Midnight Candle
ICT style Daily candle formation based on Midnight open
ICT Killzones [LuxAlgo]This script highlights ICT Killzones on the chart along with Fibonacci retracements constructed from each Killzone's price range, allowing traders to find more optimal entries.
Settings
Killzone Retracements
Show Retracements: Determines whether Fibonacci retracements are displayed on the chart.
Extend: Determines if the retracements are extended outside the Killzone.
Reverse: Switches the maximum and minimum levels for the calculation of the retracements.
Other settings allow disabling as well as changing the retracement value and color.
Usage
Killzones are introduced by forex trader ICT and represent different time intervals that aims at offering optimal trade entries. Killzones include:
New York Killzone (7:9 ET)
London Open Killzone (2:5 ET)
London Close Killzone (10:12 ET)
Asian Killzone (20:00 ET)
Note that using timeframes superior to 1h can highlight incorrect intervals
Fibonacci retracements on an active Killzone are subject to changes, if no Killzones are active then the associated Fibonacci retracements will stay at their current level.
Disabling specific Killzones while having extended retracements will allow them to extend further. In the image above the New York and Asian Killzones are disabled.
ICT Sessions (Kill Zones)Inspired by the work of ICT (Inner Circle Trader - @ICT_MHuddleston)
What are ICT KillZones:
All ICT students know that certain moments of the day are more indicated to search for good frameworks. These moments are indicated like "Kill Zones".
The best kill zones to search for profittable tradings are during the London session and during the New York session.
How This Indicator Can Help You:
With this indicator you'll see plotted in the charts the London Kill Zone and the New York Kill Zone, you'll see exactly when they start and finish, so you'll be able to understand better the price action and recognize if there are ICT framework to trade. You'll also will see when the New York lunch hour happen (this moment is not favorable for searching frameworks) and you'll see also 2 very important moments of the day, the 8.30 New York Time and the 9.30 New York Time, infact in these 2 particular moments it is most likely that some very profittable framework will appear as there are alway important economic news released in these 2 hours.
Also you'll see the New York Midnight Open, that always forms a very important level for the day trading, you could see the New York Midnight open as a real opening for markets.
Why This Indicator:
I looked for indicators working with these concepts and I could not find one that offered the kill zones sections in the way are showed in my indicator, also they just had the kill zones without showing the 8.30 and 9.30 hours and without the Ney York midnight opening, and these are very important time frames for who works with ICT concepts.
About The Indicator:
In this indicator you'll have displayed:
The regular trading sessions displayed, that is: Asian Session, London Session, New York Session.
The London Kill Zone
The New York Kill Zone
The New York Midnight Open
The New York Lunch Hour
The 8:30 News Release Hour
The 9:30 News Release Hour
All these level can be adjusted and changed as you prefer.

ICT EverythingVersion 1.0
Global Settings
• Timezone Selection
• Hide Indicator Above Specified Time
Thematic Override
• Override Colors For Dark Theme ( Colors Set for White Theme by Default )
• Override Session Highlighting Color
Session Options
• Show Historical Sessions
• Enable/Disable Session Highlighting
• Session Specific Visibility
• Session's Crucial Time Vertical Lines w/ Options
NY Midnight Line Options
• Show Historical NY Midnight Vertical Lines
• Midnight Verticle Line Options
• Show Historical NY Midnight Price Lines
• Midnight Price Line Options
Opening Price Line Options
• New York 8:30 AM Price Line Settings
• Equities Open 9:30 AM Price Line Settings
• Option to Display Historical Price Lines
HTF Levels
• Weekly Open
• Monthly Open
label Settings
• Show/Hide Label Text
• Show/Hide Label
Day of Week
• Show Day of Week at the bottom of chart w/ Time Co-ordinates Selection
••• Message Me For Link to Frequently Updated Version of This Indicator •••

ICT KillZone [Index futures edition] Guided by new ICT Mentorship I create this versatile timezone or strikezone indicator to identify this without changing timezone (is based on America/New_York timezone, not your current timezone or GMT)
NRD Sessions Basic FunctionsThis script is an extension and modification of a popular BackGround color script.
Added
1. Style and programming standards to make is easier to read and modify
2. broke out Asia to Sydney and Tokyo Sessions
3. added override to show ICT Kill zones for London and New York
4. Made all this configurable via settings Menu
Enjoy
watch this space as I intend to do more complex session scripts to allow for High and Lows and Mondays too :-)

ICT Sessions [Killzones]This indicator was initially Created by @BryceWH.
Modification by @leonsholo
The indicator uses New York Time
I modified it to match my own criteria which includes:
- I adjusted the time zones.
- Added tags to the settings to make it easy to know which kill zones you are toggling on or off.
- Added the Asia session
- Added the London Close session
How The Indicator Works
Plots the Asia, London, New York and London Close Kill zone as overlay boxes using current daily high / lows.
Marked ranges will move as days range / high and low widens.
Middle fills can be turned on and off.
Colours can be changed to match your preference.
Created this indicator because I didn't like highlighting the whole chart background as seen in other ICT Kill zone indicators on trading view and wanted something visually clearer.
Boxes height can be changed. Positive number puts the box outside current days high and low, negative number puts box inside current days high and low.
" Adapted from Chris Moody's original indicator HLOC" - BryceWH
