McClellan Oscillator - IRUS Optimized🧠 McClellan Oscillator (IRUS Index)
Type: Market Breadth Indicator
Category: Breadth, Momentum
Purpose: Gauge the internal strength of the IRUS index and anticipate trend reversals
📌 Based on
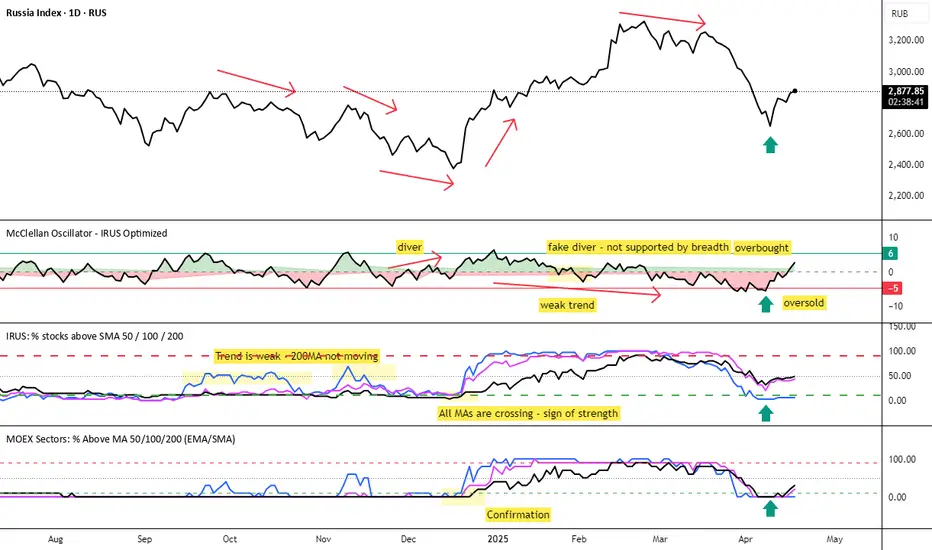
This indicator is built on the concept of advancing vs. declining issues — the number of stocks rising vs. falling each day within the IRUS index (a custom group of 40 Russian stocks).
It calculates the net advances (advancers minus decliners), then applies two exponential moving averages (EMA):
java
Copy
Edit
McClellan Oscillator = EMA_19(Net Advances) - EMA_39(Net Advances)
Where:
Net Advances = Number of advancing stocks - Number of declining stocks
Calculated from a fixed set of 40 IRUS stocks
🧭 What it shows
Above 0 → more stocks are rising: market is internally strong.
Below 0 → more stocks are falling: underlying weakness.
Rising from below -100 → oversold breadth, possible bullish reversal.
Falling from above +100 → overbought breadth, possible correction.
🎯 How to use it
1. Buy/Sell Signals
Buy: Oscillator drops below -100 and turns up → oversold, potential rally.
Sell: Oscillator rises above +100 and turns down → overbought, risk of pullback.
2. Trend Strength Confirmation
Sustained above 0 → confirms bullish trend.
Crosses below 0 → early warning of weakening market breadth.
3. Divergences with IRUS Price
IRUS rises, but Oscillator falls → narrowing leadership, bearish divergence.
IRUS falls, but Oscillator rises → improving breadth, bullish divergence.
⚠️ Notes
The oscillator measures participation, not price.
Works best with daily timeframe.
Does not account for volume or magnitude of price moves.
Use with price action or other indicators for confirmation.
⚙️ Custom Implementation
This version is specifically adapted for the IRUS index, using a fixed list of 40 component stocks.
Optimized for Pine Script v6 and complies with TradingView's request limits (max 40).
IRUS

MOEX Sectors: % Above MA 50/100/200 (EMA/SMA)🧠 Name:
MOEX Sectors: % Above MA 50/100/200 (EMA/SMA)
📋 Description (for TradingView “Description” tab):
This indicator shows the percentage of Moscow Exchange sectoral indices trading above the selected moving average (SMA or EMA) with periods of 50, 100, or 200.
It uses 10 official MOEX sector indices:
MOEXOG (Oil & Gas)
MOEXCH (Chemicals)
MOEXMM (Metals & Mining)
MOEXTN (Transport)
MOEXCN (Consumer)
MOEXFN (Financials)
MOEXTL (Telecom)
MOEXEU (Utilities)
MOEXIT (IT)
MOEXRE (Real Estate)
The indicator plots up to 3 lines representing the % of sectors trading above MA 50, 100, and/or 200. The MA type is user-selectable: EMA (default) or SMA.
Horizontal reference levels (90, 50, 10) help interpret market conditions:
🔼 >90% — Overbought zone, potential market exhaustion
⚖️ ~50% — Neutral state
🔽 <10% — Oversold zone, possible rebound
📈 How to Use in Strategy:
✅ 1. Trend Filter
If >50% of sectors are above MA 200 → market in long-term uptrend
If <50% → avoid long bias, bearish regime likely
✅ 2. Bottom Detection
When <10% of sectors are above MA 200, the market is heavily oversold — often a bottoming signal
✅ 3. Trend Confirmation
If the main index is rising and % of sectors above MA is growing, the trend is supported by breadth
If the index rises while breadth declines → bearish divergence
✅ 4. Contrarian Setups
>90% of sectors above MA 50 → market may be overheated, watch for pullback
<20% above MA 50 → potential local bottom
⚙️ Tips:
Overlay this indicator on the IMOEX index chart to detect narrow leadership
Combine with other breadth metrics or RSI on the index
Use the EMA/SMA toggle to fine-tune sensitivity