MACD w/ DivergencesTo best use the MACD Divergence indicators, adjust the following settings accordingly.
• MACD Bullish Divergence Under: <0 (lower for larger volatility and more bearish markets)
• MACD Bearish Divergence Above: >0 (higher for larger volatility and more bullish markets)
THIS SCRIPT DOES NOT REPAINT AND IS COMPLETELY FREE.
Goodluck Trading!
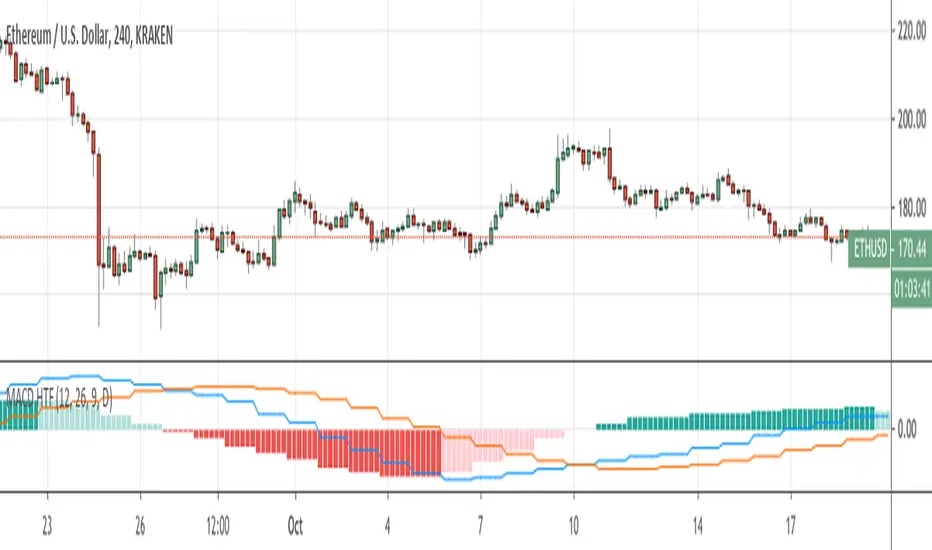
K-macd

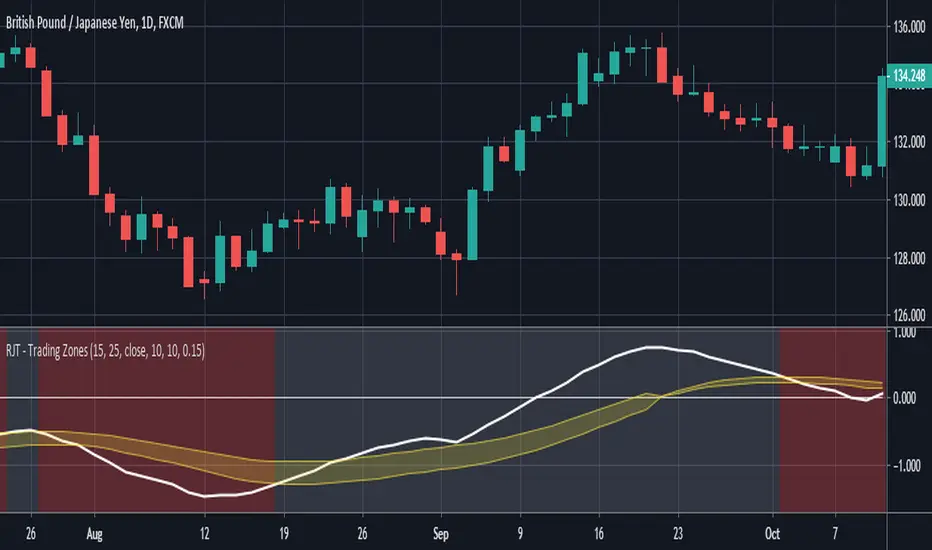
RJT - Trading ZonesThis is the Visual Indicator component of my Trading Zones System; other indicators are the Trade Visualiser and Trader Placer.
This indicator is based around a convergence and divergence of moving averages. As the signal line moves into the yellow "zone" from below a long position is opened. This position is closed and reversed when either the upper or lower boundary is crossed downwards by the signal line. This is all reversed for short trades.
The channel is created by adding a factor of previous values, from a configurable period, to an exponential moving average of the signal line.
Best used on the Daily timeframe of any Forex or Commodity market, but is successful on all timeframes.
Go Long when background turns from Red to Green.
Go Short when background changes from Green to Red.
Signal Smoothing = Length of signal period
Signal Look back period = Period of look back for highest value (when long, lowest value when short) to create channel width
Channel multiple= Multiple of highest value to be added to EMA of Signal to create zone (larger number = wider zone)
Mirror MACD by Trader JayThis is my take on the metatrader indicator, the mirror macd. Works pretty good on Forex, haven't tested on anything else
Enter long after the Blue Line Cross Up the Red Line and EXIT after the Green line Cross Up the Red Line (above the Blue Line).
For the opposite position : ENTER SELL after the Red Line Cross Down.

[SignalFI] MACD PrimeWelcome! As part of our continual process to build and enhance trusted existing indicators, we're proud to release MACD Prime to the PRIME series for those traders that rely on the popular divergence mechanics traditional MACD provides.
MACD Prime provides a default MACD structure using the popular 12,26 EMAs and a 9 lockback signal line as the core of the indicator's functionality. In this way, you will get a consistent view for what you're use to, but of course we've added additional functionality that can be used to increase the value this view provides when trading.
ADDITIONAL Functions:
1) MACD Fast and Slow EMA sources are selectable, thus allowing the user to select OHLC variants as the source input for the 12/26 trendlines.
2) Background Coloring is based on a secondary "Signal" color which be default has been set to 6. This length is configurable, and providing a leading edge to the typical "MACD Cross". Said simply, the background color will change with the trend BEFORE a default MACD cross occurs. This may provide early warning of a MACD cross, and allow for additional entry/exit signals to manifest depending on other confluence with price and trend information.
3) MACD Trend Lines. In accordance with the PRIME series MACD Prime comes bundled with Trend Line support and resistance pivots that provide additional context for how the MACD may act based on a previous and projected trend line information. By default projections are turned off, but can be enabled from within the menu options. These trendlines can be used to spot divergences as well, and can be tuned within the option to increase resolution or decrease noise provided by trend lines.
All other standard functions persist, including the typical MACD line, MACD Signal Line, and MACD Histogram.
SignalFI was created to help traders and investors to effectively analyze the market based on the Golden Mean Ratio (Fibonacci numbers), plan a trade and ultimately execute it. To help inform and educate market decisions we developed a set of Trading Indicators which are available on TradingView.
SignalFI indicators are just that, indicators. Our indicators are generally configured to use completely historical data (negating repaint), and we advise all alerts created with SignalFI indicators to be fired upon "close" of the current candle. Our indicators can provide valuable context and visualization support when performing market analysis and executing buy and sell decisions. However. we are not financial experts, and all information presented on this site or our other media outlets are for educational purposes only.

Compare (RSI) MACDHere I've created an indicator which can be used together with my "Compare (RSI) Ticker 3x" Indicator.
It makes it much easier to see the movements between the "RSI Ticker 1" and "RSI Ticker 2/3".
- The white line is the "MACD" of Ticker 1, which is the difference between the "RSI Ticker 1" and "RSI Ticker 2/3".
- The purple line is the "Signal" line, an EMA of the "MACD". (Length is adjustable)
- The "0-line" is the "RSI Ticker 2/3" line, when Ticker 2 is chosen, this will be blue coloured, when Ticker 3 is chosen it will be red.
Because 2 MACD in 1 indicator is way too messy, you only can choose the comparison against Ticker 2 OR Ticker 3.
- In "Settings" > "Inputs" you can enable/disable the second or third Ticker
(If Ticker 2 is enabled, Ticker 3 is disabled and vice versa)
- The second Ticker has multiple choices
- The third you can type any Ticker you want, for example CRYPTOCAP:BNB, BINANCE:ETHUSDT, NASDAQ_DLY:NDX or whatever,
just start typing and you'll see the possibilities (You also can choose between "Cryptocurrencies", "Index", "Forex", ...)
- When the "MACD" crosses the "0-line", arrows will appear, white ones for "MACD", purple ones for the "Signal" line.
- The "Histogram" makes it easier to see the difference between "MACD" and "Signal" line.
- The source of this indicator is adjustable
- When the second chosen Ticker is the same as the first Ticker, of course you will be seeing lines
(because there is no difference between the 2 Tickers, the EMA is visible though)
If you use both "Compare (RSI) Ticker 3x" AND "Compare (RSI) MACD", of course be aware that you have the same Ticker 2 or 3 in each indicator!

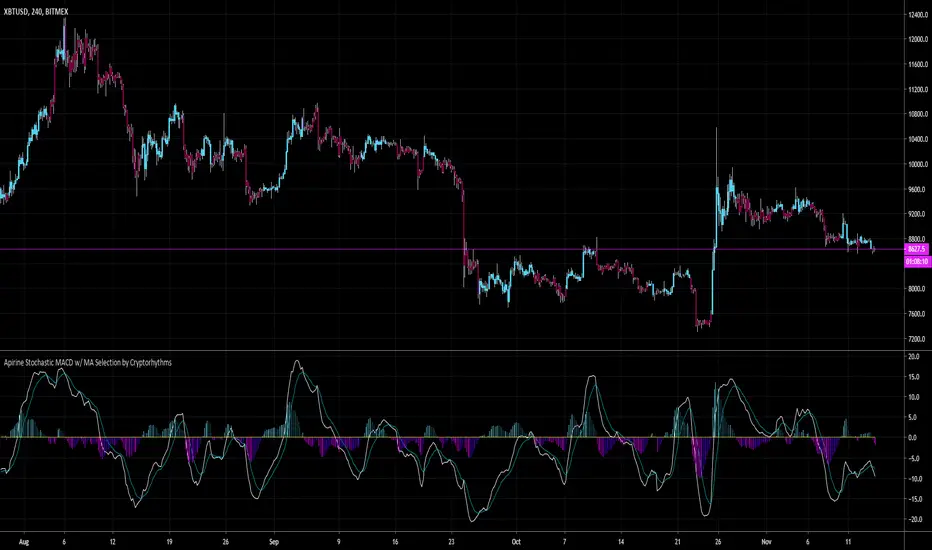
Apirine Stochastic MACD w/ MA Selection by Cryptorhythms📊 Apirine Stochastic MACD w/ MA Selection by Cryptorhythms
Intro
Had to re-release due to moderation.
This happens to be my first open source indicator, hope you all enjoy it!
Description
This indicated is ported from November 2019 issue of TASC. “The Stochastic MACD Oscillator” in this issue, author Vitali Apirine introduces a new indicator created by combining the stochastic oscillator and the MACD . He describes the new indicator as a momentum oscillator and explains that it allows the trader to define overbought and oversold levels similar to the classic stochastic but based on the MACD .
Options
-You can enable bar coloration for trade state (signal conditions setup in the "long" and "short" variables).
-You can choose histogram or columns for the convergence/divergence display.
-You can turn on/off and adjust the overbought / oversold zones.
-You can choose what type of moving average to use in the calculation from a small selection of options. This gives you more flexibility to adapt the indicator to your needs.
👍 We hope you enjoyed this indicator and find it useful! We post free crypto analysis, strategies and indicators regularly. This is our 70th script on Tradingview!
🤐Check my Signature for other information
VBF Trader PRO for BTC and altcoins with LONG and SHORT alertsThis script allows you to catch trend moves between BB critical levels (red and green zones on the chart) and very good for daily scalping ether for bitcoin or any altcoins to USDT or BTC trading pairs. Probability is very HIGH.

Double MACD Buy and SellIndicator for strategy that was used in a Forex competition and was a winner. Use double MACD with custom settings, search video on YouTube:
Learn Five Powerful MACD Trading Strategies
Add some tools to analyze the market context a little more:
- Detector of regular and hidden divergences.
- Atlas Zone (detects consolidation that is about to generate a movement)
- Choppines zone configurable (detects if the market is stable or not)
Visualization of entries in trend and counter-trend according to the rules described in the video.
Buy and sell alerts.
Note: I do not recommend using only this indicator as an investment strategy, it is another tool that must be complemented with a market study by the trader.
Customizable MACD (how to detect a strong convergence)Helloooo traders
I wondered once if a MACD was based on an EMA/EMA/SMA or SMA/SMA/EMA (or WHATEVA/WHATEVA/WHATEVA).
Seems they're so many alternatives out there.
I decided to empower my audience more by choosing the type of moving averages you want for your MACD.
More options doesn't always mean better performance - but who knows - some might find a config that they like with it for their favorite asset/timeframe.
I added also a multi-timeframe component because I'm a nice guy ^^
Convergence is my BEST friend
An oscillator (like MACD) is to measure how strong a momentum is - generally, traders use those indicators to confirm a trend.
So understand that a MACD (or any other indicator not based on convergence ) won't likely be sufficient for doing great on the market.
Combined with your favorite indicator, however, you may get great results.
My indicators fav cocktail is mixing :
1) an oscillator (momentum confirmation)
2) a trendline/key level break (momentum confirmation)
3) adding-up on a different trading method but still converging with the first entry.
The reason I'm deep with convergence detection is because I'm obsessed with removing those fakeout signals. You know which ones I'm talking about :)
Those trades when the market goes sideways but our capital goes South (pun 100% intended) - 2 days later, the price hasn't changed much but some lost some capital due to fees, being overexposed, buying the top/selling the bottom of a range they didn't identify.
It's publicly known that ranges are the worst traders' enemy. It's boring, not fun, and .... end up moving in the direction we expected when we go to sleep or outside.
NO ONE/BROKER/EX-GF is tracking your computer - I checked also for mine as it happened for me way too often in the past.
I surely preferred blaming a few external unknown conditions than improving my TA back in the days #bad #dave
But my backtest sir...
Our backtests show what they're being told to show . A backtest without a stop-loss/hard exit logic will show incredible results.
Then trying that backtest with live trading is like in the Matrix movie - discovering the real world is tough and we must choose between the blue pill (learning how to evaluate properly risk/opportunity caught) and the red pill (increasing the position sizing, not setting a stop loss, holding the positions hoping for the best)
Last few words
Convergences aren't invented because it's cool to mix indicators with others. (it is actually and even fun)
They're created to remove most of the fakeouts . For those that can't be removed - a strong risk management would cut most of the remaining potential big losses.
No system works 100% of the time - so a convergence system needs a back-up plan in case the converged signal is wrong (could be stop-loss, hard exit, reducing position sizing, ...)
Wishing you the BEST and happy beginning of your week
Daveatt

ANN Forecast MACD [Noldo] In this script, I tried to convert ANN MACD to MACD Forecast.
It took me quite a while, but it was fun.
After selecting the ticker, select the instrument from the menu and the system will automatically turn on the appropriate Forecast MACD system.
The system is trained with ANN values of ANN MACD 25 in 1.
But because the system is overloaded, only the most popular instruments are left.
The others were unfortunately eliminated.
The only difference is that it was built on the forecast algorithm of my own creation.
The Forecast algorithm is not open-source.
The codes are a nice framework for some of my most valuable systems about ANN . (Working on them. )
But I'm never remove this script.
You can use it forever for free.
As you can see in the presentation, although it is in the same period, it is more accurate and agile than normal MACD.
I think even a bar is important in trade.
For those who don't see that command,listed instruments with alternative tickers and error rates:
WTI : West Texas Intermediate (WTICOUSD , USOIL , CL1! ) Average error : 0.007593
BRENT : Brent Crude Oil ( BCOUSD , UKOIL , BB1! ) Average error : 0.006591
GOLD : XAUUSD , GOLD , GC1! Average error : 0.012767
SP500 : S&P 500 Index ( SPX500USD , SP1! ) Average error : 0.011650
EURUSD : Eurodollar ( EURUSD , 6E1! , FCEU1!) Average error : 0.005500
ETHUSD : Ethereum ( ETHUSD , ETHUSDT ) Average error : 0.009378
BTCUSD : Bitcoin ( BTCUSD , BTCUSDT , XBTUSD , BTC1! ) Average error : 0.01050
GBPUSD : British Pound ( GBPUSD , 6B1! , GBP1!) Average error : 0.009999
USDJPY : US Dollar / Japanese Yen ( USDJPY , FCUY1!) Average error : 0.009198
USDCHF : US Dollar / Swiss Franc ( USDCHF , FCUF1! ) Average error : 0.009999
USDCAD : Us Dollar / Canadian Dollar ( USDCAD ) Average error : 0.012162
SOYBNUSD : Soybean ( SOYBNUSD , ZS1! ) Average error : 0.010000
CORNUSD : Corn ( ZC1! ) Average error : 0.007574
NATGASUSD : Natural Gas ( NATGASUSD , NG1! ) Average error : 0.010000
SUGARUSD : Sugar ( SUGARUSD , SB1! ) Average error : 0.011081
WHEATUSD : Wheat ( WHEATUSD , ZW1! ) Average error : 0.009980
XPTUSD : Platinum ( XPTUSD , PL1! ) Average error : 0.009964
XU030 : Borsa Istanbul 30 Futures ( XU030 , XU030D1! ) Average error : 0.010727
VIX : S & P 500 Volatility Index (VX1! , VIX ) Average error : 0.009999
ES : S&P 500 E-Mini Futures ( ES1! ) Average error : 0.010709
SSE : Shangai Stock Exchange Composite (Index ) ( 000001 ) Average error : 0.011287
XRPUSD : Ripple (XRPUSD , XRPUSDT ) Average error : 0.009803
Extras :
- Crossover and crossunder alerts
- Switchable barcolor
NOTE :
Australian Dollar / US Dollar (AUDUSD ) removed due to high average error. (Average error > 0.013 )
Timeframe advice :
I suggest you to use that system TF >= 1D
My favorite is 1 week bars. (1W)
Info about forecast series :
www.sciencedirect.com
Special thanks :
Special thanks to dear wroclai for his great effort .

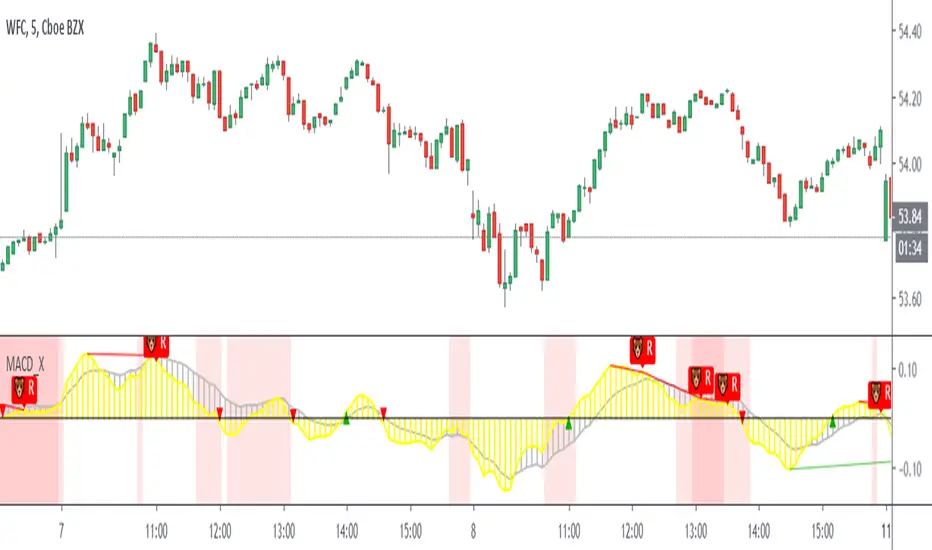
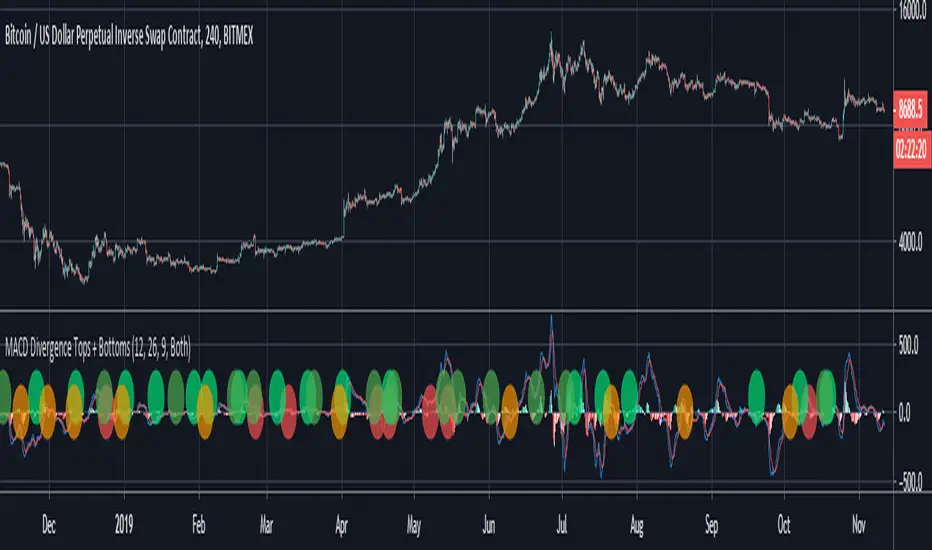
MACD Divergence Tops + BottomsMACD Indicator which plots local peaks and troughs in divergence.
"Classic" Divergence is specified as:
- A higher price, with reduced MACD high --> Potential Sell Point
- A lower price, with higher MACD low --> Potential Buy Point
"Alternative" Divergence is specified as:
- A higher MACD high, with reduced price --> Potential Sell Point
- A lower MACD low, with higher price --> Potential Buy Point
MACD Divergence should be used in combination with other indicators. This indicator identifies local tops and bottoms, with potential for macro trend shifts.
MACDTraderPro for BTC with LONG & SHORT AlertsMostly based on MACD analysis this trend indicator accurately shows you when main trend changes.
It has LONG and SHORT labels and you can use it with tradingview alerts to be in touch and for automated trading bots.
You can use it both with margin(bitmex, bitfinex, etc) and main exchanges (binance and more) with bitcoin for now and soon for alts also.

Zero Lag MACD [ChuckBanger]This is an MACD indicator with the ability to use zeror lag moving average instead of exponential moving average. I also added different background color when histogram is over or under center line, MACD Leader, Laguerre filter and dots to indicate when Leader line crosses macd line. Good luck traders!
MACD Indicator BFThis is my MACD strategy but in indicator format so I can include alerts. The default settings are the same as in the strategy. The long and short conditions that the alerts are attached to are when the delta (usually illustrated as the histogram) crosses above or below the zero line respectively. There is one alert for long, one for short.

CompoundMACDCompoundMACD is a study that modifies the basic MACD to use four moving averages.
The fast line of the MACD (red line) is calculated from a fast (alpha) and slow (beta) double EMA.
The slow line of the MACD (blue line) is calculated from a fast (alpha) and slow (beta) smooth moving average (SMA).
The delta (green line) is calculated from the fast and slow lines of the MACD.
Buy signals occur when the candlestick is below momentum and the fast and slow lines crossover each other while under the delta. These are marked by triangles at the bottom pointing up. A BUY ASSET alert is also provided.
Sell signals occur when the candlestick is above momentum and the fast and slow lines crossunder each other while above the delta. These are marked by triangles at the top pointing down. A SELL ASSET alert is also provided.
User configurable setting:
Momentum
MACD fast line: Fast (Alpha) DEMA, Slow (Beta) DEMA
MACD slow line: Fast (Alpha) SMA, Slow (Beta) SMA
MACD Smoothing

ANN MACD : 25 IN 1 SCRIPTIn this script, I tried to fit deep learning series to 1 command system up to the maximum point.
After selecting the ticker, select the instrument from the menu and the system will automatically turn on the appropriate ann system.
Listed instruments with alternative tickers and error rates:
WTI : West Texas Intermediate (WTICOUSD , USOIL , CL1! ) Average error : 0.007593
BRENT : Brent Crude Oil (BCOUSD , UKOIL , BB1! ) Average error : 0.006591
GOLD : XAUUSD , GOLD , GC1! Average error : 0.012767
SP500 : S&P 500 Index (SPX500USD , SP1!) Average error : 0.011650
EURUSD : Eurodollar (EURUSD , 6E1! , FCEU1!) Average error : 0.005500
ETHUSD : Ethereum (ETHUSD , ETHUSDT ) Average error : 0.009378
BTCUSD : Bitcoin (BTCUSD , BTCUSDT , XBTUSD , BTC1!) Average error : 0.01050
GBPUSD : British Pound (GBPUSD,6B1! , GBP1!) Average error : 0.009999
USDJPY : US Dollar / Japanese Yen (USDJPY , FCUY1!) Average error : 0.009198
USDCHF : US Dollar / Swiss Franc (USDCHF , FCUF1! ) Average error : 0.009999
USDCAD : Us Dollar / Canadian Dollar (USDCAD) Average error : 0.012162
SOYBNUSD : Soybean (SOYBNUSD , ZS1!) Average error : 0.010000
CORNUSD : Corn (ZC1! ) Average error : 0.007574
NATGASUSD : Natural Gas (NATGASUSD , NG1!) Average error : 0.010000
SUGARUSD : Sugar (SUGARUSD , SB1! ) Average error : 0.011081
WHEATUSD : Wheat (WHEATUSD , ZW1!) Average error : 0.009980
XPTUSD : Platinum (XPTUSD , PL1! ) Average error : 0.009964
XU030 : Borsa Istanbul 30 Futures ( XU030 , XU030D1! ) Average error : 0.010727
VIX : S & P 500 Volatility Index (VX1! , VIX ) Average error : 0.009999
YM : E - Mini Dow Futures (YM1! ) Average error : 0.010819
ES : S&P 500 E-Mini Futures (ES1! ) Average error : 0.010709
GAZP : Gazprom Futures (GAZP , GZ1! ) Average error : 0.008442
SSE : Shangai Stock Exchange Composite (Index ) ( 000001 ) Average error : 0.011287
XRPUSD : Ripple (XRPUSD , XRPUSDT ) Average error : 0.009803
Note 1 : Australian Dollar (AUDUSD , AUD1! , FCAU1! ) : Instrument has been removed because it has an average error rate of over 0.13.
The average error rate is 0.1850.
I didn't delete it from the menu just because there was so much request,
You can use.
Note 2 : Friends have too many requests, it took me a week in total and 1 other script that I'll share in 2 days.
Reaching these error rates is a very difficult task, and when I keep at a low learning rate, they are trained for a very long time.
If I don't see the error rate at an average low, I increase the layers and go back into a longer process.
It takes me 45 minutes per instrument to command artificial neural networks, so I'll release one more open source, and then we'll be laying 70-80 percent of the world trade volume with artificial neural networks.
Note 3 :
I would like to thank wroclai for helping me with this script.
This script is subject to MIT License on behalf of both of us.
You can review my original idea scripts from my Github page.
You can use it free but if you are going to modify it, just quote this script .
I hope it will help everyone, after 1-2 days I will share another ann script that I think is of the same importance as this, stay tuned.
Regards , Noldo .

MAC-Z & MACD Leader signal [ChuckBanger]This is a combination of my MACD Leader script and MAC-Z with option to add Laguerre filter. The advantage of the MAC-Z over MACD is that it is a more accurate and “assumption-free” indicator that can more accurately describe how a market actually perform. But you can use this as a regular MACD indicator.
Crossovers signals
The MAC-Z line and signal line can be utilized in the same way as a stochastic oscillator, with the crossover between the two lines providing buy and sell signals. As with most crossover strategies, a buy signal comes when the shorter-term, more reactive line – in this case the MAC-Z line (blue line) crosses above the slower signal line (orange line). For example, when the MAC-Z line crosses below the signal line it provides a bearish sell signal.
Zero line crossing
The zero cross strategy is based on either of the lines crossing the zero line. If the MAC-Z crosses the zero line from below, it is a signal for a possible new uptrend, while the MAC-Z crossing from above is a signal that a new downtrend may be starting. This is special powerful if the lines has a fast up or down movement but the price action doesn't reflect that movement.
Divergences
Bearish and bullish divergences is my favorite signals. When price action and oscillators follow the same path it is called Convergences, when they don’t, it’s called a Divergence. Don't confuse the two because they have not the same meaning. But be aware that for example during consolidation or low liquidity, some small divergences between price and indicators might form, but that doesn't mean we should consider them as real divergences.
There is many different types of divergences. It is easier to show a picture then explaining it so I recommend you to check out the link below. Especially the top image. It sums this up very well
medium.com
MACD Leader
The MACD leader is only showing the crossing of MACD as a vertical line
Green vertical line = MACD Leader Bullish Cross
Red vertical line = MACD Leader Bearish Cross
MACD Leader:
MAC-Z:
More Information
cssanalytics.wordpress.com
en.wikipedia.org
drive.google.com

Range Force Impulse The "Range Force Impulse" indicator combines 4 useful indicators into one, freeing up chart real-estate and giving the trader insight into trend health, bull/bear commitment, range and volatility all at a glance.
The indicator consists of the following:
Direction - True Range and Average True Range columns shown above and below 0 depending on direction of the period's price
-- TR (gray) shows the current period's trading volatility
-- ATR (Impulse colors, see below) shows an EMA of TR over a specified length
-- Can be used to determine stops and targets (Example: Stop loss at prev close - ATR, Target at 2x ATR)
Index - Alexander Elder's EMA of (change(close) * volume), shows crosses above 0 (green) and below 0 (red), and intermediate signals
-- Shows bull vs. bear interest/commitment/dominance
-- Elder recommends EMA length of 2 for daily chart buy/sell signals, and 13 for weekly chart bull/bear dominance & trend direction signals
-- Intermediate signals are shown above 0 when falling (salmon), or below 0 when rising (pale yellow)
System - Range columns are colored using Alexander Elder's censorship system (green: do not short, red: do not long, blue: is up to you)
-- Shows overall trend health (Macd histogram and EMA up/down changes)

Multi momentum indicatorScript contains couple momentum oscillators all in one pane
List of indicators:
RSI
Stochastic RSI
MACD
CCI
WaveTrend by LazyBear
MFI
Default active indicators are RSI and Stochastic RSI
Other indicators are disabled by default
RSI, StochRSI and MFI are modified to be bounded to range from 100 to -100. That's why overbought is 40 and 60 instead 70 and 80 while oversold -40 and -60 instead 30 and 20.
MACD and CCI as they are not bounded to 100 or 200 range, they are limited to 100 - -100 by default when activated (extras are simply hidden) but there is an option to show full indicator.
In settings there are couple more options like show crosses or show only histogram.
Default source for all indicators is close (except WaveTrend and MFI which use hlc3) and it could be changed but for all indicators.
There is an option for 2nd RSI which can be set for any timeframe and background calculated by Fibonacci levels.
