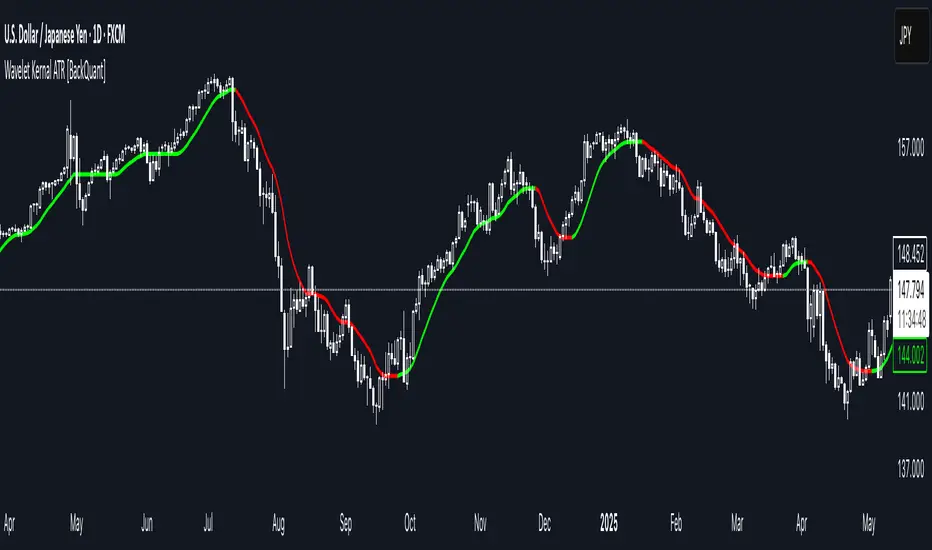
Wavelet Kernal ATR [BackQuant]Wavelet Kernal ATR
Introduction
Wavelet Kernal ATR is a closed-source, chart-side tool that fuses an edge-preserving “wavelet kernal” smoother with an ATR-aware regime line. The goal is simple: follow the real move, ignore the static, and give you clean, visual places to manage risk. It can color the trend directly on price, flip states when regime changes, and (optionally) add a secondary moving-average overlay for confirmation all while keeping the chart readable.
What it is
A single adaptive baseline designed to act like a “bias rail.” When it’s up, you favor longs; when it’s down, you favor shorts. It updates in a way that’s responsive to fresh information but resistant to insignificant wiggles. Around that baseline, an ATR-scaled envelope governs how and when the line concedes to volatility, which helps avoid flip-flopping in chop. Because this release is closed source, the following focuses on behavior and practical use rather than internal math.
What it’s used for
Bias & context: Read the backdrop with one glance; green = bullish regime, red = bearish regime.
Timing: Use slope changes and pullbacks to the line for entries aligned with the dominant push.
Risk placement: The line and its volatility envelope give intuitive zones for stops and targets.
Clarity: Paint candles by state and keep other overlays to a minimum to reduce decision noise.
Why “Wavelet Kernal” matters (plain English)
A wavelet kernal is a localized, scale-aware weighting profile. Instead of averaging every bar equally—or with a single, fixed decay—it emphasizes the most informative part of the recent window while softly down-weighting points that are either too old or too extreme. Three practical benefits result:
Edge preservation: Turning points are less “smeared” than with conventional smoothers, so the line can pivot sooner on genuine breakouts without chasing every tick.
Multi-scale sensitivity: The kernal “listens” to structure at multiple scales inside a compact window, helping it track swing-sized movement while suppressing micro-chop.
Lag vs. noise balance: Because the weighting is localized and shape-aware, you get a calmer line at similar responsiveness compared to common filters; fewer false flips, more meaningful ones.
You don’t need to know the internals to use it: think of the wavelet kernal as a smart stethoscope for price. It hears the heartbeat (trend/impulse) and ignores the coughs (random spikes).
How it behaves
Trend mode: When price expands directionally, the line “sticks” to the move and stays colored in that direction. Pullbacks that remain shallow relative to volatility usually do not flip the state.
Transition mode: After a large push, the line may flatten as volatility compresses. Flat + frequent small flips is the platform telling you: edge is low, wait for expansion.
Shock handling: On sudden spikes, the ATR envelope acts like a reality check—minor overreactions are absorbed, while statistically meaningful breaks force the baseline to concede and re-anchor.
Reading the line (quick heuristics)
Green + rising: Bias long; look for pullbacks toward the line that stall and resume.
Red + falling: Bias short; look for rallies into the line that fade.
Flat + rapid color flips: Stand down or scale down—let the next expansion choose the side.
Color flip at a prior S/R: Treat as a higher-quality signal than flips in the middle of nowhere.
Baseline + ATR corridor (concept)
The volatility envelope isn’t drawn as two fat bands here; it’s used internally to keep the baseline honest. You can think of it as a “breathing room” rule: the line is allowed to adapt with trend, but it shouldn’t jump the fence unless price movement is large enough relative to recent volatility. That’s why the tool feels calm in chop and decisive during actual breaks.
Optional MA Overlay (confluence)
You can overlay a moving average of the baseline itself for slower-regime confirmation. When both agree (baseline direction and its MA slope), you have trend alignment. When they diverge, expect digestion or a possible transition. Keep this overlay subtle; it’s a context layer, not another signal firehose.
What it plots
Wavelet ATR line — the adaptive baseline that flips color with regime.
Optional MA of the baseline — slower confirmation, on or off.
Candle painting — bars can inherit long/short state for instant read-through.
Alerts — available for state flips up/down.
Inputs explained (effect on behavior)
Wavelet ATR Calculation
Price Source — Default hlc3 ; choose your preferred composite of OHLC.
Kernal Calculation Length — The horizon the kernal “listens to.” Longer = steadier, fewer flips; shorter = snappier, more flips.
Kernal Alpha — How strongly the kernal prioritizes the freshest data inside that horizon. Higher alpha = quicker to acknowledge new pushes; lower alpha = more patience.
ATR Period — Determines the volatility memory. Shorter = envelope reacts faster; longer = envelope demands more evidence to concede.
ATR Factor — Scales how “strict” the envelope is. Larger factor = more tolerance (fewer flips); smaller = more sensitivity (earlier regime shifts).
Confluence
Show Atr Moving Average — Turns on the secondary overlay.
MA Type — Choose the flavor you read best (simple, exponential, linear regression, etc.).
Moving Average Period — The overlay’s horizon; treat it as a background current.
Volume Factor / Sigma (when applicable) — Specialized parameter used by certain MA types to shape smoothness.
Plotting & UI
Plot Wavelet ATR — Toggle the main line.
Paint Candles According to Trend — Color bars by the baseline’s state.
Long/Short Colors — Match your chart theme.
A practical playbook
Trend-pullback continuation
Setup: Baseline is green and rising. Price pulls back toward it, stalls (small bodies or wicks into the line), then resumes upward.
Idea: Enter on the resumption. Protective stop often lives just below the line or the last swing low. Scale targets through prior highs or measured projections.
Breakout + acceptance
Setup: Baseline flattens after consolidation. Price expands away; baseline turns green/red and stays that way as two or three bars “accept” the new area.
Idea: Join on the first controlled retest toward the line. If the line instantly loses color again, treat it as a fakeout.
Failed test / flip-and-go
Setup: Price challenges the line from the wrong side but cannot close through it convincingly; shortly after, the baseline flips color back in the original direction.
Idea: Use that failed test as a springboard—risk tucked beyond the failed side.
Quality checks before you click
Structure context: Is the flip happening near prior highs/lows, session opens, or well-observed levels? Flips at structure carry more information.
Volatility posture: If range is compressing, be picky. If range is expanding, respect the first pullback after the flip.
Clutter discipline: Use the fewest layers that earn their place. Trend line + candle painting is often enough.
Common questions
“Why did the line not flip on that spike?” Because the move wasn’t large or sustained enough relative to recent volatility. The envelope forces patience.
“Why did it flip and then flip back?” That’s what digestion looks like. The kernal preserves edges, but when the market truly has no edge, brief flips are information: sit tight.
“Do I need the overlay MA?” No. It’s optional context. If it helps you filter marginal trades, keep it. If it adds noise, turn it off.
Troubleshooting & fine-tuning (principles, not prescriptions)
Too many flips? Increase the Kernal Calculation Length or the ATR Factor. You’re asking for a steadier bias.
Feels late on strong trends? Nudge Kernal Alpha higher or shorten the Kernal Length. You’re asking for earlier acknowledgment.
Stops feel random? Place initial risk just beyond the baseline (or the last swing beyond it), then trail only when fresh structure appears.
Charts feel crowded? Keep the baseline + candle coloring; hide the overlay and other ornaments.
Alerts
Wavelet ATR Trend Up
Wavelet ATR Trend Down
Final notes
This tool is built to minimize analysis fatigue: one adaptive line, strong visual feedback, and enough discipline from volatility logic to avoid the “every blip is a signal” trap. The internal math, weighting shapes, and state logic are proprietary and intentionally not disclosed here; you still have full control of behavior through the inputs above. As always, align the settings with your own trade plan, keep the chart readable, and let confluence—not clutter—do the heavy lifting.
Kernal
PolyFilter [BackQuant]PolyFilter
A flexible, low-lag trend filter with three smoothing engines—optimized for clean bias, fewer whipsaws, and clear alerting.
What it does
PolyFilter draws a single “intelligent” baseline that adapts to price while suppressing noise. You choose the engine— Fractional MA , Ehlers 2-Pole Super Smoother , or a Multi-Kernel blend . The line can color itself by slope (trend) or by position vs price (above/below), and you get four ready-made alerts for flips and crosses.
What it plots
PolyFilter line — your smoothed trend baseline (width set by “Line Width”).
Optional candle & background coloring — choose: color by trend slope or by whether price is above/below the filter.
Signal markers — Arrows with L/S when the slope flips or when price crosses the line (if you enable shapes/alerts).
How the three engines differ
Fractional MA (experimental) — A power-law weighting of past bars (heavier focus on the most recent samples without throwing away history). The Adaptation Speed acts like the “fraction” exponent (default 0.618). Lower values lean more on recent bars; higher values spread weight further back.
Ehlers 2-Pole Super Smoother — Classic low-lag IIR smoother that aggressively reduces high-frequency noise while preserving turns. Great default when you want a steady, responsive baseline with minimal parameter fuss.
Multi-Kernel — A 70/30 blend of a Gaussian window and an exponential kernel. The Gaussian contributes smooth structure; the exponential adds a hint of responsiveness. Useful for assets that oscillate but still trend.
Reading the colors
Trend mode (default) — Line & candles turn green while the filter is rising (signal > signal ) and red while it’s falling.
Above/Below mode — Line & candles reflect price’s position relative to the filter: green when price > filter, red when price < filter. This is handy if you treat the filter like a dynamic “fair value” or bias line.
Inputs you’ll actually use
Calculation Settings
Price Source — Default HLC/3. Switch to Close for stricter trend, or HLC3/HL2 to soften single-print spikes.
Filter Length — Window/period for all engines. Shorter = snappier turns; longer = smoother line.
Adaptation Speed — Only affects Fractional MA . Lower it for faster, more local weighting; raise it for smoother, more global weighting.
Filter Type — Pick one of: Fractional MA, Ehlers 2-Pole, Multi-Kernel.
UI & Plotting
Color based off… — Choose Trend (slope) or > or < Close (position vs price).
Long/Short Colors — Customize bull/bear hues to your theme.
Show Filter Line / Paint candles / Color background — Visual toggles for the line, bars, and backdrop.
Line Width — Make the filter stand out (2–3 works well on most charts).
Signals & Alerts
PolyFilter Trend Up — Slope flips upward (the filter crosses above its prior value). Good for early continuation entries or stop-tightening on shorts.
PolyFilter Trend Down — Slope flips downward. Often used to scale out longs or rotate bias.
PolyFilter Above Price — The filter line crosses up through price (filter > price). This can confirm that mean has “caught up” after a pullback.
PolyFilter Below Price — The filter line crosses down through price (filter < price). Useful to confirm momentum loss on bounces.
Quick starts (suggested presets)
Intraday (5–15m, crypto or indices) — Ehlers 2-Pole, Length 55–80. Trend coloring ON, candle paint ON. Look for pullbacks to a rising filter; avoid fading a falling one.
Swing (1H–4H) — Multi-Kernel, Length 80–120. Background color OFF (cleaner), candle paint ON. Add a higher-TF confirmation (e.g., 4H filter rising when you trade 1H).
Range-prone FX — Fractional MA, Length 70–100, Adaptation ~0.55–0.70. Consider Above/Below mode to trade mean reversion to the line with a strict risk cap.
How to use it in practice
Bias line — Trade in the direction of the filter slope; stand aside when it flattens and color chops back and forth.
Dynamic support/resistance — Treat the line as a moving value area. In trends, entries often appear on shallow tags of the line with structure confluence.
Regime switch — When the filter flips and holds color for several bars, tighten stops on the opposing side and look for first pullback in the new color.
Stacking filters — Many users run PolyFilter on the active chart and a slower instance (longer length) on a higher timeframe as a “macro bias” guardrail.
Tuning tips
If you see too many flips, lengthen the filter or switch to Multi-Kernel.
If turns feel late, shorten the filter or try Ehlers 2-Pole for lower lag.
On thin or very noisy symbols, prefer HLC3 as the source and longer lengths.
Performance note: very large lengths increase computation time for the Multi-Kernel and Fractional engines. Start moderate and scale up only if needed.
Summary
PolyFilter gives you a single, trustworthy baseline that you can read at a glance—either as a pure trend line (slope coloring) or as a dynamic “above/below fair value” reference. Pick the engine that matches your market’s personality, set a sensible length, and let the color and alerts guide bias, entries on pullbacks, and risk on reversals.

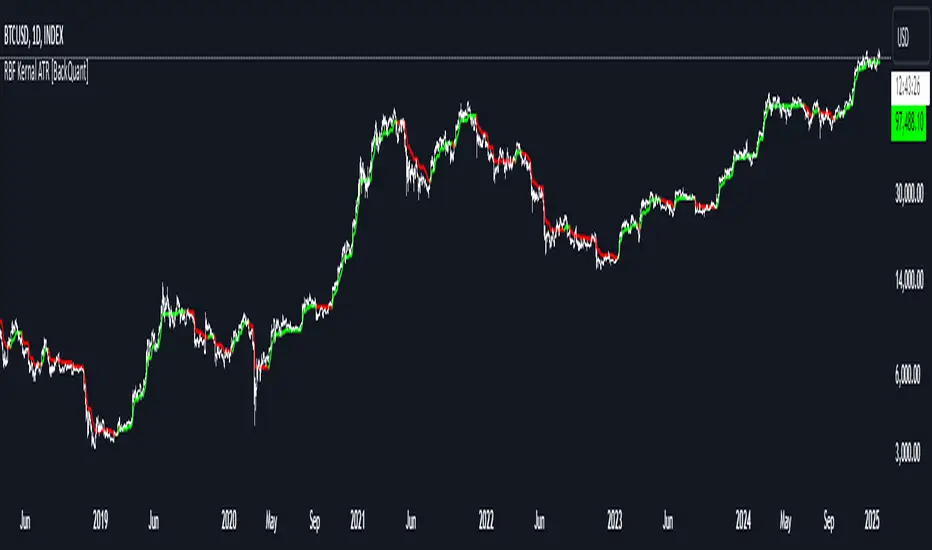
Radial Basis Kernal ATR [BackQuant]Radial Basis Kernel ATR
The Radial Basis Kernel ATR is a trading indicator that combines the classic Average True Range (ATR) with advanced Radial Basis Function (RBF) kernel smoothing . This innovative approach creates a highly adaptive and precise tool for detecting volatility, identifying trends, and providing dynamic support and resistance levels.
With its configurable parameters and ability to adjust to market conditions, this indicator offers traders a robust framework for making informed decisions across various assets and timeframes.
Key Feature: Radial Basis Function Kernel Smoothing
The Radial Basis Function (RBF) kernel is at the heart of this indicator, applying sophisticated mathematical techniques to smooth price data and calculate an enhanced version of ATR. By weighting data points dynamically, the RBF kernel ensures that recent price movements are given appropriate emphasis without overreacting to short-term noise.
The RBF kernel uses a gamma factor to control the degree of smoothing, making it highly adaptable to different asset classes and market conditions:
Gamma Factor Adjustment :
For low-volatility data (e.g., indices), a smaller gamma (0.05–0.1) ensures smoother trends and avoids overly sharp responses.
For high-volatility data (e.g., cryptocurrencies), a larger gamma (0.1–0.2) captures the increased price fluctuations while maintaining stability.
Experimentation is Key : Traders are encouraged to backtest and visually compare different gamma values to find the optimal setting for their specific asset and strategy.
The gamma factor dynamically adjusts based on the variance of the source data, ensuring the indicator remains effective across a wide range of market conditions.
Average True Range (ATR) with Dynamic Bands
The ATR is a widely used volatility measure that captures the degree of price movement over a specific period. This indicator enhances the traditional ATR by integrating the RBF kernel, resulting in a smoothed and adaptive ATR calculation.
Dynamic bands are created around the RBF kernel output using a user-defined ATR factor , offering valuable insights into potential support and resistance zones. These bands expand and contract based on market volatility, providing a visual representation of potential price movement.
Moving Average Confluence
For additional confirmation, the indicator includes the option to overlay a moving average on the smoothed ATR. Traders can choose from several moving average types, such as EMA , SMA , or Hull , and adjust the lookback period to suit their strategy. This feature helps identify broader trends and potential confluence areas, making the indicator even more versatile.
Long and Short Trend Detection
The indicator provides long and short signals based on the directional movement of the smoothed ATR:
Long Signal : Triggered when the ATR crosses above its previous value, indicating bullish momentum.
Short Signal : Triggered when the ATR crosses below its previous value, signaling bearish momentum.
These trend signals are visually highlighted on the chart with green and red bar coloring (optional), providing clear and actionable insights.
Customization Options
The Radial Basis Kernel ATR offers extensive customization options, allowing traders to tailor the indicator to their preferences:
RBF Kernel Settings
Source : Select the price data (e.g., close, high, low) used for the kernel calculation.
Kernel Length : Define the lookback period for the RBF kernel, controlling the smoothing effect.
Gamma Factor : Adjust the smoothing sensitivity, with smaller values for smoother trends and larger values for responsiveness.
ATR Settings
ATR Period : Set the period for ATR calculation, with shorter periods capturing more short-term volatility and longer periods providing a broader view.
ATR Factor : Adjust the scaling of ATR bands for dynamic support and resistance levels.
Confluence Settings
Moving Average Type : Choose from various moving average types for additional trend confirmation.
Moving Average Period : Define the lookback period for the moving average overlay.
Visualization
Trend Coloring : Enable or disable bar coloring based on trend direction (green for long, red for short).
Background Highlighting : Add optional background shading to emphasize long and short trends visually.
Line Width : Customize the thickness of the plotted ATR line for better visibility.
Alerts and Automation
To help traders stay on top of market movements, the indicator includes built-in alerts for trend changes:
Kernel ATR Trend Up : Triggered when the ATR indicates a bullish trend.
Kernel ATR Trend Down : Triggered when the ATR signals a bearish trend.
These alerts ensure traders never miss important opportunities, providing timely notifications directly to their preferred device.
Suggested Gamma Values
The effectiveness of the gamma factor depends on the asset type and the selected kernel length:
Low Volatility Assets (e.g., indices): Use a smaller gamma factor (approximately 0.05–0.1) for smoother trends.
High Volatility Assets (e.g., crypto): Use a larger gamma factor (approximately 0.1–0.2) to capture sharper price movements.
Experimentation : Fine-tune the gamma factor using backtests or visual comparisons to optimize for specific assets and strategies.
Trading Applications
The Radial Basis Kernel ATR is a versatile tool suitable for various trading styles and strategies:
Trend Following : Use the smoothed ATR and dynamic bands to identify and follow trends with confidence.
Reversal Trading : Spot potential reversals by observing interactions with dynamic ATR bands and moving average confluence.
Volatility Analysis : Analyze market volatility to adjust risk management strategies or position sizing.
Final Thoughts
The Radial Basis Kernel ATR combines advanced mathematical techniques with the practical utility of ATR, offering traders a powerful and adaptive tool for volatility analysis and trend detection. Its ability to dynamically adjust to market conditions through the RBF kernel and gamma factor makes it a unique and indispensable part of any trader's toolkit.
By combining sophisticated smoothing , dynamic bands , and customizable visualization , this indicator enhances the ability to read market conditions and make more informed trading decisions. As always, backtesting and incorporating it into a broader strategy are recommended for optimal results.
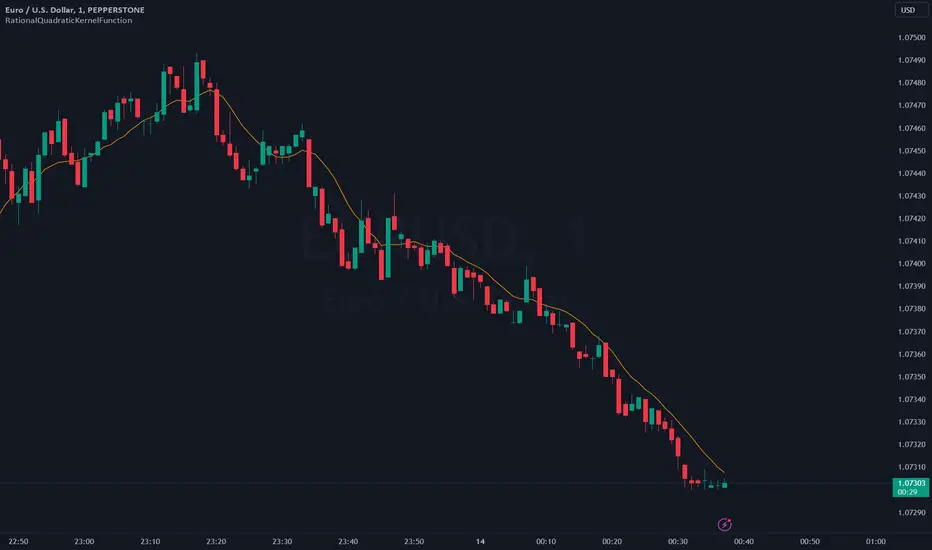
RationalQuadraticKernelFunctionDescription:
An optimised library for non-repainting Rational Quadratic Kernel Library. Added lookbackperiod and a validation to prevent division by zero.
Thanks to original author jdehorty.
Usage:
1. Import the library into your Pine Script code using the library function.
import vinayakavajiraya/RationalQuadraticKernelFunction/1
2. Call the Main Function:
Use the rationalQuadraticKernel function to calculate the Rational Quadratic Kernel estimate.
Provide the following parameters:
`_src` (series float): The input series of float values, typically representing price data.
`_lookback` (simple int): The lookback period for the kernel calculation (an integer).
`_relativeWeight` (simple float): The relative weight factor for the kernel (a float).
`startAtBar` (simple int): The bar index to start the calculation from (an integer).
rationalQuadraticEstimate = rationalQuadraticKernel(_src, _lookback, _relativeWeight, startAtBar)
3. Plot the Estimate:
Plot the resulting estimate on your TradingView chart using the plot function.
plot(rationalQuadraticEstimate, color = color.red, title = "Rational Quadratic Kernel Estimate")
Parameter Explanation:
`_src`: The input series of price data, such as 'close' or any other relevant data.
`_lookback`: The number of previous bars to consider when calculating the estimate. Higher values capture longer-term trends.
`_relativeWeight`: A factor that controls the importance of each data point in the calculation. A higher value emphasizes recent data.
`startAtBar`: The bar index from which the calculation begins.
Example Usage:
Here's an example of how to use the library to calculate and plot the Rational Quadratic Kernel estimate for the 'close' price series:
//@version=5
library("RationalQuadraticKernelFunctions", true)
rationalQuadraticEstimate = rationalQuadraticKernel(close, 11, 1, 24)
plot(rationalQuadraticEstimate, color = color.orange, title = "Rational Quadratic Kernel Estimate")
This example calculates the estimate for the 'close' price series, considers the previous 11 bars, assigns equal weight to all data points, and starts the calculation from the 24th bar. The result is plotted as an orange line on the chart.
Highly recommend to customize the parameters to suit your analysis needs and adapt the library to your trading strategies.