[astropark] Fair Value GapsDear Followers,
today a new epic tool, the "Fair Value Gap (FVG) Finder" .
Fair Value Gaps are quite important to trade, as they represent both volume and trading unfilled gaps, which most of the time are filled and then price reverse .
This indicator will let you set alerts on when a new FVG is found and when it is filled.
Traded together with Breaker Blocks (BB) and Supply/Demand Order Blocks (OB) , you can easily spot important points where to start a short or a long trade.
Here my Breaker Blocks (BB) and Supply/Demand Order Blocks (OB) indicator
Here below some examples on how to use the indicator.
On Bitcoin
On EURUSD
PANJANG


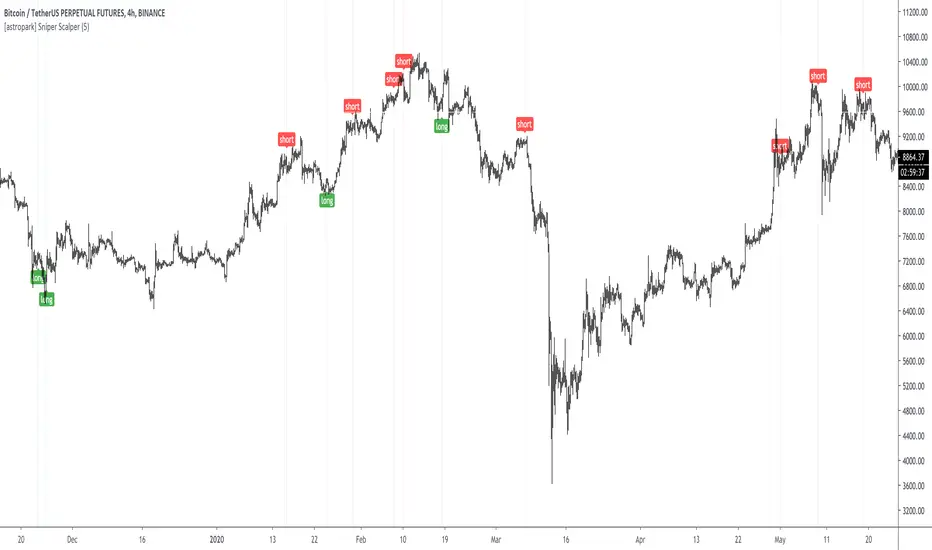
[astropark] Sniper ScalperDear Followers,
today a new Scalper Tool , which works great on all timeframes , from 1 minute to 1 month!
Keep in mind that this is a Scalper, so it's always a good idea to take or lock your profits, despite you may use it also for swing trading.
This tool has some cool features:
it works on all timeframes , from 1 minute to 1 month!
you can change a filter option from 1 (lowest) to 7 (highest)
Here some examples on how it performs on many timeframes and charts.
EURUSD 15m chart
AMZN 1h chart
Bitmex XBTUSD 4h chart
Bitfinex ETHUSD 1h chart
Binance Chainlink LINKBTC 1h chart
Binance Ethereum ETHBTC 1h chart
GOLD XAUUSD 15m chart
The user who wants to use this strategy, especially via an automated bot, must always manage to set a take profit and stoploss, as well as use a proper money and risk management strategies .
This is not the "Holy Grail", so use it with caution.
This is a premium indicator , so send me a private message in order to get access to this script.
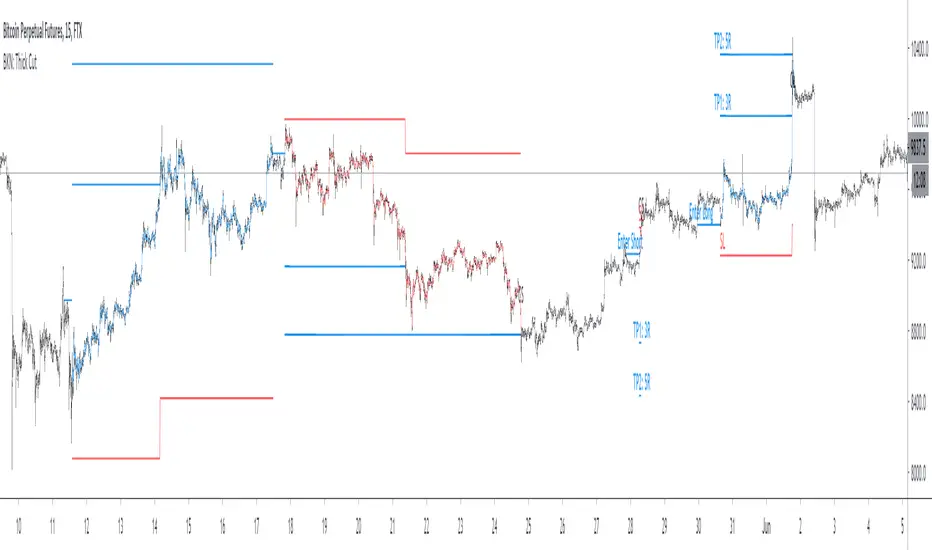
BKN: Thick CutThick Cut is the juiciest BKN yet. This indicator is created to take a profitable trading strategy and turn it into an automated system. We've built in several pieces that professional traders use every day and turned it into an algo that produces on timeframes as low as 1, 3, and 5 minutes!
Limit Order Entries: When criteria is met, an alert is signaled that will send a value to enter a position at a limit price.
Built in Stop Loss: A stop is built in and the value can be sent to your bot using the {{plot}} function or you can rely on a TradingView alert when the stop is hit.
Built in Take Profits: We've built in two separate take profits and the ability to move your stop loss to breakeven after the first take profit is hit. Even if you take 50% profit at 1R and move your stop loss, you already have a profitable trade. Test results show 50% profits at 2R and the remainder at higher returns result in exceptional results.
Position Sizing: We've built in a position size based on your own predetermined risk. Want to risk $100 per trade? Great, put in 100 in the inputs and reference a quantity of {{plot("Position Size")}} in your alert to send a position size to the bot. You can also reference {{plot("Partial Close")}} to pull 50% of the position size closing 50% at TP1 and 50% at TP2.
Backtest results shown are very short term since we are viewing a 15m chart. This can be a profitable strategy on many timeframes, but lower timeframes will maximize results.
A unique script with incredible results. Further forward testing is live.
***IMPORTANT***
For access, please do not comment below. Comments here will not be replied to. Please send a DM here or on my linked Twitter . At this time, this strategy is considered a Beta release as we continue to fine tune settings and more. Expecting 2 weeks of beta with official release around June 6.
ATR Stop Loss LONG/SHORT by melihgulerYou can monitor the stop loss level according to ATR in 2 ways (Long/Short).

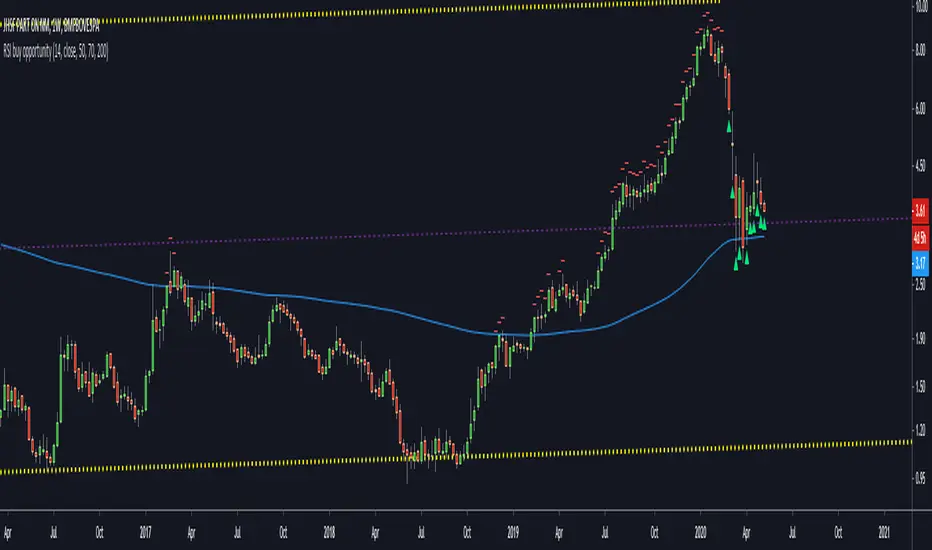
RSI buy opportunityRSI buy opportunity is an indicator to look for the best entries on weekly charts.
It depends on each stock and the values should change to optimize the entry.
Buy when green triangle shows up.
Never buy when red signal appears.
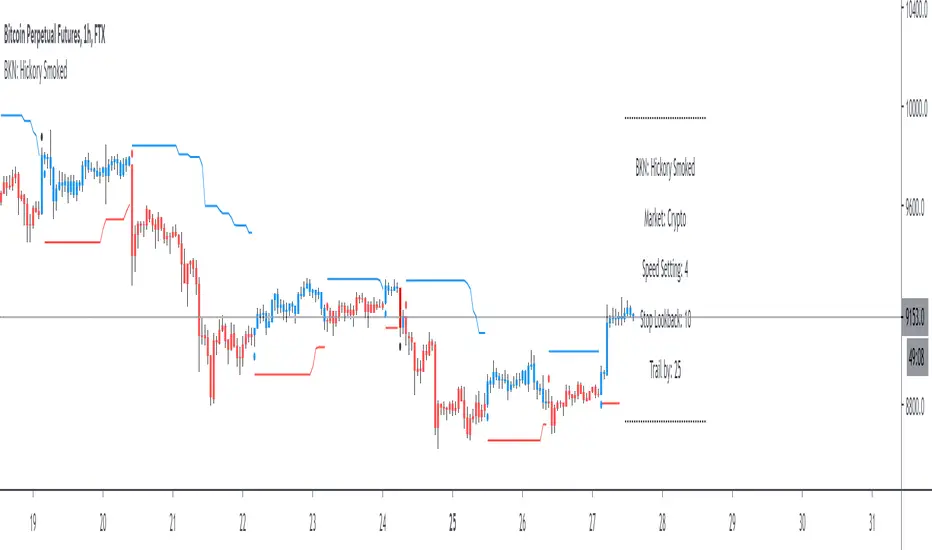
BKN: Hickory SmokedWelcome to the BKN: Hickory Smoked Indicator. This is an algorithmic indicator that thrives in trending environments. We've included settings for crypto and forex and speed options for lower timeframe entries.
The script offers a stop loss or trailing stop loss that will trigger when an entry is triggered. You can also choose to use it as long or short only.
This indicator is automation ready with alerts for both opening and closing positions.
***IMPORTANT***
For access, please do not comment below. Instead, send a DM here on TradingView or on my linked Twitter account.
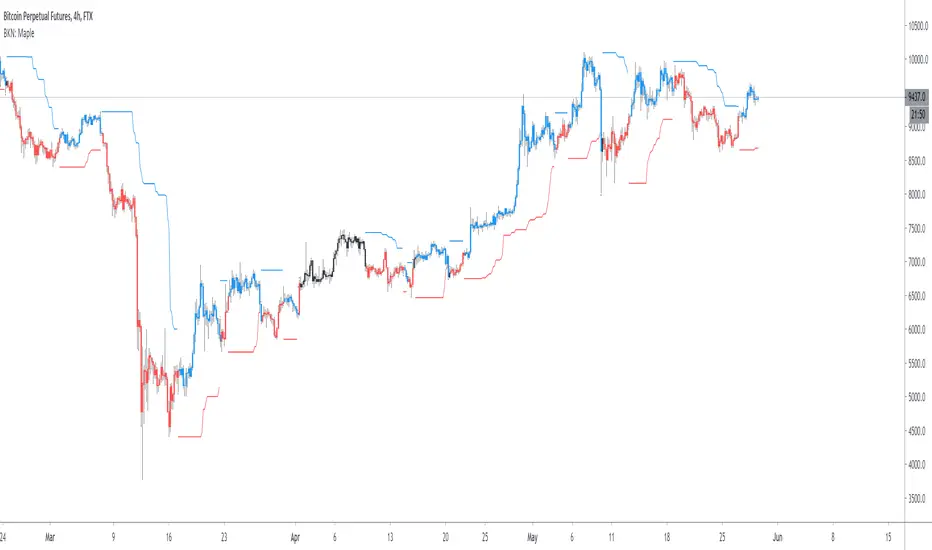
BKN: MapleThis strategy is tied to the BKN: Maple indicator which is an automation ready algo for entering/exiting trades. The script comes prepared with a stop loss and trailing stop loss so that you don't have to host your stop on the exchange and can also optimize trade entries and exits.
We've released optimizations for Forex and Crypto on multiple timeframes, but the script shines on the one and four hour charts.
***IMPORTANT***
For access, please do not comment below. Access requests in the comments will not be responded to.
Instead, please send a DM or reach out to my linked Twitter account.
Kitsune's Long/Short Support v1.0.0After reviewing all feedback and questions I got from the users of my previously published script (Kitsune Indicator Collection), I decided to publish a new one which is easier to interpret and use. Therefore the script is as clean as possible thereby minimizing visual clutter (or at least I tried ).
This script is an evolution of my precious script and is still a combination of the following items:
- High-Low detector
- Parabolic SAR (Stop and Reversal) setups and triggers
- Ehlers Instantaneous Trendline (EIT) indicator
- Range detector
- Support and Resistance detector
- Daily/Weekly/Monthly open visualization
The script uses the SAR and EIT to detect long/short signals.
-----------------------------------------------------------------------------------------------------------------------------------------------
A signal is decided to be STRONG when SAR trigger coincides with trend reversal of the EIT.
A STRONG long signal is painted (i.e. blue label with L+) when:
- SAR long trigger (blue arrow) coincides with an EIT crossover (blue line crosses over the red line).
A STRONG short signal is painted (i.e. red label with S+) when:
- SAR short trigger (red arrow) coincides with an EIT cross-under (blue line crosses under red line).
A STRONG signal will always result in entering (if not in any position) or flipping a long/short position.
-----------------------------------------------------------------------------------------------------------------------------------------------
A signal is decided to be WEAK when not in a long or short position and a SAR trigger appears.
A WEAK long signal is painted (i.e. blue label with L-) when:
- Not in a position (gray bars) and a SAR long trigger (blue arrow) appears but not coinciding with an EIT crossover.
A WEAK short signal is painted (i.e. red label with S-) when:
- Not in a position (gray bars) and a SAR short trigger (red arrow) appears but not coinciding with an EIT cross-under.
A WEAK signal will only result in a long/short position when not in any position.
-----------------------------------------------------------------------------------------------------------------------------------------------
A long/short position is exited on a trend reversal of the EIT.
A short position is exited (i.e. red x-cross) when:
- A crossover of the EIT happens (blue line crosses over the red line).
A long position is exited (i.e. blue x-cross) when:
- A cross-under of the EIT happens (blue line crosses under the red line).
-----------------------------------------------------------------------------------------------------------------------------------------------
Color of the bars are depend on position type:
- Blue = Long position
- Red = Short position
- Gray = No position
-----------------------------------------------------------------------------------------------------------------------------------------------
Enjoy using the script. I hope it is of value to you!
If you have any questions, don't hesitate to contact me.
With kind regards,
Kitsune (L3F03X)

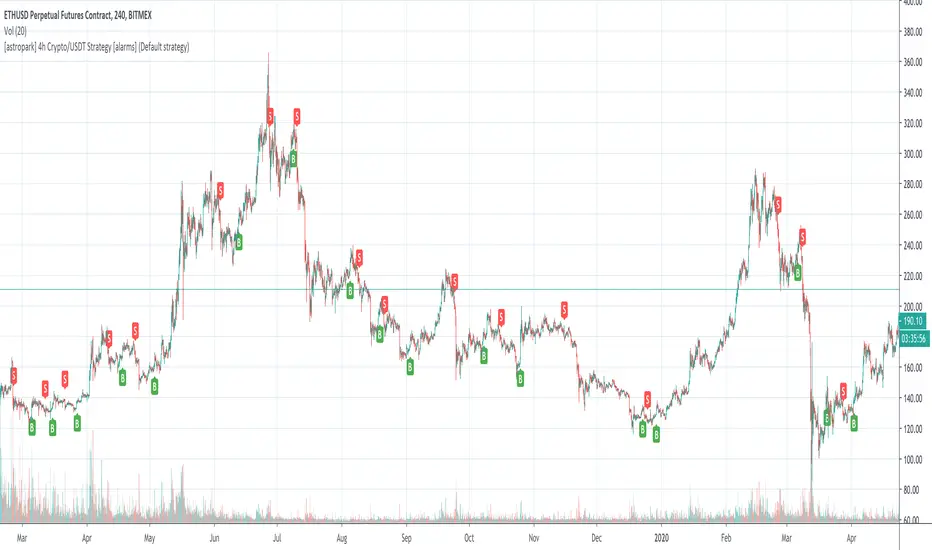
[astropark] 4h Crypto/USDT Strategy [alarms]Dear Followers,
today a new Swing and Scalper Tool , which works great for Cryptocurrencies on the USDT market on 4h timeframe .
This tool has some cool features:
it works on many timeframes, but best one is 4H timeframe : so you can enjoy both manual and bot trading by using a 24/7 running bot;
it comes in three working mode : default, alternative and high frequency ;
auto-stoploss: you can enable an stoploss in trade, bot will follow
It's always suggested to use a proper money and risk management in trades. This is not the "Holy Grail", it does not exist.
Strategy results are calculated from the beginning of 2018 till now, so more than 2 years, using 10000$ as initial capital and working at 1x leverage (no leverage at all!) and 0.1% trading fee already applied.
You can always DM me if you need any help to configure it on your preferred chart or if you want a customization of this bot for a specific pair.
This script will let you set all notification alerts you may need in order to be alerted on each triggered signals.
The one for backtesting purpose can be found by searching for the astropark's "4h Crypto/USDT Strategy" and then choosing the indicator with "strategy" suffix in the name, or you can find here below
This is a premium indicator , so send me a private message in order to get access to this script.
SuperStoch EnhancedShort Stochastic, Long Stochastic and Super Signal in 1 neatly packaged indicator with customizable inputs.

™TʀᴀᴅᴇCʜᴀʀᴛɪsᴛ Tʀᴇɴᴅsᴇᴛᴛᴇʀ™TradeChartist Trendsetter is an elegantly designed functional indicator that helps spot price trends based on user input and volatility to generate high probability BUY and SELL signals.
1. What does ™TradeChartist Trendsetter do?
Plots high probability BUY/SELL signals based on user input and price volatility.
Plots recommended Stop Loss and SOS signals.
Plots regular RSI divergences based on user input.
Plots Linear Regression trend lines based on user input.
Displays Trendsetter Dashboard with useful trade information.
Displays real time gains tracker.
Tracks another symbol on Dashboard based on user input.
Alerts when BUY and SELL signals are generated.
2. What markets can this indicator be used on?
Forex
Stocks - Signal prices calculated taking gaps into account.
Commodities
Cryptocurrencies
and almost any asset on Trading View.
Works really well when there is good volume, volatility or both in the asset traded/observed.
3. Do the indicator signals repaint?
No. Once the BUY and SELL signals are generated with entry price (open price of signal candle), there is no repainting.
This can be verified using Trading View Bar Replay to check if the signals stay in the same candle in real-time as the Bar Replay.
4. Does the indicator send alerts when a signal is generated?
Yes. Traders can get alerts by setting up Trading View alerts for BUY/SELL signals. For confirmed BUY/SELL alerts, 'Once Per Bar' must be used as there is no need to wait for the candle close.
Example Charts
GBP-USD 1hr chart with indicator plots description
GOLD 4hr chart using Daily HTF resolution from indicator settings.
SPX 15m chart using Daily HTF resolution with RSI divergences.
Note: Default settings work really well for most assets and time frames. Change HTF resolution (default 4hr) from indicator settings and make sure it is higher time frame than the chart resolution.

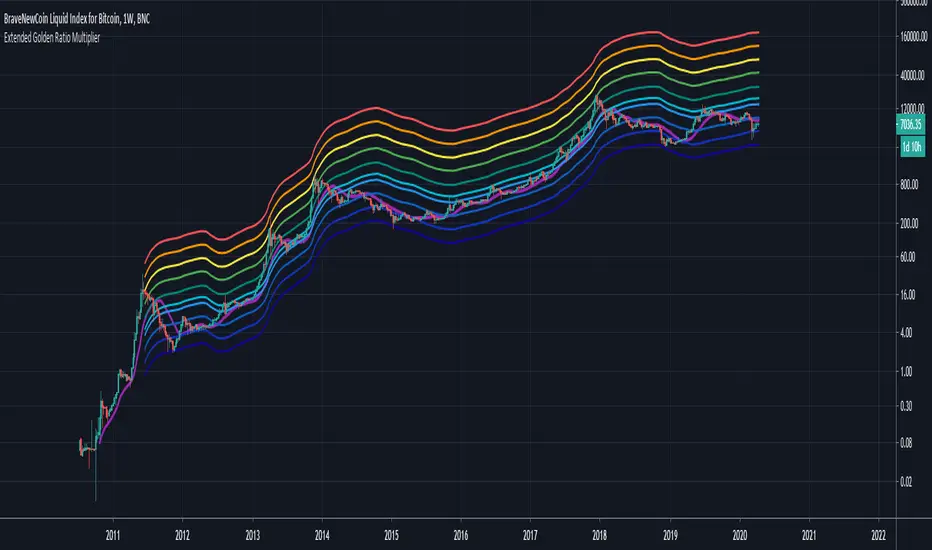
Extended Golden Ratio Fibonacci Multiplier + Pi Cycle TopHere I present the Golden Ratio Multiplier and Pi Cycle Top Indicator originally conceptualized by Philip Swift, and extend it. Due to popular demand for a nicer looking color scheme and added MAs & functionalities, I decided to publish this indicator, of course with free access for everyone as the discovery is attributed to Philip. The indicator works best for BLX (BraveNewCoin Liquid Index for Bitcoin) on daily (D) or weekly (W) timeframe. Other timeframes are not supported (and also generally not needed as this is a rather high timeframe indicator).
Added functionality:
- Additional Fibonacci MAs for Bottom: 0.618*MA(50W) and 0.382*MA(50W), which seem to be distinct high timeframe support MAs
- Pi Cycle Top and all Fibonacci MAs can be plotted or hidden individually
- Correct MA values for daily (D) and weekly (W) timeframes are automatically assigned, so you do not need to change anything when you switch between those timeframes.
It is generally said that Bitcoin's peaks always only reach a lower yearly Fibonacci MA. The next one to eye would be the 3*MA(50W) = 3*MA(350D) here plotted in dark green. Historically when the MA(16W) = MA(111D) (here plotted in magenta) line crossed the 2*MA(50W) = 2*(350D) line (plotted in cyan) from below a cycle peak is reached. This indicator might therefore be a good high timeframe indicator for Bitcoin trading. Of course this is no financial advice.
Mionne LongShort Swing ViewThis is a Beta Version from a LongShort Swing View
Inspired by CryptoAman better know as ACEACEACE
At the moment it based on a 5 min. Chart
Shows possible Entrys and Exits from Longs on 5 Minutes Swings

Theft Indicator - BUY/SELL AlertsWhat is our indicator?
Theft Indicator - Buy & Sell Alert System is our first published script that shows price action on a certain period of time (We Use ATR indicator). We take pride in enabling trading to become easier for the experienced and the non-experienced traders around the globe. Buy & Sell alerts will be fired once a conditions in our algo is met.
Does it Repaint?
Our indicator does NOT re-paint. Although while setting an alert it may pop up the repaint alert, please take into consideration that once a signal is fired on a "CLOSED BAR", our signal will never disappear, they do not repaint.
What Markets is it usable with?
You can use it in any market, Forex, Stocks, Crypto, Indices. We recommend high time frames but you can also use it on the 1 minute chart if you are a scalper and a risk taker. All time frames are profitable, not all trades. But the Majority is profitable. We will soon add a backtest strategy for it, there is no ETA on it tho.
How to use:
Simple plug and play it to your chart, in addition to a few other indicators we will recommend to you (we still have not published them yet), and this will confirm your trades. You can also connect TV alerts with a bot and let it run. Please be aware that SLIPPAGE time is important, If you run a bot on this indicator you HAVE to know that the buy/sell price will be on the bar AFTER the Candle close (For example: the BUY/SELL alert is on a candle, the buy/sell your bot or you will execute WILL be in the following candle depending on your trading system. Theft Indicator - Buy/Sell Alerts work best with higher time frames, however it works on smaller time frames, we recommend 15 mins, 30 mins, 1hr, 4hr. It just depends on your trading style. Please contact us if you do not understand how to use it.
How are the Buy/Sell Alerts fired?
We use the simple ATR (Average True Range) indicator. However we have modified the indicator to fit our trading system. Check below for a definition of what ATR is:
What is Average True Range - ATR?
The average true range (ATR) is a technical analysis indicator that measures market volatility by decomposing the entire range of an asset price for that period. Specifically, ATR is a measure of volatility introduced by market technician J. Welles Wilder Jr. The true range indicator is taken as the greatest of the following: current high less the current low; the absolute value of the current high less the previous close; and the absolute value of the current low less the previous close. The average true range is then a moving average, generally using 14 days, of the true ranges.
Why is our indicator special and different from the normal ATR indicators?
We have modified the mathematical equation and changed it slightly to give more accurate signals, we do not promise all trades are profitable, the use of this indicator is up to your own judgement and liability. We believe that we have an indicator like no other ATR because of our algo that is different from the normal ATR calculation.
P.S: This is not financial advice, we are just sharing our indicator that we know has good results, and it will take time for people in -ve profiles to recover losses and for the profiting to be more profitable.
You can contact me for more information about the indicator, Goodluck :)

Bitcoin: Price Action Integral BandsThis indicator tries to display absolute tops and bottoms for Bitcoin. The price action gets integrated with two custom functions resulting in the blue top and red bottom price action integrals. From those integral values we allow 5% deviation in up and down direction, leading to price action integral bands of some non-zero width.
Even in the current liquidity crisis with abnormal price movements, Bitcoin had no weekly candle close below the support band. One thing to note is that in the here presented model, up until now only one single weekly candle touches the blue band in each of Bitcoin's cycles. For longer-term trades it might be a good idea to buy BTC when price is around the red band, and sell/go short when BTC is around the blue band, although this is no financial advice and one should always cross-check with other indicators/informations.
There's the option to plot or hide the bands individually.
The integral bands are specifically designed for the Bitcoin BLX (BraveNewCoin Liquid Index) ticker on weekly timeframe. For other assets, tickers and timeframes the functionality of this indicator cannot be guaranteed and will most probably not deliver meaningful results.

TSSPRO TrendIndicatorBased on analysis of trend deviation this indicator also has filter with x bars after RSI overbought/oversell zones from settings.
Indicator has alerts for LONG(BUY)/SHORT(SELL) signals with green/red arrows and LONG/SHORT labels. Fits for BTC and any altcoins.
Good for both scalping and position trading (depends on timeframe that you use)
Script settings are short and here you can specify:
1) Signal length, 12 by default.
2) Enable/Disable filter to show signals only after RSI overbought/oversell zones
Disabled by defaults and RSI is 65 for upper zone and 35 for lower zone.
You can also specify how many bars back before current bar this filter must do. It's 10 by default, you can vary it up to 90.
This is invite only script. PM me if you want to test it.

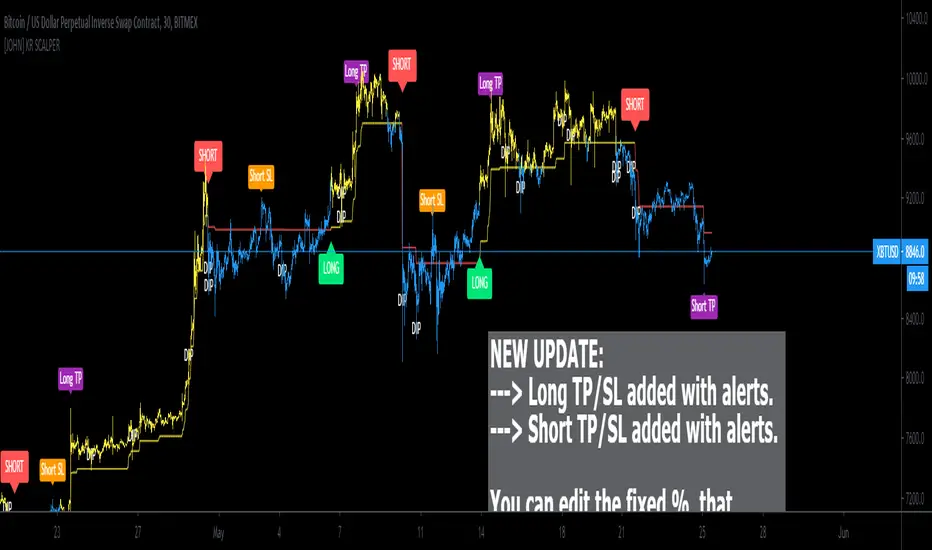
[JOHN] KR SCALPERHello this is KR SCALPER indicator. (work on crypto market)
---------------------------------
How this indicator work?
KR SCALPER script work with bollinger bands, price volatility and ATR (average true range).
This system provide
- HIGH QUALITY BUY/SELL Signals with a reasonable ROI.
- DIPS noted on chart with "DIP" TEXT, thanks to the use of bbands parameters.
- Work in cryptocurrency market, tested with top 10 coins, with good results.
- Tested on LTF (from 5m to 1h), work even on 4h, 1d.
How use it?
Indicator is setup for cryptocurrency. You can long and short by following the indications below:
GREEN LABEL = LONG
RED LABEL = SHORT
DIP noted on chart
This system write on chart with "DIP" text whenever a decrease of price/selloff occour, usually a good place to make attention if you are looking for a trade.
This is possible with the use of Bbands that helped me on this add.
Below some timeframes examples.
5 minute chart
15 minute chart
1H timeframe chart
4H timeframe chart
Below ETH USD 4H timeframe chart for reference.
----------------------------------
I hope you like and enjoy.
Good trading traders!
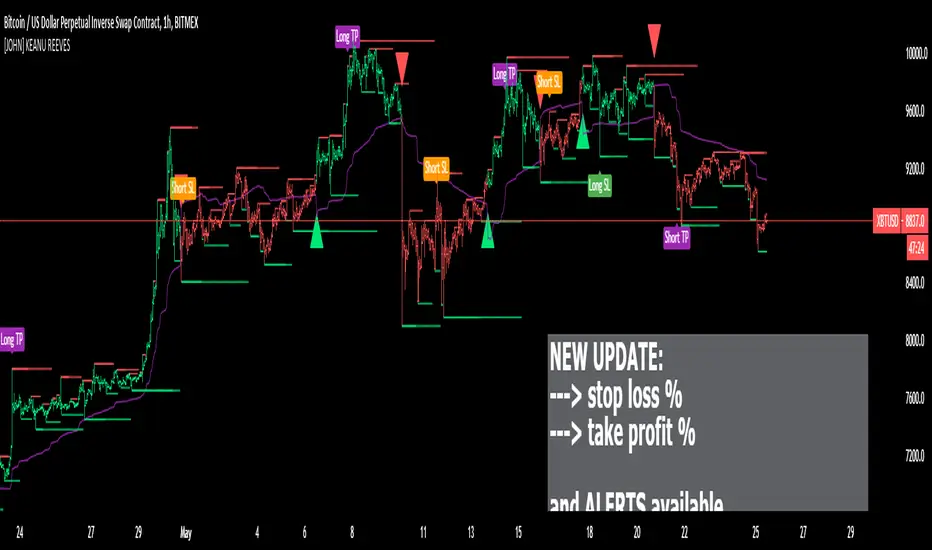
[JOHN] KEANU REEVESHello this is KEANU REEVES indicator. (Ideal for crypto)
---------------------------------
How this indicator work?
KEANU REEVES work with ATR, integrated with high and low system.
Support/resistance area as high/low. Check the images below.
This system provide high profitable signal with every pair and coins, with all timeframes.
Below last daily signal ROI
BITCOIN
ETH ROI
Some other timeframes WEEKLY AND H4 Bitcoin chart
Some other exmple EOS and ETH other perspective (different parameters)
[JOHN] SUPER BOSSHello this is SUPER BOSS indicator.
---------------------------------
How this indicator work?
SUPER BOSS work in sync with KNIFE CUT script.
This indicator provide trendline to check the trend and support/resistance areas.
Check the images below.
The system work with moving averages (you can choose your favorite with 8 different type).
Support and resistance work with rsi conditions.
This script work with every pair and market, with all timeframes.
OverBought, Oversold candles
Green line is a LONG, Red line is a SHORT.
4H example, work with all timeframes also for excellent 15m scalping.
Some other big % ROI examples
Many opportunities.
Tried this with 15m timeframe trading and the result is incredible.

Bitcoin Futures SentimentMonitors the sentiment across Bitcoin Futures, large discrepancies indicate potential low risk (buy/green) and high risk (sell/red) zones.

[astropark] ALGO Trading V3 [alarms]Dear Followers,
today another awesome Swing and Scalping Trading Strategy indicator, runnable on a bot , which works great on many timeframes (from 1h and above is suggested), just write me in order to help you find correct settings).
It must be said that this strategy works even better on 1m Renko chart!
If you are a scalper or you are a swing trader, you will love suggested entries for fast and long-lasting profit.
Keep in mind that a proper trailing stop strategy and risk management and money management strategies are very important (DM me if you need any clarification on these points).
This is not an evolution of "ALGO Trading V1" or "ALGO Trading V2" , but a twin sister of them.
For your reference, here it is the "ALGO Trading V1" indicator
and here the "ALGO Trading V2"
This strategy has the following options:
enable/disable signals on chart
enable/disable bars and background coloring based on trend
enable/disable a "filter noise" option , which try to reduce overtrading (you can easily check it on backtesting)
enable/disable a Take Profit / Stop Loss option (you can easily check it on backtesting too)
enable/disable a secret SmartOption which may improve profit on your chart (again, check it on you chart if it helps or not)
This strategy only trigger 1 buy or 1 sell. If you enable Take Profit / Stop Loss option, consider that many TP can be triggered before trend reversal, so take partial profit on every TP an eventually buy/sell back lower/higher to maximize your profit.
This script will let you set all notifications you may need in order to be alerted on each triggered signals.
The one for backtesting purpose can be found by searching for the astropark's "ALGO Trading V3" and then choosing the indicator with "strategy" suffix in the name, or you can find here below
Strategy results are calculated on the time window from 1995 to now, so on more than 15 years, using 1000$ as initial capital and working at 1x leverage (so no leverage at all! If you like to use leverage, be sure to use a safe option, like 3x or 5x at most in order to have liquidation price very far).
This is not the "Holy Grail", so use a proper risk management strategy.
This script will let you backtest how the indicator will perform on any chart and timeframe you may like to test and/or trade. Of course results will be very different depending on the chart and timeframe you will open. I tested a lot of charts and always you can find a combination that keep this strategy in profit on swing trading style (and this means that if you can have a daily look at the chart you can always manage to maximize your profit on each trade!)
This is a premium indicator , so send me a private message in order to get access to this script.

[astropark] ALGO Trading V2 [alarms]Dear Followers,
today another awesome Swing and Scalping Trading Strategy indicator, runnable on a bot , which works great on many timeframes (ones between 1h and 1D are suggested, but just write me in order to help you find correct settings).
It must be said that this strategy works even better on 1m Renko chart!
If you are a scalper or you are a swing trader, you will love suggested entries for fast and long-lasting profit.
Keep in mind that a proper trailing stop strategy and risk management and money management strategies are very important (DM me if you need any clarification on these points).
This is not an evolution of "ALGO Trading V1" or "ALGO Trading V3" , but a twin sister of them. Search them on TradingView to know them better.
Here you can find ALGO Trading V1
This strategy has the following options:
enable/disable signals on chart
enable/disable bars and background coloring based on trend
enable/disable a "filter noise" option , which try to reduce overtrading (you can easily check it on backtesting)
enable/disable a Take Profit / Stop Loss option (you can easily check it on backtesting too)
enable/disable a secret SmartOption which may improve profit on your chart (again, check it on you chart if it helps or not)
This strategy only trigger 1 buy or 1 sell. If you enable Take Profit / Stop Loss option, consider that many TP can be triggered before trend reversal, so take partial profit on every TP an eventually buy/sell back lower/higher to maximize your profit.
This script will let you set all notifications you may need in order to be alerted on each triggered signals.
The one for backtesting purpose can be found by searching for the astropark's "ALGO Trading V2" and then choosing the indicator with "strategy" suffix in the name, or you can find here below
Strategy results are calculated on the time window from January 2018 to now, so on more than 2 years, using 1000$ as initial capital and working at 1x leverage (so no leverage at all! If you like to use leverage, be sure to use a safe option, like 3x or 5x at most in order to have liquidation price very far).
This is not the "Holy Grail", so use a proper risk management strategy.
This is a premium indicator , so send me a private message in order to get access to this script.
