Sweep2Trade Pro [CHE]Sweep2Trade Pro \ — Liquidity Sweep → Trend → Confirmation
Sweep2Trade Pro \ helps you catch high-probability reversals or continuations that start with a liquidity sweep, align with the T3 trend, and finalize with a structure confirmation (BOS). It’s designed to reduce noise, time your entries, and keep you out of weak, chop-driven signals.
What’s a “sweep”?
A liquidity sweep happens when price briefly breaks a prior swing high/low (where many stops sit), triggers those stops, and then snaps back. This “stop-hunt” creates liquidity for bigger players and often precedes a sharp move in the opposite direction if the break fails, or fuels continuation if structure actually shifts.
What’s a BOS (Break of Structure)?
A BOS is a price action event where the market takes out a recent swing level in the trend’s direction, signaling continuation and confirming that structure has shifted (bullish BOS through a recent swing high, bearish BOS through a recent swing low).
How the indicator works (at a glance)
1. Regime Filter (T3 + R²)
T3 Moving Average: A smoother, faster-responding moving average that aims to reduce lag while filtering noise, so trend direction changes are clearer.
R² (Coefficient of Determination): Measures how “linear” the recent price path is (0→1). Higher values = stronger, cleaner trend; lower values = more chop. Used here to allow trades only when trend quality exceeds a user-set threshold.
2. Sweep Detection
Bullish sweep: price pokes below a prior swing low and closes back above it.
Bearish sweep: price pokes above a prior swing high and closes back below it.
Lookback length is configurable.
3. Sequence Lock (built-in FSM)
The script manages state in phases so you don’t jump the gun:
Phase 1: Sweep detected → wait for T3 to turn in the corresponding direction.
Phase 2: T3 direction confirmed → show “SWEEP OK” and wait for final confirmation.
Trade Signal: Only fires if confirmation arrives before a timeout.
4. Confirmation Layer
BOS via wick or close (you choose),
Strong close toward the signal (top/bottom quartile of the candle),
Optional “close above/below T3” condition.
These checks help avoid weak sweeps that immediately fade.
5. Alerts & Visuals
“SWEEP OK” markers show when the sweep + T3 direction align.
Final BUY/SELL arrows appear only when the confirmation layer passes.
Ready-made alert conditions for automation.
What you can do with it
Time reversals after sweeps: Enter when a stop-hunt fades and structure confirms.
Ride continuations: Use BOS with the T3 trend to pyramid or re-enter with structure on your side.
Filter chop: Let R² gate entries to periods with cleaner directional drift.
Automate: Use the included alerts with your platform or webhook setup.
Inputs (key settings)
Regime Filter
T3 Length / Volume Factor: Controls smoothness and responsiveness. Smaller length → faster, more sensitive; higher volume factor → smoother curve.
R² Lookback & Threshold: Length of the linear fit window and the minimum “trend quality” required. Higher thresholds mean fewer, cleaner signals.
Sweep / Sequence
Swing Lookback: How far back to define the “reference” high/low for sweeps.
Timeout: Maximum bars allowed between phases to keep signals fresh.
Restart timeout on Phase 2: Optional safety so entries don’t go stale.
Confirmation
BOS Lookback: Micro-pivot window for structure breaks.
Wick vs Close BOS: Conservative traders may prefer close.
Require close above/below T3: Tightens confirmation with trend alignment.
Practical guide (quick start)
1. Timeframe & markets: Works across majors, indices, and crypto. Start with 5m–1h intraday or 1h–4h swing; adjust R² threshold upward on noisier pairs.
2. Entry recipe (Long):
Bullish sweep of a prior low → T3 turns up → BOS/strong close.
Optional: enable “close above T3” for extra confirmation.
3. Entry recipe (Short): Mirror the above.
4. Stops: Common choices are just beyond the sweep wick (tighter) or past the BOS invalidation (safer).
5. Targets: Previous structural levels, measured move, or a T3 trail (exit when price closes back through T3).
6. Avoid low-quality contexts: If R² is very low, market is likely ranging erratically—skip or widen filters.
Tips & best practices
Context first: The same sweep means different things in a strong trend vs. flat regime; that’s why the T3+R² filter exists.
BOS choice: Wick-based BOS is earlier but noisier; close-based BOS is slower but cleaner. Tune per market.
Backtest -> Forward test: Validate settings per symbol/timeframe; then paper trade before going live.
Risk: Fixed fractional risk with asymmetric R\:R (e.g., 1:1.5–1:3) generally performs better than “all-in” discretionary sizing.
Behind the scenes (for the curious)
T3 is a multi-stage EMA construction that produces a smooth curve with reduced lag versus simple/standard EMAs.
R² is the square of correlation (0–1). Here it’s used as a moving gauge of how well price aligns to a linear path—our “trend quality” dial.
Stop-hunts / sweeps are a recognized microstructure phenomenon where clustered stops provide the liquidity that fuels the next move.
Disclaimer
No indicator guarantees profits. Sweep2Trade Pro \ is a decision aid; always combine with solid risk management and your own judgment. Backtest, forward test, and size responsibly.
The content provided, including all code and materials, is strictly for educational and informational purposes only. It is not intended as, and should not be interpreted as, financial advice, a recommendation to buy or sell any financial instrument, or an offer of any financial product or service. All strategies, tools, and examples discussed are provided for illustrative purposes to demonstrate coding techniques and the functionality of Pine Script within a trading context.
Any results from strategies or tools provided are hypothetical, and past performance is not indicative of future results. Trading and investing involve high risk, including the potential loss of principal, and may not be suitable for all individuals. Before making any trading decisions, please consult with a qualified financial professional to understand the risks involved.
By using this script, you acknowledge and agree that any trading decisions are made solely at your discretion and risk.
Enhance your trading precision and confidence 🚀
Happy trading
Chervolino
Longsignal

ZenAlgo - QZenAlgo - Q
Description
ZenAlgo - Q is an oscillator based on the QQE (Quantitative Qualitative Estimation) method. This version incorporates refinements for additional visualization and interpretation options. It is designed to help traders observe momentum changes and divergence patterns in price movements.
Key Features
QQE-Based Calculation : Derived from the open-source QQE script by Glaz (Metastock Version of QQE), with modifications for alternative visualization.
Dual RSI-Based Analysis : Uses two RSI calculations to provide additional context on price movements.
Adaptive Trend Bands : Adjust dynamically based on the market conditions.
Divergence Identification : Highlights potential differences between price action and oscillator movement.
Dynamic Color Coding : Displays histogram bars to illustrate shifts in oscillator values.
Configurable Alerts : Enables notifications for specific oscillator conditions.
How It Works
The indicator calculates a smoothed RSI-based oscillator that tracks the relative strength of price movement. It applies an exponential moving average (EMA) smoothing to reduce noise while maintaining responsiveness.
Two adaptive bands are calculated using a variation of the QQE method, which helps define dynamic overbought and oversold conditions.
The histogram bars shift in color based on the position of the oscillator relative to the bands. Lighter shades indicate weaker momentum, while stronger momentum is represented by more saturated colors.
The script also includes a secondary RSI component, which provides an additional layer of analysis. This secondary RSI helps refine momentum trends by smoothing out short-term fluctuations.
Divergence identification is built-in, highlighting where price action deviates from oscillator readings. Bullish divergence occurs when price forms a lower low while the oscillator forms a higher low, and bearish divergence is identified when price forms a higher high while the oscillator forms a lower high.
The indicator does not generate buy or sell signals but instead provides contextual information that can be used alongside other trading strategies.
Use Cases
Trend Observation : Traders can use the histogram to observe whether momentum is strengthening or weakening over time. A shift in color can indicate a potential change in trend strength.
Divergence Analysis : By comparing oscillator divergence with price movement, traders can identify situations where price action may be losing momentum. Divergences do not guarantee reversals but can serve as an early warning to re-evaluate positions.
Momentum Tracking : The dual RSI structure allows users to monitor both short-term and long-term momentum. When both RSI components are aligned, it suggests a more stable trend, while divergence between them may indicate potential consolidation or trend shifts.
Supplementary Analysis : This indicator is best used as a supporting tool alongside volume-based or trend-following indicators. It helps visualize underlying price behavior but should not be used in isolation for decision-making.
Market Context Interpretation : The combination of adaptive bands and histogram visualization allows traders to assess how recent price action compares to historical movement, helping to place current conditions in a broader market context.
Attribution
This script is an adaptation of the open-source QQE script originally developed by Glaz. We acknowledge and appreciate the original author's work, which served as a foundation for our modifications.
Disclaimer
This indicator is intended for informational purposes only. It should not be interpreted as financial advice. Always conduct independent research and risk management before making trading decisions.

NOMMO AUTOMATE🖖 Hi all!
Check out my NOMMO AUTOMATE indicator for trend detection, trend change points, hedging opposite trend impulses.
What the script do:
☑️ Detecting local and global trends and trend change points, detecting opposite to current trend impulses.
How the script do it:
☑️ The indicator compares RSI indicators on chosen by user Trend TF1 and Trend TF2 and marks trend change points.
☑️ The indicator compares different length HMA indicators on chosen by user Hedge TF to detect opposite to current trend impulses.
How to use it:
☑️ There are 4 states in the indicator: Long, Short, Flat, Hedge, marked by corresponding (adjustable) color zones, where Long = uptrend, Short = downtrend, Flat = sideways movement, Hedge = possible impulse in the opposite trend direction.
☑️ Select Trend TF1 and Trend TF2 and RSI length to determine the trend, depending on how a big picture you want to see, the more major TF you choose the more global picture of the trend change you get.
☑️ Select Hedge TF to determine the possible impulses opposite to the current trend (does not work in detected Flat movement).
☑️ For each trading pair you need to try individual settings, the default settings I use for BTC swing trading, to reduce the noise level of hedging put Hedge TF the same as the smaller Trend TF.
☑️ Try different settings, experiment and you will find the most suitable settings for your trading pair.
How magic works:
☑️ RSI Trend TF1 > 50 + RSI Trend TF2 > 50 = Long
☑️ RSI Trend TF1 > 50 + RSI Trend TF2 < 50 = Flat
☑️ RSI Trend TF1 < 50 + RSI Trend TF2 > 50 = Flat
☑️ RSI Trend TF1 < 50 + RSI Trend TF2 < 50 = Short
☑️ Long + Hedge TF (HMA 10 < HMA 70 < HMA 200) = Hedge
☑️ Short + Hedge TF (HMA 10 > HMA 70 > HMA 200) = Hedge
For example:
☑️ Try Trend TF1 = 1D, Trend TF2 = 1D and Hedge TF = 1D, with RSI period = 21, to check mid-term trend on BTCUSD
May the trade force be with you.

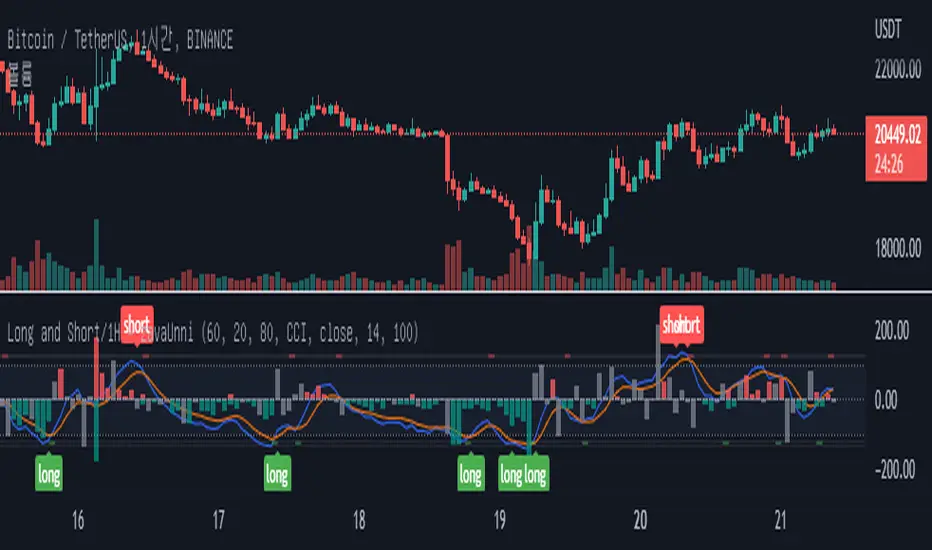
Long and Short Signal_1hours [zavaUnni]This indicator is available in the 1 hour chart.
The Stochastic value of 1 hour of 3 types of length was requested, summed, and then the value was derived.
The blue line is the K and the orange line is D of the Stochastic.
The default is Stochastic, but when RSI is selected in the settings, it can be viewed as the relative strength index of the Stochastic.
If the K value crosses down at 100, a short signal is generated
Cross up below -100 and you'll get a long signal.
You can receive a ready signal by checking Position Ready in Settings.
Short ready signal when the k line goes up to 100.
Long ready signal when the k line goes below -100.
A small spread value of the candle relative to the volume is the principle that resistance has occurred.
Displayed the resistance value based on the average value of the last 100 candles.
The higher the value of the red Histogram, the stronger the selling.
The lower the value of the green Histogram value, the stronger the buying .
The gray histogram is when there's no buying or selling pressure.
Pre-ScalperHello all,
It is an artificial intelligence indicator that can generate future predictions based on trend tracking and historical data analysis.
It will be in a period of continuous improvement to achieve the highest success rates.
You can use in all market in all time period.
This indicator does not contain any investment advice, it is only a helpful tool in your investments.
BINANCE:AAVEUSDTPERP

PriceCatch NASDAQ Breakout Stocks Screener FHi,
Tradingview community and NASDAQ traders. Warm Greetings.
NASDAQ Breakout Stocks Screener
I am sharing a script that screens NASDAQ stocks for Probable Breakout Buy signal and Stop-Reverse Buy Signal. This script may prove to be useful to traders who trade NASDAQ listed stocks.
I have already shared the script "PriceCatch Signals Buy Signals" that marks the following levels on the chart.
Probable Breakout Buy Level
Stop-Reverse Buy Level
While the script "PriceCatch Signals Buy Signals" can be used independently, this script is intended to be used with the script "PriceCatch Signals Buy Signals".
Used together, these two scripts may help you identify probable breakout opportunities. This Screener will help you screen stocks that have broken out of any of the Breakout levels marked by the "PriceCatch Signals Buy Signals" script. This way you can quickly and automatically identify breakout stocks without manually going through every stock in your watchlist searching for breakout signals.
Please read the Notes of the script "PriceCatch Signals Buy Signals" for explanation of its functionality.
STOCKS SET
This Free screener scans a list of 20 stocks. The full version scans a list of 160 stocks. Care has been taken to include liquid stocks with over 500K daily volume.
Chart resolution vs. Script resolution
It is suggested to set the chart resolution to a lower time-frame than the Screener resolution. For example, if the screener resolution is set to 1 Hour time-frame, set the chart resolution to less than 1 Hour time-frame and run the Screener.
CHART
The Screener runs independently and you may have any chart on your screen. As you can see chart is showing XLNX and the screener has identified a set of other stocks.
NOTE - PRIOR TO USING THIS SCRIPT:
Please remember that the script is shared with absolutely no assurances about usability and any warranties whatsoever and as a responsible trader, please satisfy yourselves thoroughly and use it only if you are satisfied it works for you. Remember, you are 100% responsible for your actions. If you understand and accept that, you may use the script.
QUERIES/FEEDBACK
Please PM me.
Regards to all and wish everyone all the best with trading.

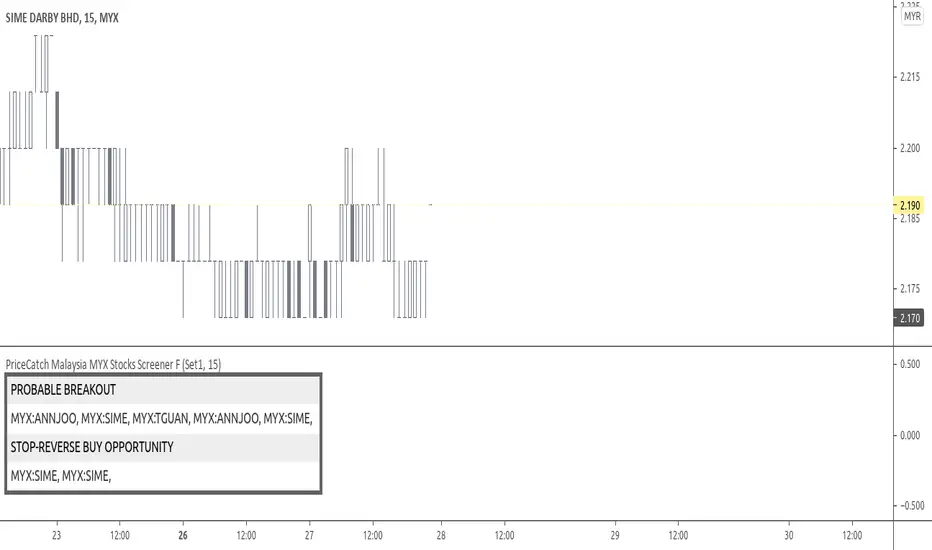
PriceCatch Malaysia MYX Stocks Screener FHi,
Tradingview community and Malaysian MYX Traders. Warm Greetings.
Malaysia MYX Stocks Screener
I am sharing a script that screens Malaysia MYX stocks for Probable Breakout Buy signal and Stop-Reverse Buy Signal. This script may prove to be useful to traders who trade Malaysia MYX listed stocks.
I have already shared the script "PriceCatch Signals Buy Signals" that marks the following levels on the chart.
Probable Breakout Buy Level
Stop-Reverse Buy Level
While the script "PriceCatch Signals Buy Signals" can be used independently, this script is intended to be used with the script "PriceCatch Signals Buy Signals".
Used together, these two scripts may help you identify probable buy opportunities. The purpose of this script is to help screen stocks quickly without manually going through every stock in your watch list.
Please read the Notes of the script "PriceCatch Signals Buy Signals" for explanation of its functionality.
Stock Set
This Free screener scans a list of 20 stocks. The full version scans a list of 60 stocks. The stocks list will be regularly updated. Care has been taken to include liquid stocks. MYX traders may suggest liquid stocks for inclusion in full version.
Chart resolution vs. Script resolution
I have noticed that if the chart resolution is set to 15 minutes time-frame and the screener resolution is selected as 2 Hours, then the results are correct. However, if the screener resolution is set to 5 minutes, then the results are not accurate. This is not an issue with script. So scanning higher time-frames from a lower time-frame chart works better. My advice however, is better to set the chart resolution to the same interval as screener resolution for sure results.
As usual with price action, longer time-frames produce more reliable signals.
CHART
You can have any stock on your chart, while the screener is scanning the stocks independently. In the above image, chart is set to 45 minutes time frame and stock is ABMB, however screener is screening stocks in 120 minutes time frame and has found GTRONIC.
NOTE - PRIOR TO USING THIS SCRIPT:
Please remember that the script is shared with absolutely no assurances about usability and any warranties whatsoever and as a responsible trader, please satisfy yourselves thoroughly and use it only if you are satisfied it works for you. Remember, you are 100% responsible for your actions. If you understand and accept that, you may use the script.
QUERIES/FEEDBACK
Please PM me.
Regards to all and wish everyone all the best with trading.
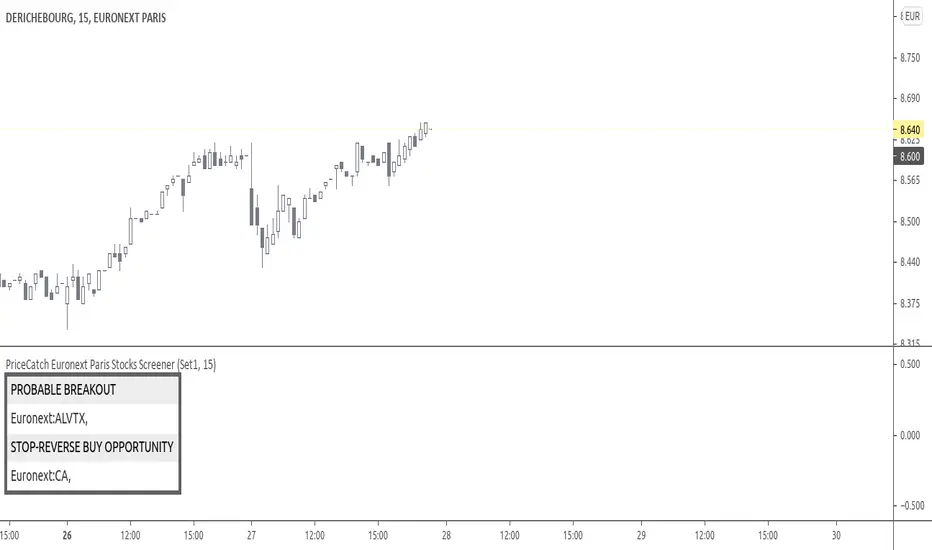
PriceCatch Euronext Paris Stocks Screener v1Hi,
Tradingview community. Warm Greetings.
Euronext Paris Stocks Screener
I am sharing a script that screens Euronext Paris stocks for Probable Breakout Buy signal and Stop-Reverse Buy Signal. This script may prove to be useful to traders who trade Euronext Paris listed stocks.
I have already shared the script "PriceCatch Signals Buy Signals" that marks the following levels on the chart.
Probable Breakout Buy Level
Stop-Reverse Buy Level
While the script "PriceCatch Signals Buy Signals" can be used independently, this script is intended to be used with the script "PriceCatch Signals Buy Signals".
Used together, these two scripts may help you identify probable buy opportunities. The purpose of this script is to help screen stocks quickly without manually going through every stock in your watchlist.
Please read the Notes of the script "PriceCatch Signals Buy Signals" for explanation of its functionality.
Stocks Set
As Tradingview limits the number of security function calls, to get around, you have to select Set1 to screen first set of 25 stocks and then select Set2 to screen next set of 25 stocks.
List of Euronext Paris stocks
ACA AI AIR ALCRB ALGAU ALO ALONC ALVTX ATO BN BNP CA CLA COFA CS DBG DG EDF
EL ELIOR EN ENGI ETL FDJ FR FTI GET GLE MCPHY OR ORA POXEL PUB RI
RNO RXL SAF SAN SGO SMCP STLA STM SU TE TTE VIE VIV VK VLA WLN
Chart resolution vs. Script resolution
I have noticed that if the chart resolution is set to 15 minutes time-frame and the screener resolution is selected as 2 Hours, then the results are correct. However, if the screener resolution is set to 5 minutes, then the results are not accurate. This is not an issue with script. So scanning higher time-frames from a lower time-frame chart works better. My advice however, is better to set the chart resolution to the same interval as screener resolution for sure results.
As usual with price action, longer time-frames produce more reliable signals.
SOME CHARTS
Chart set to Daily time-frame and shows Derichebourg stock. Screener shows a Stop-Reverse Buy Opportunity on GET.
s3.tradingview.com
Example 2
Chart set to 30 min. timeframe and shows Derichebourg stock. Screener shows a Stop-Reverse Buy Opportunity on VIV .
s3.tradingview.com
NOTE - PRIOR TO USING THIS SCRIPT
Please remember that the script is shared with absolutely no assurances about usability and any warranties whatsoever and as a responsible trader, please satisfy yourselves thoroughly and use it only if you are satisfied it works for you. Remember, you are 100% responsible for your actions. If you understand and accept that, you may use the script.
QUERIES/FEEDBACK
Please PM me.
Regards to all and wish everyone all the best with trading.
PriceCatch - EuronextParis-Stocks screenerHi,
Tradingview community. Warm Greetings.
EuronextParis Stocks Screener
I am sharing a script that screens Euronext Paris stocks for Probable Breakout Buy signal and Stop-Reverse Buy Signal. This script may prove to be useful to traders who trade Euronext Paris listed stocks.
I have already shared the script "PriceCatch-Signals - Buy Signals" that marks the following levels on the chart.
Probable Breakout Buy Level
Stop-Reverse Buy Level
While the script "PriceCatch-Signals - Buy Signals" can be used independently, this script is intended to be used with the script "PriceCatch-Signals - Buy Signals".
Used together, these two scripts may help you identify probable buy opportunities. The purpose of this script is to help screen stocks quickly without manually going through every stock in your watchlist.
Please read the Notes of the script "PriceCatch-Signals - Buy Signals" for explanation of its functionality.
Stock Set
As Tradingview limits the number of security function calls, to get around, you have to select Set1 to screen first set of 25 stocks and then select Set2 to screen next set of 25 stocks.
Chart resolution vs. Script resolution
I have noticed that if the chart resolution is set to 15 minutes timeframe and the screener resolution is selected as 2 Hours, then the results are correct. However, if the screener resolution is set to 5 minutes, then the results are not accurate. This is not an issue with script. So scanning higher timeframes from a lower timeframe chart works better. My advice however, is better to set the chart resolution to the same interval as screener resolution for sure results.
As usual with price action, longer time-frames produce more reliable signals.
SOME CHARTS
Chart set to Daily timeframe and shows Derichebourg stock. Screener shows a Stop-Reverse Buy Opportunity on GET.
Example 2
Chart set to 30 min. timeframe and shows Derichebourg stock. Screener shows a Stop-Reverse Buy Opportunity on VIV.
NOTE - PRIOR TO USING THIS SCRIPT:
Please remember that the script is shared with absolutely no assurances about usability and any warranties whatsoever and as a responsible trader, please satisfy yourselves thoroughly and use it only if you are satisfied it works for you. Remember, you are 100% responsible for your actions. If you understand and accept that, you may use the script.
QUERIES/FEEDBACK
Please PM me.
Regards to all and wish everyone all the best with trading.

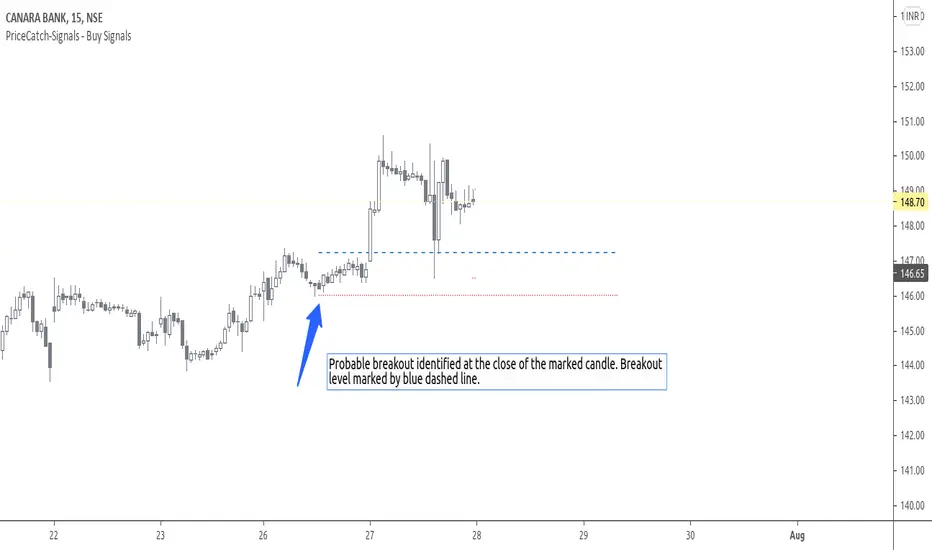
PriceCatch-Signals - Buy SignalsHi,
TradingView Community.
Here is a script that identifies and marks two different buy levels on the chart. It works on all asset classes - equities, forex, crypto.
Probable Breakout Buy Level
Stop-Reverse Buy Level
The bottom images are self-explanatory.
PROBABLE BREAKOUT BUY LEVEL EXAMPLE:
STOP-REVERSE BUY LEVEL EXAMPLE:
IDENTIFICATION OF LEVELS:
The Blue Dotted line represents Probable Breakout Buy Level and the Blue Dashed Line Stop-Reverse Buy Level. The corresponding Red Dotted line below each level should be your initial stop loss price point.
PLAYING SAFE
After taking the trade, to play safe, I follow this method that once the Low of the price goes above the Buy Level, I usually shift the stop loss to buy price to protect against any sudden reversal. For me protecting capital is important. As usual with price action, longer time-frames produce more reliable signals.
NOTE - PRIOR TO USING THIS SCRIPT:
The script uses Heikin-Ashi Candles data to identify the levels. You may use this script in addition to your other indicators or in isolation. Please remember that the script is shared with absolutely no assurances and warranties whatsoever and as a responsible trader, please satisfy yourselves thoroughly and use it only if you are satisfied it works for you. Remember, you are 100% responsible for your actions. If you understand and accept that, you may use the script. The script does not identify any short signals.
ADDITIONAL NOTE:
I shall also be releasing Screener scripts that scan the following markets for the above two conditions or signals thereby helping traders spot opportunities at the right time by making the task of finding right stocks a breeze.
NASDAQ Stocks Screener (Can screen a total number of 160 stocks. 40 stocks at a time)
UK LSE Stocks Screener (Can screen a total number of 90 stocks. 30 stocks at a time)
Euronext Paris Stocks Screener (Can screen a total number of 50 stocks. 25 stocks at a time) - in development.
Singapore Stocks Screener is in development
Other International exchanges will be added based on response from users.
SOME MORE CHARTS:
QUERIES/FEEDBACK
Please PM me.
Regards to all and wish everyone all the best with trading.
PriceCatch-Signals - Buy SignalHi,
TradingView Community.
Here is a script that identifies and marks two different buy levels on the chart. It works on all asset classes - equities, forex, crypto.
Probable Breakout Buy Level
Stop-Reverse Buy Level
The bottom images are self-explanatory.
PROBABLE BREAKOUT BUY LEVEL EXAMPLE:
STOP-REVERSE BUY LEVEL EXAMPLE:
IDENTIFICATION OF LEVELS:
The Blue Dotted line represents Probable Breakout Buy Level and the Blue Dashed Line Stop-Reverse Buy Level. The corresponding Red Dotted line below each level should be your initial stop loss price point.
PLAYING SAFE
After taking the trade, to play safe, I follow this method that once the Low of the price goes above the Buy Level, I usually shift the stop loss to buy price to protect against any sudden reversal. For me protecting capital is important. As usual with price action, longer time-frames produce more reliable signals.
NOTE - PRIOR TO USING THIS SCRIPT:
The script uses Heikin-Ashi Candles data to identify the levels. You may use this script in addition to your other indicators or in isolation. Please remember that the script is shared with absolutely no assurances and warranties whatsoever and as a responsible trader, please satisfy yourselves thoroughly and use it only if you are satisfied it works for you. Remember, you are 100% responsible for your actions. If you understand and accept that, you may use the script. The script does not identify any short signals.
ADDITIONAL NOTE:
I shall also be releasing Screener scripts that scan the following markets for the above two conditions or signals thereby helping traders spot opportunities at the right time by making the task of finding right stocks a breeze.
NASDAQ Stocks Screener (Can screen a total number of 160 stocks. 40 stocks at a time)
UK LSE Stocks Screener (Can screen a total number of 90 stocks. 30 stocks at a time)
Euronext Paris Stocks Screener (Can screen a total number of 50 stocks. 25 stocks at a time) - in development.
Singapore Stocks Screener is in development
Other International exchanges will be added based on response from users.
SOME MORE CHARTS:
QUERIES/FEEDBACK
Please PM me.
Regards to all and wish everyone all the best with trading.

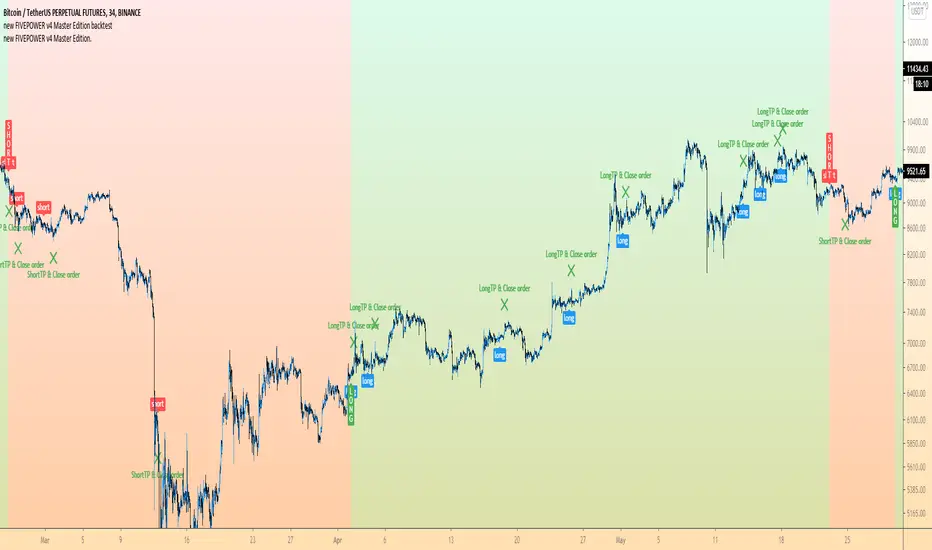
TeoTrading 17 - 106. Long Signals based on Algorithmic TradingThis indicator mark patterns that were successful in the past, based on Algorithmic Trading and backtesting.
This Script is for Private Use.
It was designed for Long Signals. Was developed and tested with o group of stocks:
- Argentine Stocks of different sectors: Bank, Energy and Industry.
- Nasdaq technology stocks.
- Petroleum.
Includes Real Time Stastistics.
No purchase recommendations are given. The user must do their own analysis to decide whether to buy.
"A" signal is to make the Analysis. Here the user will see a Yellow Candle.
"V" signal is to Sell. Here the user will see:
- A Green Candle: Sell with Gain using a fixed Stop Gain.
- A Blue Candle: Sell with Gain using a dynamic (variable) Stop Gain.
- A Fuchsia Candle: Sell with lost.
The Orange Candle indicates that a trade is open.
Includes Alerts.
Enabled users will obtain a complete manual.

[AN] HAStudy that signals buy and sell zones based on HeikinAshi chart.
Also includes exit signals.
Strategy that tests the signals is available here:

FIVE POWER - BUY SELL by coinssporFOUR POWER - BUY SELL by coinsspor
Four Power include four diffrent indicator.
Heikin Ashi Smoothed
Marvelous Method
RSI BUY-SELL V3
Tillson T3
U can use all of them same time (it gives one common signal) or u can use only one indicator
for example: if u wanna use only one indicator u must select buy level power as 1 and u must select sell level power as 1 after that u need click on only one indicator
if u seleck higher 1 than indicator u need select buy level power higher
and i advice always to use buy power level > sell power level