Mansfield Relative Strength (Original Version) by stageanalysisThe Mansfield Relative Strength ( Mansfield RS ) is one of the core components of the Stan Weinstein's Stage Analysis method as discussed in his classic book Stan Weinstein's Secrets for Profiting in Bull and Bear Markets .
The Mansfield RS measures the relative performance of the stock compared to an index such as the S&P 500, or to another stock etc.
However, this should not to be confused with the popular RSI (Relative Strength Index developed J. Welles Wilder), which is a momentum oscillator that measures the speed and change of price movements on a single stock.
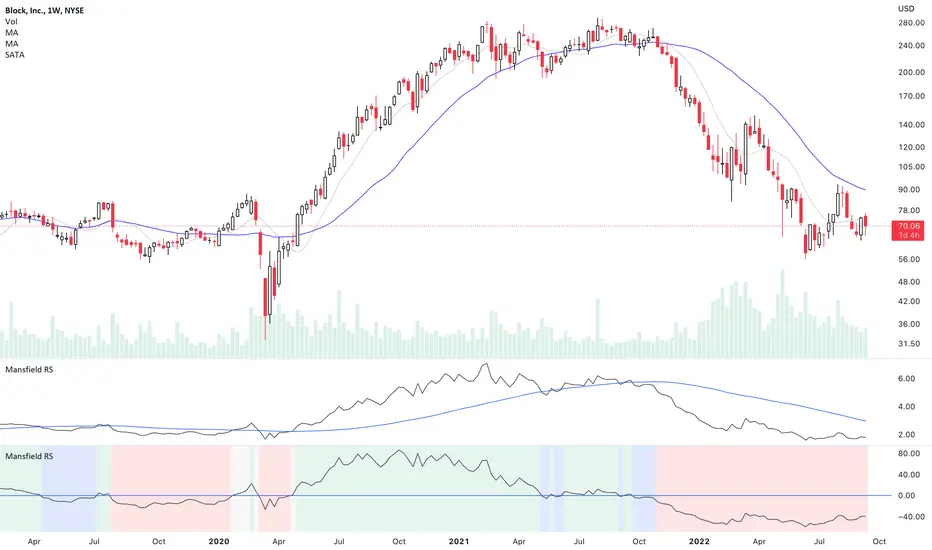
The Mansfield RS indicator consists of the Relative Strength comparison line versus the S&P 500 (default universal setting, but can be edited), and the "Zero Line" – which is the 52 week MA of the Relative Strength line, that's been flattened to create the oscillator style.
How to use the Indicator:
Outperforming – Above the Zero Line
When the Relative Strength line crosses above the Zero Line (it's flattened 52 week RS MA), it is outperforming the index or stock that it's comparing against, and so it is showing stronger relative strength.
Underperforming – Below the Zero Line
When the Relative Strength line crosses below the Zero Line (it's flattened 52 week RS MA), it is underperforming the index or stock that it's comparing against, and so it is showing weaker relative strength.
Settings:
When you first add the indicator is has a coloured background, with a green tint for a postive RS score, and a red tint for a negative RS score. However, this can be turned off, or edited in the indicator settings, in the Style tab. So you can change the colors or remove it and just have the RS line and zero line showing. Both of which can also be edited in the settings.
Change the symbol that it compares against. The default is the S&P 500. But for crypto you might want to use Bitcoin for example. Or you might want to compare against competing stocks in the same peer group, or against the industry group or sector. The choice is yours. But the S&P 500 is a universal measure for the Mansfield RS. So I would recommend leaving it on that unless you have a particular reason to change it as mentioned.
MA Length is also an editable setting. This creates the Zero Line. So it will affect the values of the Mansfield RS if you change it. 52 is the default setting, and is set as such for the weekly chart. So I'd recommend not editing it on the weekly chart, but for other timeframes, different settings can be used.
Mansfieldrelativestrength
Mansfield RSHello,
I hope you like this representation of the Mansfield Relative Strength Indicator.
The calculations have been made based on the following formulas:
Standard Relative Performance indicator
RP = ( stock_close / index_close ) * 100
Mansfield Relative Performance indicator
MRP = (( RP (today) / sma ( RP (today), n)) - 1 ) * 100
Where:
RP = Standard Relative Performance indicator (see above)
SMA = Simple moving average over n days.
n = 52 for weekly charts, and n = 200 on daily charts
Thanks,