ZenAlgo - GridOverview and anchoring logic
This indicator constructs a price grid based on a dynamically or manually defined price swing. The entire calculation starts by defining two anchor points that represent a completed directional move. These anchors can be selected in two ways:
Manually, by specifying a start time and an end time, where the indicator uses the candle corresponding to those times and selects either wick highs or lows depending on direction.
Automatically, by detecting significant swing points derived from recent price extremes over a configurable historical window.
The chosen anchors form a reference segment between point A and point B. This segment defines both direction and magnitude of the move. All subsequent levels and zones are derived relative to this segment, ensuring the grid adapts to current market structure rather than using fixed price distances.
Difference from traditional grid and Fibonacci tools
Unlike fixed price grids or standard Fibonacci tools that require manual anchoring and remain static once drawn, this indicator continuously derives its grid from the most relevant completed price swing. Instead of treating levels as independent horizontal prices, all values are expressed as proportions of a single measured move, allowing the grid to automatically rescale and realign as market structure evolves.
Market structure detection and directional context
Before the grid itself is drawn, the script continuously evaluates price structure using swing detection over two different sensitivities. Larger swings establish the dominant structural direction, while smaller swings can optionally be shown for internal context.
Swing highs and swing lows are detected by comparing historical highs and lows over a rolling window.
When price crosses above or below the most recent structural level, the script classifies the event as either a continuation in the same direction or a change in direction.
This structural state determines whether the grid is treated as upward or downward and influences the visual orientation of labels and zones.
This step matters because retracement and extension levels only have meaning when referenced to a clearly defined directional move.
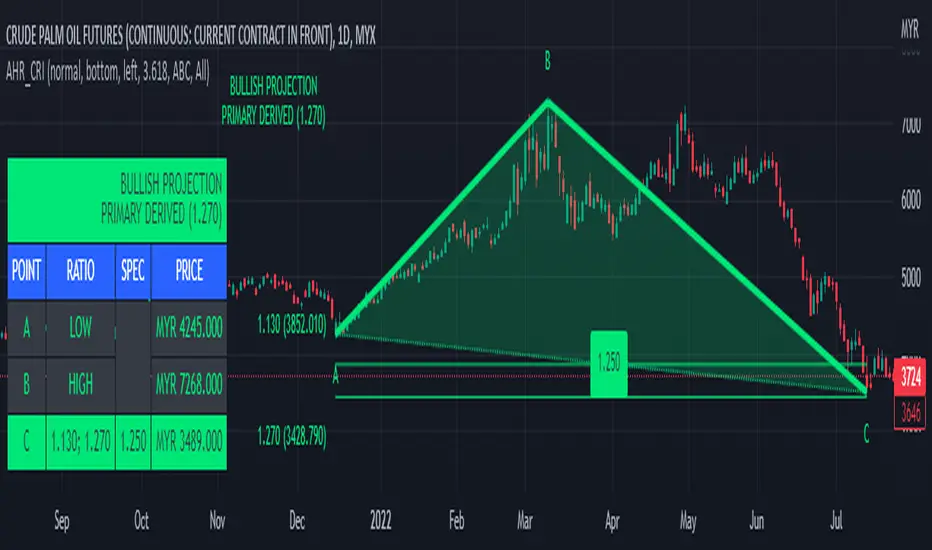
Primary range construction between anchors
Once the anchor points are established, the indicator measures the vertical price distance between them. This distance is treated as a normalized range rather than an absolute value. Every level drawn afterward is positioned as a proportional offset of this range.
If the second anchor is above the first, the grid is considered bullish.
If the second anchor is below the first, the grid is considered bearish.
Colors and label orientation adapt automatically to this direction.
By normalizing the range, the grid remains comparable across assets and timeframes.
Retracement and extension level placement
The indicator plots a predefined set of proportional levels between and beyond the anchor points. Each level represents a fraction or multiple of the original move.
Lower values correspond to deeper retracements toward the origin of the move.
Mid-range values represent partial pullbacks within the move.
Higher values extend beyond the move, projecting potential continuation zones.
Each level is drawn as a horizontal line extending into future bars, accompanied by a label. Labels can be shown either as descriptive names or as raw proportional values, depending on user preference.
Zone construction instead of single levels
Rather than relying only on precise price lines, the indicator groups selected proportions into zones. This reflects the observation that price interaction typically occurs across ranges rather than at exact prices.
A retracement zone highlights an area between two closely spaced proportional levels.
A projection zone marks a continuation region beyond the measured move.
These zones are drawn as shaded areas extending forward in time.
Visual reference points
The indicator explicitly marks the two anchor points on the chart.
Point A represents the origin of the measured move.
Point B represents the completion of that move.
This allows the user to visually verify which price swing the grid is derived from.
How to interpret the values
All plotted levels express proportional relationships to the measured move, not independent price predictions.
Lower proportional values indicate proximity to the start of the move.
Mid-range values represent partial retracements.
Higher values indicate projected continuation areas.
How to best use this indicator
This indicator serves as a structural reference tool rather than a signal generator.
Apply it after a clear directional swing has formed.
Use higher-timeframe context to validate anchor selection.
Combine the grid with price behavior and other contextual tools.
Limitations and disclaimers
This indicator is purely proportional and structure-based.
It does not incorporate volume, volatility regimes, or fundamental data.
Automatic anchoring may differ from subjective swing selection.
Levels and zones represent reference areas, not guaranteed reaction points.
The indicator describes price structure and proportional relationships only.
Penunjuk Pine Script®