Key Levels (PA, MAs, VWAPs, Volume Profile, rVWAPs)This indicator marks all kinds of key levels so that users can keep an overview of their specified levels in a convenient non chart cluttering way. It can highlight levels of confluence or display each level seperately.
The indicator includes markers for the following levels:
Price Action: Opens, Previous High/Low, Monday Range
Moving Averages: H4, D1 and W1 with customisable lengths
VWAPs: Developing and Previous VWAPs with their respective VAL/VAH (1 Standard Deviation)
Rolling VWAPs
Volume Profile: Developing and Previous VAL/VAH/POC
What makes this indicator different is its vast customisation options and big library of levels…
… users can choose to merge all levels that are aligned in a specified % threshold and additionally they can choose to color them the same color to highlight confluence levels.
… users have the choice between Full Label Markers or Abbreviations of those Labels.
… users have the choice of a few presets making level switching fast and convenient (Price Action, Volume Profile, VWAP, Volume or Custom).
… users can specify if they prefer to highlight Simple Moving Averages or Exponential Moving Averages. They have calculations available on three different timeframes and can change the lengths of each.
… users can color all levels the same with one click instead of having to manually change all of them.
… when users choose Volume Profile Levels they can either let the script auto calculate the row size making asset switching simple or they can manually input row size.
With the custom preset users can show and hide whichever levels they want.
(To have them the same every time you freshly load the indicator save your settings as default in the lower left corner of the settings tab).
Purpose
This indicator is designed to serve as a level visualisation tool that has the ability to highlight levels of confluence. It may assist in keeping an overview of where all levels are currently located but does not produce signals or trade recommendations.
Marker

Multi-Session MarkerMulti-Session Marker is a flexible visual tool for traders who want to highlight up to 10 custom trading sessions directly on their chart’s background.
Custom Sessions: Enter up to 10 time ranges (in HHMM-HHMM format) to mark any market session, news window, or personal focus period.
Visual Clarity: For each session, toggle the highlight on or off and select a unique background color and opacity, making it easy to distinguish active trading windows at a glance.
Universal Time Handling: Session times automatically follow your chart’s time zone—no manual adjustment required.
Efficient and Fast: Utilizes TradingView’s bgcolor() for smooth performance, even on fast timeframes like 1-second charts.
Clean Interface: All session controls are grouped for easy editing in the indicator’s settings panel.
How to use:
In the indicator settings, enter your desired session times (e.g., 0930-1130) for each session you want to highlight.
Toggle “Show Session” and pick a color for each session.
The background will automatically highlight those periods on your chart.
This indicator is ideal for day traders, futures traders, or anyone who wants to visually segment their trading day for better focus and analysis.

Candle #40 Sentinel – A Simple Visual Marker for Chart ContextWhat it is:
Candle #40 Sentinel is a minimalistic visual aid that marks the candle from exactly 40 bars ago on your chart. It creates a clear reference point to help you assess whether your trendline is based on enough price history to be considered reliable.
What it does:
Draws a frame marker on the candle 40 bars before the current one.
Gives you an instant sense of how much historical data your trendline or setup is working with.
Helps prevent decisions based on short-term patterns with little statistical weight.
Why use it:
Context is key: Many trendlines look strong but are based on too few candles to be meaningful. This tool helps you visually gauge that.
Stay disciplined: Only act on setups with enough data behind them.
Save time: No need to count candles manually – the chart tells you instantly.
Who it's for:
Traders who use trendlines and want a quick way to assess data depth.
Anyone looking to bring more structure and discipline to visual chart analysis.
Note:
This tool does not generate signals, does not calculate trends, and uses no classic indicators. It simply draws a reference at the 40th candle back – giving you a visual anchor point to work with.
Candle #40 Sentinel – Let your setups breathe before you trust them.
Because trendlines drawn over 10 candles aren’t trendlines – they’re guesses.

All-Time High MarkerThis indicator automatically identifies and displays the All-Time High (ATH) price on a chart. When a new ATH is reached, a horizontal line is drawn, extending from a user-specified number of bars to the left of the ATH candle to the current bar, and continuing indefinitely to the right. An "ATH" label is placed at the beginning of the line. Key features:
Dynamic ATH Tracking: Automatically updates as new all-time highs are reached.
Customizable Line: Adjust the line color and width to match your chart theme.
Customizable Label: Change the label color, text color, and vertical offset.
Line Start Offset: Control how far back the ATH line starts from the ATH candle.
This tool helps traders quickly visualize and track ATH levels for potential breakouts or resistance zones.

Tilson Bull-Bear-MarkerThe Tilson Bull-Bear marker is using 2 Tilson moving averages and their divergence to identify bull and bear trends and reversals (potential entry or exit points).
How to use it:
Fast T3 (thick line) above thin line / solid blue fill color = ongoing bull trend
Slow T3 (thin line) above thick line / solid red fill color = ongoing bear trend
Shrinking or expanding divergence between the lines = trend is getting hotter or cooling down
Fast T3 (thick line) changes color from blue to red = potential trend reversal from bullish to bearish
Fast T3 (thick line) changes color from red to blue = potential trend reversal from bearish to bullish
(No financial advise, for testing purposes only)

Average True Range (ATR) invisible price markers / linesThis script provides the ATR price when added to the top and bottom of the currently hovered candle.
The prices are shown top left next to the indicators' name.
This means you do not have to manually subtract or add ATR to price.
Line opacity allows you to show the lines where the ATR is, however, I recommend to keep this disabled.
Line type allows you to choose where ATR is calculated from (LowHigh or LowHighBody), the second ignoring the wicks, however LH is standard.
I also recommend to keep the other parameters as default.
I hope this indicator provides useful to you and your trading.

Daily lines (UTC)This is a simple script to add highlighted lines on the daily open.
It uses UTC as timezone.

High/Low MarkerThis is @Rene 's private Script for marking highs and lows for Vertex investing
My Highs and Lows are marked whenever a candle closes above or below an old high
Still a bit bugged as i only want it to show the most recent high after a low and vice versa -> High Low High Low
But i am new to Pine Script. Any help apprechiated.

vline() Function for Pine Script v4.0+It's been a long time coming, but here is a versatile vline() function applicable to PSv4.0+ utilizing line.new(). I decided to finally figure this out at the request of another member recently. I have been waiting myself for months, but it's now time for an idea who's time has come to unleash upon planet Pine Script. It's a handy little function I believe will be very useful in the future. It only requires 4 parameters of BarIndex, Color, LineStyle, and LineWidth. Make sure you place it in an appropriate if() block to use it properly. As displayed above, this plots every 10 bars using a conditional statement employing the rarely used modulus operator.
Use it as you please, this is free code to implement into your new Pine projects. I don't require an credit for any one to use this function. I simply don't want any credit. I would however like to see some great ideas utilizing this when I randomly and accidentally come across them in the public library. I didn't know where to put this script, so I just tossed into the "Trend Analysis" category. I'm pondering we members need a "Miscellaneous" category some time in the future.
The comments section below is solely just for commenting and other remarks, ideas, compliments, etc... regarding only this indicator, not others. If you do have any questions or comments regarding this indicator, I will consider your inquiries, thoughts, and concepts presented below in the comments section, when time provides it. When my indicators achieve more prevalent use by TV members, I will implement more ideas when they present themselves as worthy additions. As always, "Like" it if you simply just like it with a proper thumbs up, and also return to my scripts list occasionally for additional postings. Have a profitable future everyone!

Weekday marker CloudFacts86 (dark background)A simple script to add a background color to each weekday for easy over time day related pastern finding on 24/7 markets. This script is set up for a dark background.

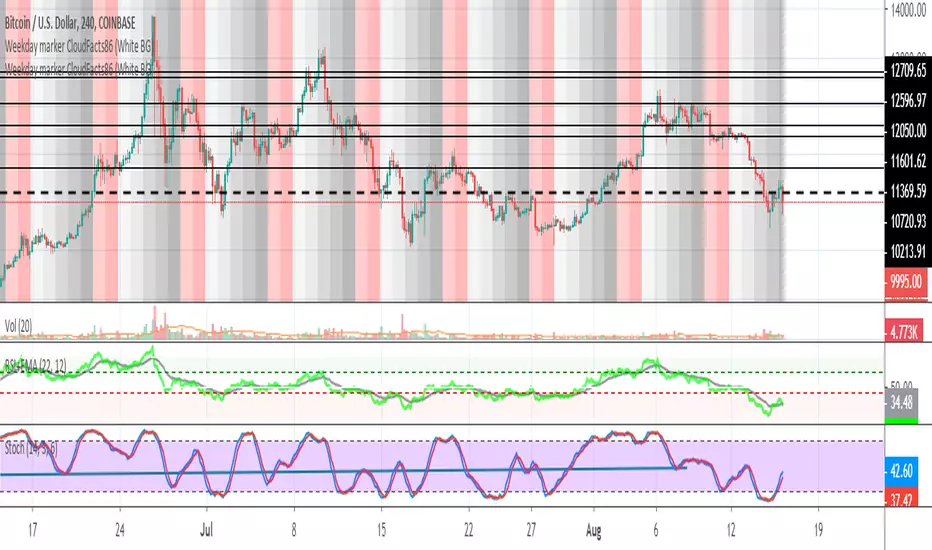
Weekday marker CloudFacts86 (White BG)A simple script to add a background color to each weekday for easy over time day related patern fiding on 24/7 markets.
This script is set up for a white background.
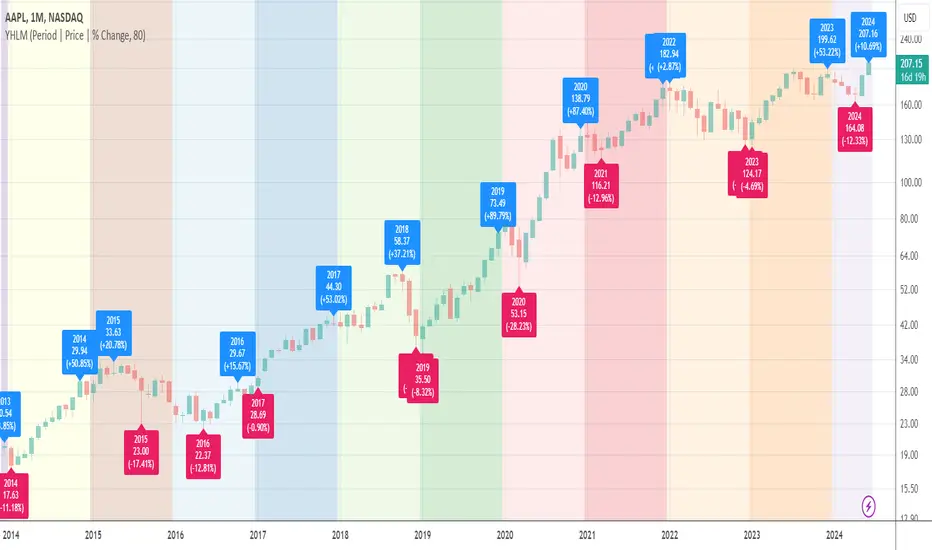
Yearly High/Low MarksAn utility tool for analysts. It marks the highest and lowest prices for each year down to 1989.
Works everywhere and doesn't use any calls of built-in functions that relate to the data extraction.
AAPL, D
AAPL, M
BLX, D
BLX, W
BLX, M