Auction Context Engine ( Value Area, VWAP & Regime)📌 Indicator Name
Auction Context Engine (Value Area, VWAP & Regime)
Short name: ACE Context
🧠 Description
Auction Context Engine (ACE) is a professional market context and structure indicator based on Auction Market Theory.It is designed to help traders understand where the market is positioned, not to generate trade signals.
ACE focuses on:
• Developing Value Area (VAH / VAL)
• Developing Point of Control (POC)
• Session VWAP positioning
• Volatility regime expansion
• Opening Range context
• Failed auction / trap detection
• Market bias and environment quality
This indicator provides context only and is intended to be used alongside a separate execution strategy or system.
🎯 What This Indicator Is
✔ A context engine
✔ A market structure filter
✔ A bias alignment tool
✔ A regime and environment classifier
❌ What This Indicator Is NOT
✘ Not a signal generator
✘ Not a buy/sell system
✘ Not a strategy
✘ Not a profitability promise
📊 How To Use
Use ACE to answer:
• Is price accepting or rejecting value?
• Is the market in balance or expansion?
• Is VWAP supporting or opposing price?
• Is this a breakout environment or a trap?
• Is volatility expanding?
• Is the market trending or ranging?
You may then use your own execution strategy aligned with this context.
🟢 Core Components
Developing Value Area
• VAH / VAL dynamically update through the session
• POC tracks highest traded volume area
VWAP Position
• Above VWAP = bullish bias
• Below VWAP = bearish bias
Opening Range Context
• Detects breakouts or balance after session open
Volatility Regime
• Identifies expansion vs normal conditions
Failed Auction Detection
• Highlights trap conditions near value extremes
Market Quality
• Strong / Mixed / Weak environment classification
Context Table
• Clean 1-column vertical dashboard with color-coded bias
🔵 Visual Elements
• Developing VAH, VAL, POC lines
• Session VWAP
• Small context dots when environment turns READY
• Compact professional context table
⚙️ Settings
• Value Area bin size
• Value area percentage
• Opening range duration
• Regime expansion factor
• Line colors and thickness
• Context table ON/OFF
• Context dots ON/OFF
🧩 Best Use Case
This indicator is ideal for:
• Intraday trading
• Index futures and equities
• Options context filtering
• Trend / range regime identification
• Professional discretionary traders
⚠️ Disclaimer
This script is provided for educational and informational purposes only.It does not constitute financial or investment advice.Trading involves risk. Always use proper risk management.
Market-profile

Advanced Volume Profile Pro Delta + POC + VAH/VAL# Advanced Volume Profile Pro - Delta + POC + VAH/VAL Analysis System
## WHAT THIS SCRIPT DOES
This script creates a comprehensive volume profile analysis system that combines traditional volume-at-price distribution with delta volume calculations, Point of Control (POC) identification, and Value Area (VAH/VAL) analysis. Unlike standard volume indicators that show only total volume over time, this script analyzes volume distribution across price levels and estimates buying vs selling pressure using multiple calculation methods to provide deeper market structure insights.
## WHY THIS COMBINATION IS ORIGINAL AND USEFUL
**The Problem Solved:** Traditional volume indicators show when volume occurs but not where price finds acceptance or rejection. Standalone volume profiles lack directional bias information, while basic delta calculations don't provide structural context. Traders need to understand both volume distribution AND directional sentiment at key price levels.
**The Solution:** This script implements an integrated approach that:
- Maps volume distribution across price levels using configurable row density
- Estimates delta (buying vs selling pressure) using three different methodologies
- Identifies Point of Control (highest volume price level) for key support/resistance
- Calculates Value Area boundaries where 70% of volume traded
- Provides real-time alerts for key level interactions and volume imbalances
**Unique Features:**
1. **Developing POC Visualization**: Real-time tracking of Point of Control migration throughout the session via blue dotted trail, revealing institutional accumulation/distribution patterns before they complete
2. **Multi-Method Delta Calculation**: Price Action-based, Bid/Ask estimation, and Cumulative methods for different market conditions
3. **Adaptive Timeframe System**: Auto-adjusts calculation parameters based on chart timeframe for optimal performance
4. **Flexible Profile Types**: N Bars Back (precise control), Days Back (calendar-based), and Session-based analysis modes
5. **Advanced Imbalance Detection**: Identifies and highlights significant buying/selling imbalances with configurable thresholds
6. **Comprehensive Alert System**: Monitors POC touches, Value Area entry/exit, and major volume imbalances
## HOW THE SCRIPT WORKS TECHNICALLY
### Core Volume Profile Methodology:
**1. Price Level Distribution:**
- Divides price range into user-defined rows (10-50 configurable)
- Calculates row height: `(Highest Price - Lowest Price) / Number of Rows`
- Distributes each bar's volume across price levels it touched proportionally
**2. Delta Volume Calculation Methods:**
**Price Action Method:**
```
Price Range = High - Low
Buy Pressure = (Close - Low) / Price Range
Sell Pressure = (High - Close) / Price Range
Buy Volume = Total Volume × Buy Pressure
Sell Volume = Total Volume × Sell Pressure
Delta = Buy Volume - Sell Volume
```
**Bid/Ask Estimation Method:**
```
Average Price = (High + Low + Close) / 3
Buy Volume = Close > Average ? Volume × 0.6 : Volume × 0.4
Sell Volume = Total Volume - Buy Volume
```
**Cumulative Method:**
```
Buy Volume = Close > Open ? Volume : Volume × 0.3
Sell Volume = Close ≤ Open ? Volume : Volume × 0.3
```
**3. Point of Control (POC) Identification:**
- Scans all price levels to find maximum volume concentration
- POC represents the price level with highest trading activity
- Acts as significant support/resistance level
- **Developing POC Feature**: Tracks POC evolution in real-time via blue dotted trail, showing how institutional interest migrates throughout the session. Upward POC migration indicates accumulation patterns, downward migration suggests distribution, providing early trend signals before price confirmation.
**4. Value Area Calculation:**
- Starts from POC and expands up/down to encompass 70% of total volume
- VAH (Value Area High): Upper boundary of value area
- VAL (Value Area Low): Lower boundary of value area
- Expansion algorithm prioritizes direction with higher volume
**5. Adaptive Range Selection:**
Based on profile type and timeframe optimization:
- **N Bars Back**: Fixed lookback period with performance optimization (20-500 bars)
- **Days Back**: Calendar-based analysis with automatic timeframe adjustment (1-365 days)
- **Session**: Current trading session or custom session times
### Performance Optimization Features:
- **Sampling Algorithm**: Reduces calculation load on large datasets while maintaining accuracy
- **Memory Management**: Clears previous drawings to prevent performance degradation
- **Safety Constraints**: Prevents excessive memory usage with configurable limits
## HOW TO USE THIS SCRIPT
### Initial Setup:
1. **Profile Configuration**: Select profile type based on trading style:
- N Bars Back: Precise control over data range
- Days Back: Intuitive calendar-based analysis
- Session: Real-time session development
2. **Row Density**: Set number of rows (30 default) - more rows = higher resolution, slower performance
3. **Delta Method**: Choose calculation method based on market type:
- Price Action: Best for trending markets
- Bid/Ask Estimate: Good for ranging markets
- Cumulative: Smoothed approach for volatile markets
4. **Visual Settings**: Configure colors, position (left/right), and display options
### Reading the Profile:
**Volume Bars:**
- **Length**: Represents relative volume at that price level
- **Color**: Green = net buying pressure, Red = net selling pressure
- **Intensity**: Darker colors indicate volume imbalances above threshold
**Key Levels:**
- **POC (Blue Line)**: Highest volume price - major support/resistance
- **VAH (Purple Dashed)**: Value Area High - upper boundary of fair value
- **VAL (Orange Dashed)**: Value Area Low - lower boundary of fair value
- **Value Area Fill**: Shaded region showing main trading range
**Developing POC Trail:**
- **Blue Dotted Lines**: Show real-time POC evolution throughout the session
- **Migration Patterns**: Upward trail indicates bullish accumulation, downward trail suggests bearish distribution
- **Early Signals**: POC movement often precedes price movement, providing advance warning of institutional activity
- **Institutional Footprints**: Reveals where smart money concentrated volume before final POC establishment
### Trading Applications:
**Support/Resistance Analysis:**
- POC acts as magnetic price level - expect reactions
- VAH/VAL provide intermediate support/resistance levels
- Profile edges show areas of low volume acceptance
**Developing POC Analysis:**
- **Upward Migration**: POC moving higher = institutional accumulation, bullish bias
- **Downward Migration**: POC moving lower = institutional distribution, bearish bias
- **Stable POC**: Tight clustering = balanced market, range-bound conditions
- **Early Trend Detection**: POC direction change often precedes price breakouts
**Entry Strategies:**
- Buy at VAL with POC as target (in uptrends)
- Sell at VAH with POC as target (in downtrends)
- Breakout plays above/below profile extremes
**Volume Imbalance Trading:**
- Strong buying imbalance (>60% threshold) suggests continued upward pressure
- Strong selling imbalance suggests continued downward pressure
- Imbalances near key levels provide high-probability setups
**Multi-Timeframe Context:**
- Use higher timeframe profiles for major levels
- Lower timeframe profiles for precise entries
- Session profiles for intraday trading structure
## SCRIPT SETTINGS EXPLANATION
### Volume Profile Settings:
- **Profile Type**: Determines data range for calculation
- N Bars Back: Exact number of bars (20-500 range)
- Days Back: Calendar days with timeframe adaptation (1-365 days)
- Session: Trading session-based (intraday focus)
- **Number of Rows**: Profile resolution (10-50 range)
- **Profile Width**: Visual width as chart percentage (10-50%)
- **Value Area %**: Volume percentage for VA calculation (50-90%, 70% standard)
- **Auto-Adjust**: Automatically optimizes for different timeframes
### Delta Volume Settings:
- **Show Delta Volume**: Enable/disable delta calculations
- **Delta Calculation Method**: Choose methodology based on market conditions
- **Highlight Imbalances**: Visual emphasis for significant volume imbalances
- **Imbalance Threshold**: Percentage for imbalance detection (50-90%)
### Session Settings:
- **Session Type**: Daily, Weekly, Monthly, or Custom periods
- **Custom Session Time**: Define specific trading hours
- **Previous Sessions**: Number of historical sessions to display
### Days Back Settings:
- **Lookback Days**: Number of calendar days to analyze (1-365)
- **Automatic Calculation**: Script automatically converts days to bars based on timeframe:
- Intraday: Accounts for 6.5 trading hours per day
- Daily: 1 bar per day
- Weekly/Monthly: Proportional adjustment
### N Bars Back Settings:
- **Lookback Bars**: Exact number of bars to analyze (20-500)
- **Precise Control**: Best for systematic analysis and backtesting
### Visual Customization:
- **Colors**: Bullish (green), Bearish (red), and level colors
- **Profile Position**: Left or Right side of chart
- **Profile Offset**: Distance from current price action
- **Labels**: Show/hide level labels and values
- **Smooth Profile Bars**: Enhanced visual appearance
### Alert Configuration:
- **POC Touch**: Alerts when price interacts with Point of Control
- **VA Entry/Exit**: Alerts for Value Area boundary interactions
- **Major Imbalance**: Alerts for significant volume imbalances
## VISUAL FEATURES
### Profile Display:
- **Horizontal Bars**: Volume distribution across price levels
- **Color Coding**: Delta-based coloring for directional bias
- **Smooth Rendering**: Optional smoothing for cleaner appearance
- **Transparency**: Configurable opacity for chart readability
### Level Lines:
- **POC**: Solid blue line with optional label
- **VAH/VAL**: Dashed colored lines with value displays
- **Extension**: Lines extend across relevant time periods
- **Value Area Fill**: Optional shaded region between VAH/VAL
### Information Table:
- **Current Values**: Real-time POC, VAH, VAL prices
- **VA Range**: Value Area width calculation
- **Positioning**: Multiple table positions available
- **Text Sizing**: Adjustable for different screen sizes
## IMPORTANT USAGE NOTES
**Realistic Expectations:**
- Volume profile analysis provides structural context, not trading signals
- Delta calculations are estimations based on price action, not actual order flow
- Past volume distribution does not guarantee future price behavior
- Combine with other analysis methods for comprehensive market view
**Best Practices:**
- Use appropriate profile types for your trading style:
- Day Trading: Session or Days Back (1-5 days)
- Swing Trading: Days Back (10-30 days) or N Bars Back
- Position Trading: Days Back (60-180 days)
- Consider market context (trending vs ranging conditions)
- Verify key levels with additional technical analysis
- Monitor profile development for changing market structure
**Performance Considerations:**
- Higher row counts increase calculation complexity
- Large lookback periods may affect chart performance
- Auto-adjust feature optimizes for most use cases
- Consider using session profiles for intraday efficiency
**Limitations:**
- Delta calculations are estimations, not actual transaction data
- Profile accuracy depends on available price/volume history
- Effectiveness varies across different instruments and market conditions
- Requires understanding of volume profile concepts for optimal use
**Data Requirements:**
- Requires volume data for accurate calculations
- Works best on liquid instruments with consistent volume
- May be less effective on very low volume or exotic instruments
This script serves as a comprehensive volume analysis tool for traders who need detailed market structure information with integrated directional bias analysis and real-time POC development tracking for informed trading decisions.

Intraday Volume Profile [BigBeluga]The Intraday Volume Profile aims to show delta volume on lower timeframes to spot trapped shorts at the bottom or trapped longs at the top, with buyers pushing the price up at the bottom and sellers at the top acting as resistance.
🔶 FEATURES
The indicator includes the following features:
LTF Delta precision (timeframe)
Sensibility color - adjust gradient color sensitivity
Source - source of the candle to use as the main delta calculation
Color mode - display delta coloring in different ways
🔶 DELTA EXAMPLE
In the image above, we can see how delta is created.
If delta is positive, we know that buyers have control over sellers, while if delta is negative, we know sellers have control over buyers.
Using this data, we can spot interesting trades and identify trapped individuals within the candle.
🔶 HOW TO USE
In the image above, we can see how shorts are trapped at the bottom of the wick (red + at the bottom), leading to a pump also called a "short squeeze."
Same example as before, but with trapped longs (blue + at the top).
This can also work as basic support and resistance, for example, trapped shorts at the bottom with positive delta at the bottom acting as strong support for price.
Users can have the option to also display delta data within the corresponding levels, showing Buyers vs Sellers for more precise trading ideas.
NOTE:
User can only display the most recent data for the last 8 buyers and sellers.
It is recommended to use a hollow candle while using this script.

Session TPO Market ProfileIntroduction
Wikipedia: A Market Profile is an intra-day charting technique (price vertical, time/activity horizontal) devised by J. Peter Steidlmayer, a trader at the Chicago Board of Trade (CBOT), ca 1959-1985. Steidlmayer was seeking a way to determine and to evaluate market value as it developed in the day time frame. The concept was to display price on a vertical axis against time on the horizontal, and the ensuing graphic generally is a bell shape--fatter at the middle prices, with activity trailing off and volume diminished at the extreme higher and lower prices. In this structure he recognized the 'normal', Gaussian distribution he had been introduced to in college statistics.
Important : The market profile tool is designed to be used on the 30min timeframe, however, you can modify its parameters and use it on lower timeframes (15/10/5min)
This indicators displays the following information
Session open
TPO
Value area calculation zone
POC
Highlight of Single prints
Session High/Low
The current price (TPO Profile is often used isolated without any candlesticks on it)
Parameters
Session beginning configuration (not coded with a session input yet)
Number of candles to use for calculation (default 13 for a single session)
Extend yesterday's levels (VAH/VAL/POC)
Show/Hide Market profile calculation area (background color)
Bars number (number of rows that will be used to draw the profile)
Show/Hide TPO's
TPO Colors customization (For in/out of VA, VAL/VAH/POC/High/Low levels and single prints)
Show/Hide High/Low levels
Show/Hide VAL/VAH/POC Levels as lines
Enable/Disable Single prints highlighting
Value area size (as percent)
Show/Hide current price (corresponding to a line scaled on the "close" price)
Additional Notes
Each session is drawn when the day is over
To use as much space as possible, TPO's are not directly drawn on the area of their calculation (which can be confusing if you use candlesticks directly over it)
This script will probably be updated in the future (especially concerning its implementation which is a bit spaghetti coded for now) .
If you have interesting suggestions about new features that are usual within market profile tools and missing from this script , don't hesitate to suggest it.

Market Profile Fixed ViewSome instruments does not provide any volume information, therefore, as a fixed volume profile user, I needed a fixed market profile indicator to use the same principles, regardless of whether the volumes are available or not.
This script draws a market profile histogram corresponding to price variations within a specific duration, you only need to specify Start and End date/time values to see the histogram on your chart.
Details
Two lines corresponding to highest/lowest prices are displayed around the histogram
The redline corresponds to the POC (point of control)
Options
Start calculation
End calculation
Bars number (histogram resolution, currently locked to a max value of 50 bars)
Display side/Width (allows to modify size of bars, to the left or to the right)
Bars/Borders/POC Color customization
Notes
This script will probably be updated (to add VAH/VAL zones, and maybe other options). However, some common market profile attributes have not been implemented yet since I don't really use them)

Market Profile Visible RangeSup TV, 2 important points .
1) surprisingly, it's the first MP Visible Range script on TV;
2) This one doesn't use any bagging/binning*, instead each row represents the time spent on the actual minimal price steps (aka ticks).
The script will be further extended with usual market profile related functionally in future updates. At this point we have:
- Profile itself (each row represents how many bars touch the given price);
- Mode of the profile (called POC)**;
* Still it will be introduced in future when I will find / design the proper aggregating technique. It is vital for processing very wide price ranges (for example, 500 days on ES futures).
** The script correctly calculates POC by finding all the modes in the data & choosing the closest one to data's midrange.
For this kind of technical instrument finally it was more convenient to use Pine Script 5 (btw it's my first Pine 5).
Basically this script is a side-effect of another R&D I'm doing, the stuff is useful tho so let's go.
By choosing length we both specify the amount of data to be processed & the profile's location screen-wise. It's pretty cool and & useful, on my screen it's always almost touching the left side and still always visible.
The code is heavily commented in order to be understood fast, nothing fantastic, just a lil patience required this time.
Rationale
Market & volume profiles are well known concepts, lotta info available, the most important point of all that is that MP is just another way of visualizing data that lets you notice things you don't usually notice on sequential charts. From my side I can only add that it's better to use your own brain for thinking and reconsidering using volume profile in all the cases, especially on decentralized markets (unless you're aggregating ALL the volume data from everywhere, including options, OTC etc).
Here is it, for you

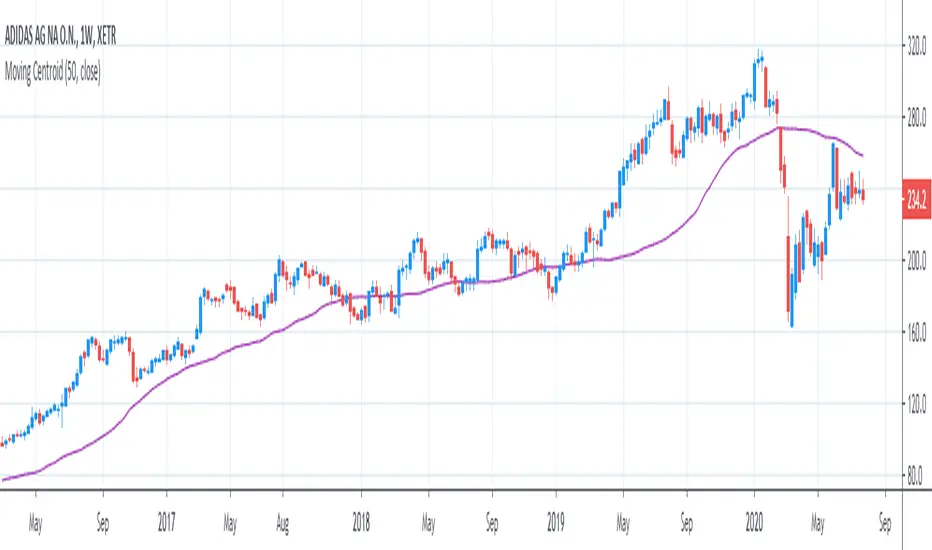
[R&D] Moving CentroidThis script utilizes this concept. Instead of weighting by volume, it weights by amount of price action on every close price of the rolling window. I assume it can be used as an additional reference point for price mode and price antimode.
it is directly connected with Market (not volume) profile, or TPO charts.
The algorithm:
1) takes a rolling window of, for example, 50 data points of close prices:
2) for each of this closing prices, the algorithm will check how many bars touched this close price.
3) then: sum of datapoints * weights/sum of weights
Since the logic is implemented in pretty non-efficient way, the script sometimes can take time to make calculations. Moreover, it calculates the centroid taking into account only close prices, not every tick. of a given rolling window That's why it's still experimental.
Market Profile for Futures with Session and After Hours SplitAdapted existing Market Profile scripts to be move suitable for Futures Markets with Session and After Hours split
Script Provides split Market Profiles for Session and After Hours
Users can customize the Session and AH hours inputs to suit any ticker and their interpretation of prime and non-prime hours
