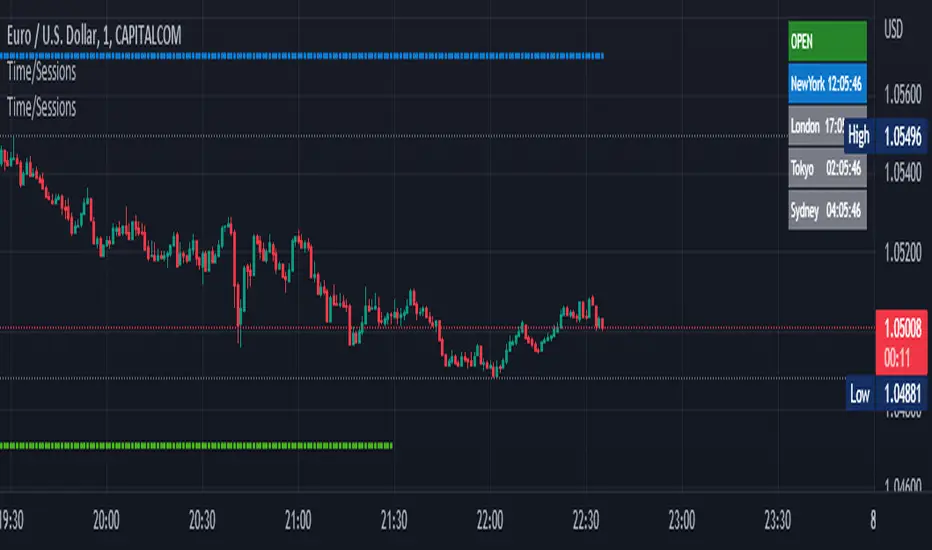
Major Trading Sessions IndicatorsThis indicator displays vertical lines on your chart to mark the opening times of the major global trading sessions (Tokyo, Shanghai/HK, London, and New York). As a crypto trader I want to find price action patterns after sessions open.
It's fully customizable and extendable (you could add closing time for sessions as well)
Works best on short timeframes.
Features:
6 configurable vertical lines (4 preset for major sessions + 2 custom)
Each line shows a customizable label (e.g., "Tokyo", "London")
Individual time and color settings for each line
UTC offset for each line to handle Daylight Saving Time
Option to fix all labels at a specific price level for cleaner appearance (need to set and save it for each chart, it becomes a mess if you don't). Default behavior and limit of Pine Script is that it will be attached to the price wick.
Default Sessions:
Tokyo: 00:00 UTC (midnight)
Shanghai/HK: 01:30 UTC
London: 08:00 UTC (winter) - adjust offset to +1 for summer
New York: 13:00 UTC (winter) - adjust offset to -4 for summer
DST Adjustments:
Simply change the UTC offset when daylight saving time begins/ends:
London: 0 (winter) or +1 (summer)
New York: -5 (winter) or -4 (summer)
Lines extend from top to bottom of the chart and appear precisely when each session opens.
My preferred configuration: shorten names and reduce opacity of colors to 20-30%.
Markets

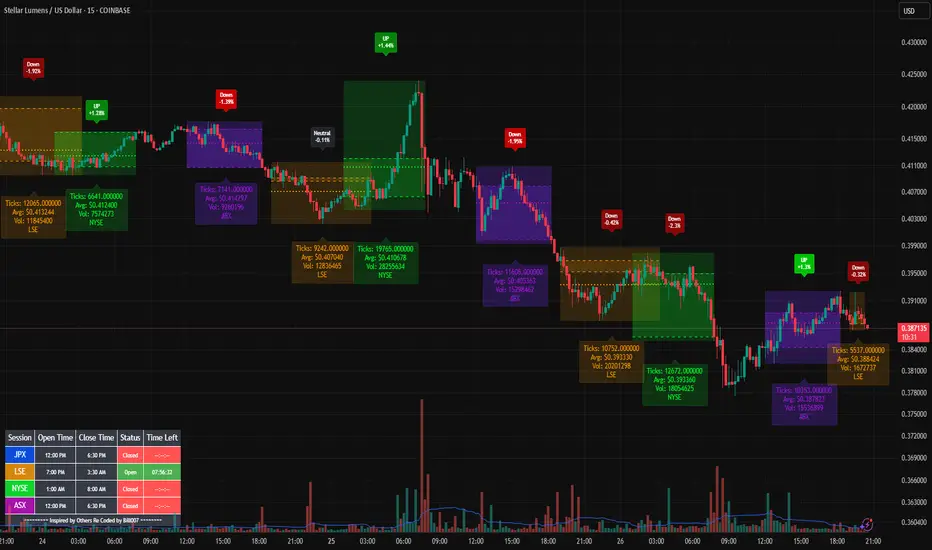
Bills Advanced Market Sessions V5Bill007 Advanced Enhanced Market Sessions & Table V5 is a TradingView Pine Script indicator that
visualizes major stock market sessions and data for (Tokyo, London, New York, Sydney, Frankfurt) on charts.
**Purpose and Logic:**
- Visual Displays include session boxes, open/close/average lines, labels for session
names/metrics (ticks, avg price, volume), and trend labels (UP/Down/Neutral with % change)
and a Debug table.
- Uses custom types (SessionDisplay, SessionInfo) and methods to create/update sessions
dynamically, handling multi-part sessions (e.g., Tokyo breaks).
- Batch updates sessions for efficiency, checks timezones, weekdays, and daily changes to avoid
duplicates.
- Includes tables for session times/status/countdowns and debug metrics (tick range, average
price, volume, trend %, open, close).
- Supports 25 timezones for accurate global session timing.
- All labels have dynamaic tooltips that provide extra outputs which saves chart clutter
- Realtime lastbar session updates for current session
**Settings:**
- Select Market Sessions to suit
- Toggles for lines, ranges, averages, volumes, labels, boxes, weekends.
- Customizable colors, timezones, session times, thresholds for neutral trends, label offsets to
move labels around for clearer visuals.
- Table position/timezone, debug options.
- Timezone select to update Session times open close according to what time zone you're in
**Benefits:**
- Enhanced session data at a glance
- Enhances multi-market awareness, highlights session overlaps, trends, and key metrics.
- Aids timing entries/exits, volume analysis, reduces clutter with toggles.
- Supports global trading strategies with accurate timezone handling and visuals.
ML Compressor Enhanced Trading Indicator# 🤖 ML Enhanced Trading Indicator - Advanced Market Analysis
## 📊 Overview
This is a comprehensive Machine Learning Enhanced Trading Indicator that combines multiple advanced analytical techniques to provide high-probability trading signals. The indicator uses artificial intelligence, pattern recognition, anomaly detection, and traditional technical analysis to identify optimal entry and exit points in the market.
## 🚀 Key Features
### 🧠 **Machine Learning Core**
- **Advanced Pattern Recognition**: Uses cosine similarity, Pearson correlation, and Spearman rank correlation to identify historical patterns
- **AI-Powered Predictions**: Implements multiple correlation methods to forecast price movements
- **Anomaly Detection**: Z-score based detection system for unusual market activities
- **Signal Confidence Scoring**: Reliability assessment for each trading signal
### 📈 **Technical Analysis Integration**
- **Multi-Timeframe RSI Analysis**: 14 and 21-period RSI with oversold/overbought detection
- **MACD Momentum**: Enhanced MACD histogram analysis for trend confirmation
- **Bollinger Bands Position**: Dynamic position tracking within BB channels
- **Volume Analysis**: Spike and dry volume detection with ratio calculations
- **Trend Strength Measurement**: EMA-based trend power analysis
### 🎯 **Perfect Zone Detection**
- **Ideal Buy Zone**: Identifies perfect buying opportunities when 7 conditions align:
- ML Score ≥ 0.60
- Bottom proximity detection
- RSI in 20-35 range
- Volume spike confirmation
- Positive price anomaly
- Bullish pattern match
- Positive MACD momentum
### 📊 **Comprehensive Display Table**
- **Real-time ML Analysis**: Complete breakdown of all indicators
- **Perfect Buy Conditions Tracker**: Visual checklist with completion percentage
- **Performance Metrics**: Win rate tracking and P&L analysis
- **Signal Strength Indicators**: Confidence levels for each signal
## 🔧 **Customizable Parameters**
### **ML Settings**
- **ML Lookback Period**: 20-500 bars (default: 100)
- **Anomaly Threshold**: 1.0-5.0 sensitivity (default: 2.0)
- **Pattern Similarity**: 0.5-0.99 matching threshold (default: 0.80)
- **AI Lookback Period**: 20-200 bars (default: 50)
### **AI Prediction Models**
- **Correlation Methods**: Spearman, Pearson, Cosine Similarity
- **Forecast Length**: 15-250 bars (default: 50)
- **Similarity Type**: Price or %Change analysis
### **Visual Options**
- **Table Position**: Top/Bottom Left/Right positioning
- **Table Size**: Small, Normal, Large options
- **Signal Display**: Toggle buy/sell signals on/off
- **AI Visualization**: Optional prediction paths and ZigZag
## 📋 **How to Use**
### **For Beginners**
1. Add the indicator to your chart
2. Look for "PERFECT BUY" signals in the table
3. Wait for completion percentage ≥ 85% for highest probability trades
4. Use the background color changes as visual confirmation
### **For Advanced Traders**
1. Analyze individual ML components in the detailed table
2. Monitor anomaly detection for unusual market conditions
3. Use pattern confidence levels for trade timing
4. Combine with your existing strategy for confirmation
### **Signal Interpretation**
- **🟢 PERFECT BUY**: All 7 conditions met - highest probability reversal
- **🟡 NEAR BOTTOM**: Close to ideal conditions - monitor closely
- **🔴 NOT READY**: Wait for better setup
- **Strong Buy/Sell Signals**: ML score-based entries with high confidence
## ⚠️ **Important Notes**
### **Risk Management**
- This indicator provides analysis and signals, not guaranteed outcomes
- Always use proper risk management and position sizing
- Consider market conditions and fundamental factors
- Backtest the strategy on your preferred timeframes and assets
### **Best Practices**
- Use multiple timeframe analysis for confirmation
- Combine with support/resistance levels
- Monitor volume confirmation for all signals
- Set appropriate stop-losses and profit targets
### **Performance Tracking**
- The indicator tracks its own performance with win rate calculations
- Monitor the "AI Prediction" accuracy percentage
- Use the P&L tracking to assess signal quality over time
## 🔄 **Updates and Improvements**
This indicator is continuously evolving with:
- Enhanced machine learning algorithms
- Improved pattern recognition capabilities
- Additional correlation methods for better accuracy
- Performance optimization for faster calculations
- New visualization features based on user feedback
## 📚 **Technical Details**
### **Machine Learning Implementation**
- **Pattern Matching**: 20-bar normalized price patterns with historical comparison
- **Correlation Analysis**: Mathematical similarity scoring between current and historical patterns
- **Anomaly Detection**: Statistical Z-score analysis across price, volume, and RSI
- **Signal Weighting**: Multi-factor scoring system with optimized weights
### **Algorithm Components**
1. **Feature Extraction**: Price, volume, momentum, volatility, and trend features
2. **Pattern Recognition**: Historical pattern database with similarity matching
3. **Anomaly Detection**: Multi-dimensional Z-score threshold analysis
4. **Signal Generation**: Weighted scoring system with confidence intervals
5. **Performance Tracking**: Real-time win rate and accuracy monitoring
### **Calculation Methods**
- **Trend Strength**: (EMA8 - EMA21) / EMA21 * 100
- **Volume Ratio**: Current Volume / 20-period SMA Volume
- **BB Position**: (Close - BB_Lower) / (BB_Upper - BB_Lower)
- **Anomaly Score**: Average of normalized Z-scores for price, volume, and RSI
## 🎨 **Visual Elements**
### **Background Colors**
- **Light Green**: Perfect buy zone detected
- **Light Red**: Perfect sell zone detected
- **Light Blue**: Near bottom proximity
- **Green/Red Transparency**: Price anomaly detection
### **Signal Shapes**
- **Green Triangle Up**: Strong buy signal
- **Red Triangle Down**: Strong sell signal
- **Aqua Diamond**: Perfect buy zone entry
- **Purple Diamond**: Perfect sell zone entry
### **Table Information**
- **ML Complete Analysis**: 16 comprehensive metrics
- **Perfect Buy Conditions**: 7-point checklist with status indicators
- **Real-time Values**: Live updating of all calculations
- **Color-coded Status**: Green (good), Yellow (moderate), Red (caution)
## 🔍 **Troubleshooting**
### **Common Issues**
- **Table Not Showing**: Enable "Show ML Table" in settings
- **No Signals Appearing**: Check "Show Buy/Sell Signals" option
- **Performance Issues**: Reduce ML Lookback Period for faster calculation
- **Too Many/Few Signals**: Adjust Anomaly Threshold sensitivity
### **Optimization Tips**
- **For Day Trading**: Use lower timeframes (1m, 5m, 15m) with reduced lookback periods
- **For Swing Trading**: Use higher timeframes (1h, 4h, 1D) with standard settings
- **For Scalping**: Enable only strong signals and reduce pattern similarity threshold
- **For Long-term**: Increase all lookback periods and use daily/weekly timeframes
## 📖 **Disclaimer**
This indicator is for educational and informational purposes only. It should not be considered as financial advice. Trading involves substantial risk of loss and is not suitable for all investors. Past performance does not guarantee future results.
### **Risk Warning**
- All trading involves risk of substantial losses
- Never risk more than you can afford to lose
- This indicator does not guarantee profitable trades
- Always use proper risk management techniques
- Consider consulting with a financial advisor
### **Liability**
The creator of this indicator is not responsible for any losses incurred from its use. Users should thoroughly test and understand the indicator before using it with real money.
### **Feature Requests**
- Suggest improvements through TradingView comments
- Report bugs with detailed descriptions
- Share successful strategies using the indicator
- Contribute to community discussions
## 🏆 **Credits and Acknowledgments**
This indicator builds upon various open-source libraries and mathematical concepts:
- TradingView ZigZag library for visualization
- Statistical correlation methods from academic research
- Machine learning concepts adapted for financial markets
- Community feedback and testing contributions
## 📈 **Performance Metrics**
The indicator includes built-in performance tracking:
- **Win Rate Calculation**: Percentage of profitable signals
- **Signal Accuracy**: ML prediction vs actual price movement
- **Drawdown Tracking**: Current unrealized P&L from last signal
- **Completion Percentage**: How many perfect conditions are met
## 🔬 **Mathematical Foundation**
### **Correlation Calculations**
- **Pearson**: Measures linear correlation between patterns
- **Spearman**: Rank-based correlation for non-linear relationships
- **Cosine Similarity**: Vector-based similarity for pattern matching
### **Statistical Methods**
- **Z-Score**: (Value - Mean) / Standard Deviation
- **Pattern Normalization**: Price / Price
- **Volatility Percentile**: Historical ranking of current volatility
- **Momentum Calculation**: Price change over multiple periods
## 🎯 **Trading Strategies**
### **Conservative Approach**
- Wait for Perfect Buy Zone (85%+ completion)
- Use higher timeframes for confirmation
- Set stop-loss at recent swing low
- Take profits at resistance levels
### **Aggressive Approach**
- Trade on Strong Buy/Sell signals
- Use lower completion thresholds (70%+)
- Tighter stop-losses with faster exits
- Higher position sizes with confirmed trends
### **Hybrid Strategy**
- Combine with other indicators for confirmation
- Use different settings for different market conditions
- Scale in/out based on signal strength
- Adjust parameters based on market volatility

Institutional Sessions Overlay (Asia/London/NY)Institutional Sessions Overlay is a professional TradingView indicator that visually highlights the main trading sessions (Asia, London, and New York) directly on your chart.
Customizable: Easily adjust session start and end times (including minutes) for each market.
Timezone Alignment: Shift session boxes using the timezone offset parameter so sessions match your chart’s timezone exactly.
Clear Visuals: Colored boxes and optional labels display session opens and closes for fast institutional market structure reference.
Toggle Labels: Show or hide session open/close labels with a single click for a clean or detailed look.
Intuitive UI: User-friendly grouped settings for efficient configuration.
This tool is designed for day traders, institutional traders, and anyone who wants to instantly recognize global session timing and ranges for SMC, ICT, and other session-based strategies.
How to use:
Set your chart to your local timezone.
Use the "Session timezone offset" setting if session boxes do not match actual session opens on your chart.
Adjust the hours and minutes for each session as needed.
Enable or disable labels in the “Display” settings group.
Tip: Use the overlay to spot session highs and lows, volatility windows, and institutional liquidity sweeps.

Market Session Times by MadDogMoneyMarket Sessions is a simple indicator allowing you to quickly see the 3 Major Trading Session Open and Close times
Three major Sessions - Asia, UK & NY are included.
(The Australian & Asian markets are so close on time, they have been joined for brevity.)
The Open & Close times for each Session is displayed in the Settings in UTC and can be edited depending on the time of year or market you are following.
By setting the Session indicators partially transparent (as is by default), you can quickly see which Market Sessions, and for how long, they overlap.
Additionally, the Indicator can be hidden for different timeframes.
- 1 HR is the upper limit of visibility
- Visibility on the 1HR, 15min and 5min and below can be toggled on an off to fit your requirements.

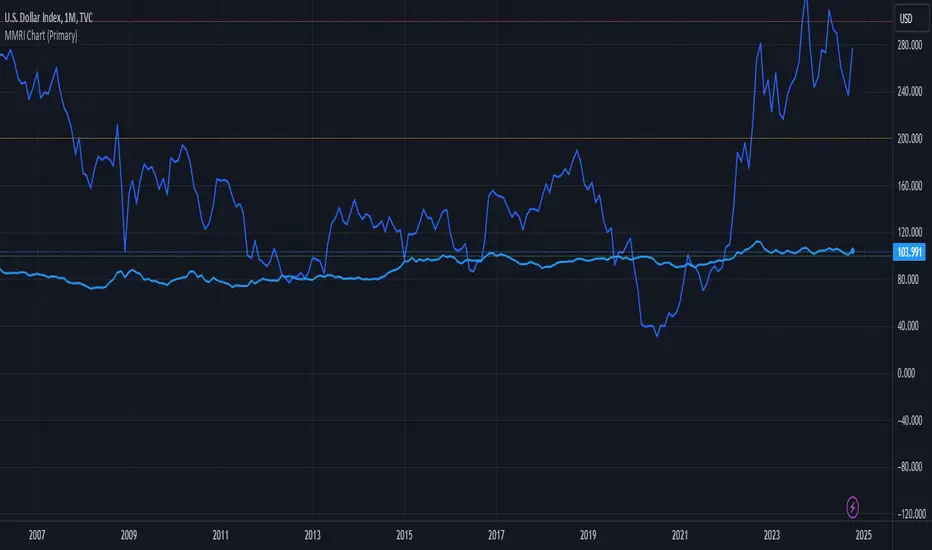
MMRI Chart (Primary)The **Mannarino Market Risk Indicator (MMRI)** is a financial risk measurement tool created by financial strategist Gregory Mannarino. It’s designed to assess the risk level in the stock market and economy based on current bond market conditions and the strength of the U.S. dollar. The MMRI considers factors like the U.S. 10-Year Treasury Yield and the Dollar Index (DXY), which indicate investor confidence in government debt and the dollar's purchasing power, respectively.
The formula for MMRI uses the 10-Year Treasury Yield multiplied by the Dollar Index, divided by a constant (1.61) to normalize the risk measure. A higher MMRI score suggests increased market risk, while a lower score indicates more stability. Mannarino has set certain thresholds to interpret the MMRI score:
- **Below 100**: Low risk.
- **100–200**: Moderate risk.
- **200–300**: High risk.
- **Above 300**: Extreme risk, indicating market instability and potential downturns.
This tool aims to provide insight into economic conditions that may affect asset classes like stocks, bonds, and precious metals. Mannarino often updates MMRI scores and risk analyses in his public market updates.
Ultra SessionsThe "Ultra Sessions" indicator is designed to enhance your trading strategy by clearly marking key market sessions and their associated "kill zones" directly on your chart. This powerful tool supports multiple time zones and provides customizable alerts for session opens, closes, and critical kill zones, ensuring you never miss important market movements.
Customizable Time Zones: Align the indicator with your local time by selecting from a wide range of global time zones.
Market Session Tracking: Visually track the New York, London, and Tokyo trading sessions with distinct color-coded markers.
Kill Zones: Highlight the high-volatility periods within each session to focus on key trading opportunities.
Alert System: Receive real-time alerts for session openings, closings, and kill zones, so you stay informed without constantly monitoring the chart.
Flexible Positioning: Choose the positioning of session markers to fit your chart layout, whether at the top or bottom.
Ideal for traders who want to optimize their entry and exit points by focusing on the most active and volatile times in the market, the indicator is a must-have for any serious trading setup.

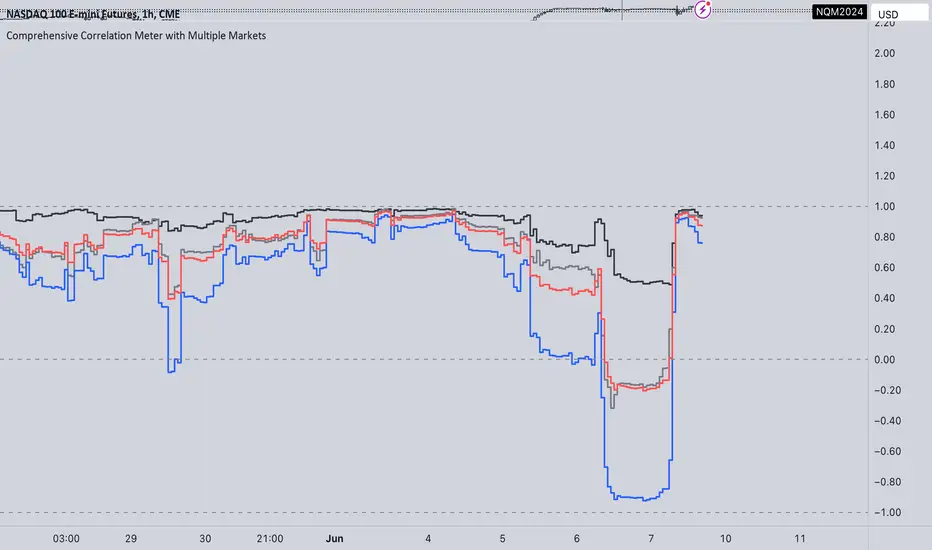
Comprehensive Correlation Meter with Multiple MarketsThe Comprehensive Correlation Meter is designed to provide traders and investors with insights into the relationships between multiple financial instruments. This script expands upon an existing idea on TradingView about correlation by introducing the ability to analyze the correlation between three markets, offering deeper insights into market relationships. It helps users understand how these markets move in relation to each other, aiding in risk management and portfolio diversification.
Key Features:
Multiple Market Analysis: This script allows you to analyze the correlation between your primary market and two other selected markets.
Customizable Inputs: Users can select any symbols for the reference and third markets, and these selections must be confirmed before use.
Correlation Coefficients: Calculates and plots the correlation coefficients for:
Current Market vs. Reference Market
Third Market vs. Reference Market
Current Market vs. Third Market
An average correlation of all three markets combined.
Visual Aids: Plots reference lines at +1, 0, and -1 to indicate maximum positive correlation, no correlation, and maximum negative correlation.
How It Works:
Input Symbols: Select the symbols for the reference and third markets. The current market is based on the chart you are viewing.
Data Collection: The script collects the closing prices of the selected markets and calculates the percentage changes.
Correlation Calculation: Using the collected data, the script computes the covariance and standard deviations to determine the correlation coefficients.
Visualization: The correlation coefficients and covariances are plotted for visual analysis.
How to Use:
Select Symbols:
Use the input fields to specify the reference and third market symbols. Confirm your selections to proceed.
Customize Display:
Choose whether to display the covariance, reference market, current market, and third market.
Select which correlation coefficients to display.
Interpret Results:
A correlation coefficient close to +1 indicates a strong positive correlation.
A coefficient close to -1 indicates a strong negative correlation.
A coefficient around 0 indicates little to no correlation.
Use these insights to manage risk and diversify your portfolio effectively.
Example Use Case:
Suppose you are trading the S&P 500 and want to understand its correlation with the NASDAQ 100 and a particular stock, such as Apple. By setting the S&P 500 as the reference market, the NASDAQ 100 as the third market, and observing the current market (Apple), you can see how these instruments move in relation to each other. This can help you decide on hedging strategies or identify opportunities for diversification. However this is Not a Financial advise
Market Pivot Levels [Past & Live]Market Levels provide a robust view of daily pivot points of markets such as high/low/close with both past and live values shown at the same time using the recently updated system of polylines of pinescript.
The main need for this script arose from not being able to use plots for daily points because plots are inherently once drawn can't be erased and because we can't plot stuff for previous bars after values are determined we can't use them reliably. And while we can use traditional lines, because we would have extremely high amount of lines and we would have to keep removing the previous ones it wouldn't be that effective way for us. So we try to do it with the new method of polylines .
Features of this script:
- Daily High/Low Points
- Yesterday High/Low/Close Points
- Pre-Market High-Low points.
Now let's preview some of the important points of code and see how we achieve this:
With the code below we make sure no matter which chart we are using we are getting the extended hours version of sessions so our calculations are made safely for viewing pre-market conditions.
// Let's get ticker extended no matter what the current chart is
tc = ticker.new(syminfo.prefix, syminfo.ticker, session.extended)
Coding our own function to calculate high's and low's because inbuilt pinescript function cannot take series and we send this function to retrieve our high's and lows.
// On the fly function to calculate daily highlows instead of tv inbuilt because tv's length cannot take series
f_highlow(int last) =>
bardiff = last
float _low = low, float _high = high
for i = bardiff to 0 by 1
if high > _high
_high := high
if low < _low
_low := low
With doing calculations at the bars of day ending points we can retrieve the correct points and values and push them for our polylines array so it can be used in best way possible.
// Daily change points
changeD = timeframe.change("D")
// When new day starts fill polyline arrays with previous day values for polylines to draw on chart
// We also update prevtime values with current ones after we pushed to the arrays
if changeD
f_arrFill(cpArrHigh, cpArrLow, prevArrh, prevArrl, prevArrc, prevMarh, prevMarl)
valHolder.unshift(valueHold.new(_high, _low, _high, _close, _low, time, pr_h, pr_l))
The rest of the code is annotated and commented. You can let me know in comments if you have any questions. Happy trading.

K`s Extreme DurationExtreme duration uses a special combination of the RSI and its relative position to deliver a reversal signal.
The following are the conditions to generate signals:
* Bullish signal: The current 8-period RSI is below 50 and above 35 while the previous 5 RSI's are below 35.
* Bearish signal: The current 8-period RSI is above 50 and below 65 while the previous 5 RSI's are above 65.

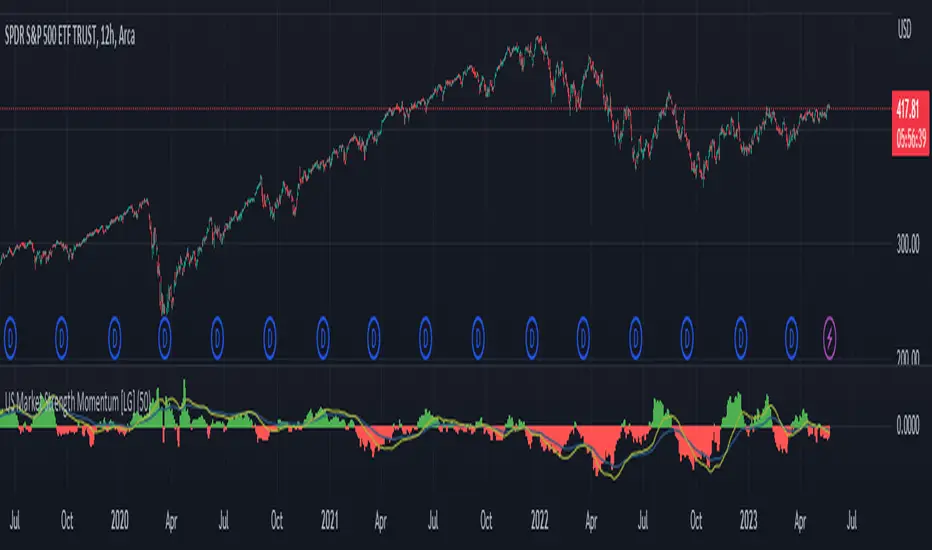
US Market Strength Momentum [LG]This indicator is designed to analyze the relative strength momentum of two US market indices, the Russell 2000 and S&P 500, by calculating their rate of change over a 21-bar period and comparing them. The difference between the average rate of change for IWM and SPY is then plotted as a histogram, with green bars indicating positive momentum and red bars indicating negative momentum.
The indicator also includes a moving average line, calculated over a 200-bar period, which is plotted on top of the histogram. This moving average helps to smooth out the data and provide a clearer picture of the longer-term trend.
In this indicator, the strength of the Russell 2000 compared to S&P 500 is seen as a gauge of market participants' risk tolerance. When Russell outperforms the S&P, market participants are assumed to be taking on greater risk in search of greater beta. When the S&P outperforms Russell, the assumption is that market participants are fleeing to safer assets (in regards to equities indices). The time frame the indicator is viewed on as well as the size of the rate of change delta dictates the strength of the trend.
MarketronShows you how the asset on the chart is trending versus the market. You can customise the market that it uses, and there are some common markets programmed in as options.
Displays moving averages and a simple red/green bias.
You could do this yourself by typing, e.g., ADAUSDT/TOTAL into the asset box in TradingView and adding some EMAs manually and then interpreting them by eye. There's no hidden technology in this indicator. It just makes it a lot easier.
You can choose various bias options.
I'm not sure if it will work at resolutions lower than one day, depending on the level of your TradingView plan.
These are all the user-configurable settings and what they do.
Market (Auto) – Choose from various preselected markets.
Market Ticker Manual Override – You can type in the ticker for your market if it's not in the list. If you do, it overrides the Auto list.
Show Classic EMAs – Show customisable Exponential Moving Averages.
Bias Mode – Derive the red/green bias from whether price is above/below the Classic EMAs, or from a custom EMA function, or both.
Show Bias Background – Colour the background, or not, with the directional bias.
EMA 1 Length (smallest) – The length for the smallest EMA.
EMA 2 Length – Length for the second EMA.
EMA 3 Length – Length for the third EMA.

Time Zone / Market SessionsTime Zone / Market Sessions indicator is a handy tool to display current major Market Open / Close condition along with present time at that Exchange. Sydney, Tokyo, London, New York market sessions are included. Clear display of Overlap Zones and Kill Zones.. Can be used to estimate market Pumping and Dumping. Alerts can be set when a market opens.
Time is Displayed in Table Layout
Active Market is displayed as Dots on top and bottom
You can select as Timeline or Table display
Overlap is clearly displayed on top and bottom without any mess
Gray color in Table layout Shows Closed Markets
You are free to reuse this code No Limitations.
Kill Zones are indicated in Table format. When some of the markets are closed
Alerts included for market openings
CPI and PPIMarket tracker of the year-on-year (YoY) change in inflation (both PPI Finished Goods and CPI).
Useful for identifying the turns in market conditions, and therefore helps with anticipation of changes in monitory policy.
This metric can be used to inform about current market conditions and potential risk=reward outcomes in the future.

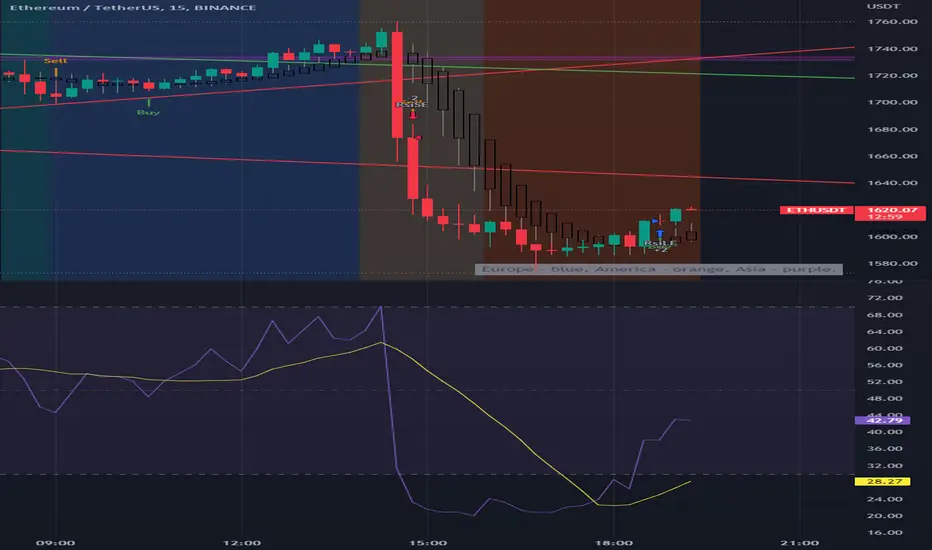
BTC Europe-America-Asia market backgrounds - 1h max frameMarket indicator - Europe - America - Asia.
Based on my trading experience. Therefore, time zones are of different sizes.
Eurobond CurveABOUT
Dynamically plots 3 no. forward EUROBOND curves. When the curves converge (or worse crossover) there is higher risk of financial uncertainty and potential market correction.
The Eurobond Curves work in a similar way to treasury "yield curve inversion"; except the EUROBOND curves can signal much earlier than Treasuries therefore providing a leading indicator.
The indicator looks the the "near" (next year EUROBOND), "mid" (EUROBOND 2 years out) and "far" (EUROBOND 5 years out) to assess for crossovers.
When the "near" and "mid" curves crossover the "far" curve, concerning economic conditions are developing and it may be a good idea to reduce risk exposure to markets.
LIMITATIONS
The EUROBOND curve crossover events are rare, and this indicator uses data back to 2005 (using approximately 25 TradingView security functions). Given there are relatively few crossover events, the reliability of this indicator should be considered low. Nonetheless, there is decent alignment with treasury yield curve inversions in the 20 year period assessed. Given treasury yield curve inversions have predicted every recession for the last 70 years, we still think the EUROBOND Curves are a useful datapoint to monitor into the future and provide confluence to other risk management strategies.

Market Sessions Open/Close LevelsThis indicator displays the market open and close price levels for the main trading sessions (Sydney, Tokyo, Frankfurt, London and New York). The Daily Line changes color depending on if price is trading above or below the level. Feel free to add or replace levels depending on your trading style and trading times.

Bitcoin Stacked VolumesThe idea was to keep Bitcoin trading volumes on the different exchanges under control using only one chart and only one indicator. It works on ANY timeframe.
Settings
Lookback for SMA of volume from each exchange (default: 21 )
Option to include or not volumes that traded in stablecoin pairs (default: true )
Customizable volume quotas for alerts
Alerts
It has 30 different alerts which can be divided into 4 types:
Total Quota Exceeded
Total Volume/SMA Crossover
Quota Exceeded
Volume/SMA Crossover
Here are some examples how it helps to be aware the situation on 1-minute resolution:
